


【PHP配置】
为PHP安装xdebug,方法略。
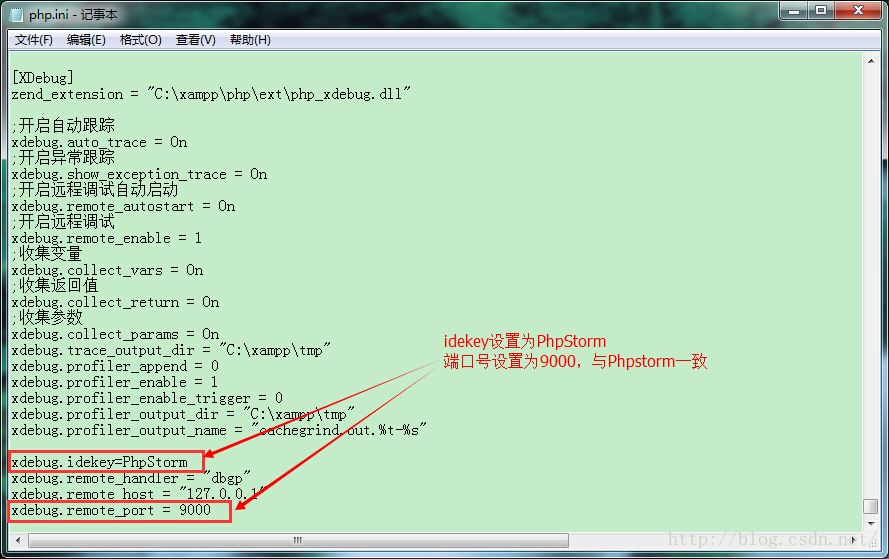
配置文件php.ini
[XDebug]
zend_extension = "C:\xampp\php\ext\php_xdebug.dll"
;开启自动跟踪
xdebug.auto_trace = On
;开启异常跟踪
xdebug.show_exception_trace = On
;开启远程调试自动启动
xdebug.remote_autostart = On
;开启远程调试
xdebug.remote_enable = 1
;收集变量
xdebug.collect_vars = On
;收集返回值
xdebug.collect_return = On
;收集参数
xdebug.collect_params = On
xdebug.trace_output_dir = "C:\xampp\tmp"
xdebug.profiler_append = 0
xdebug.profiler_enable = 1
xdebug.profiler_enable_trigger = 0
xdebug.profiler_output_dir = "C:\xampp\tmp"
xdebug.profiler_output_name = "cachegrind.out.%t-%s"
xdebug.idekey=PhpStorm
xdebug.remote_handler = "dbgp"
xdebug.remote_host = "127.0.0.1"
xdebug.remote_port = 9000
【phpstorm配置】
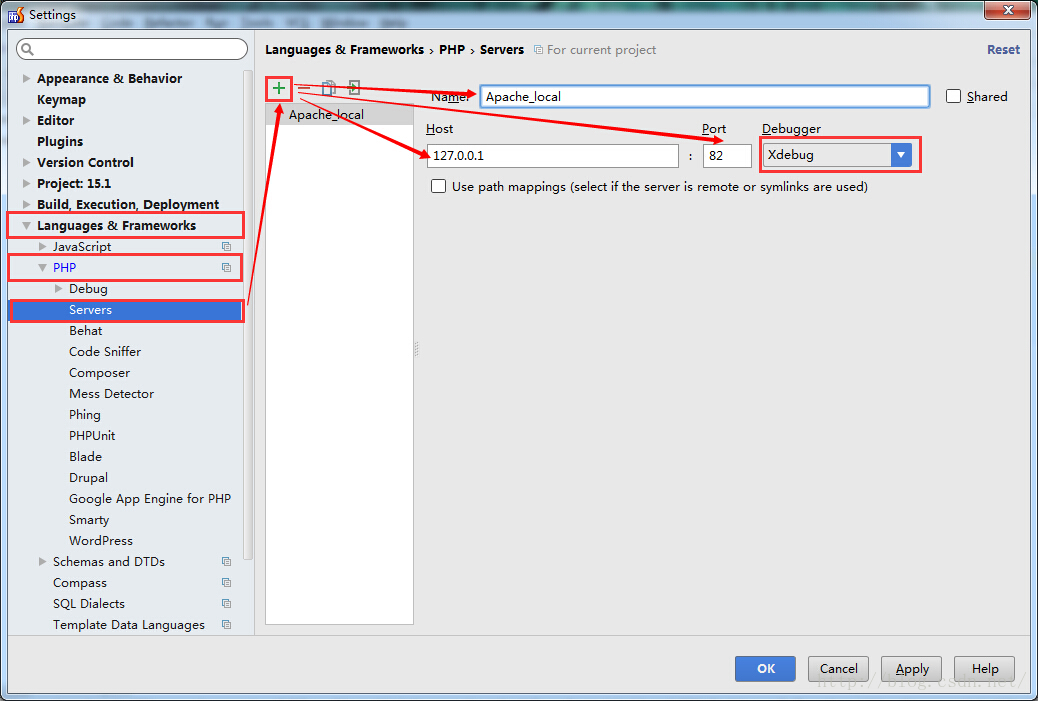
File>Settings>Languages&Frameworks>PHP>Servers
添加一个Server。
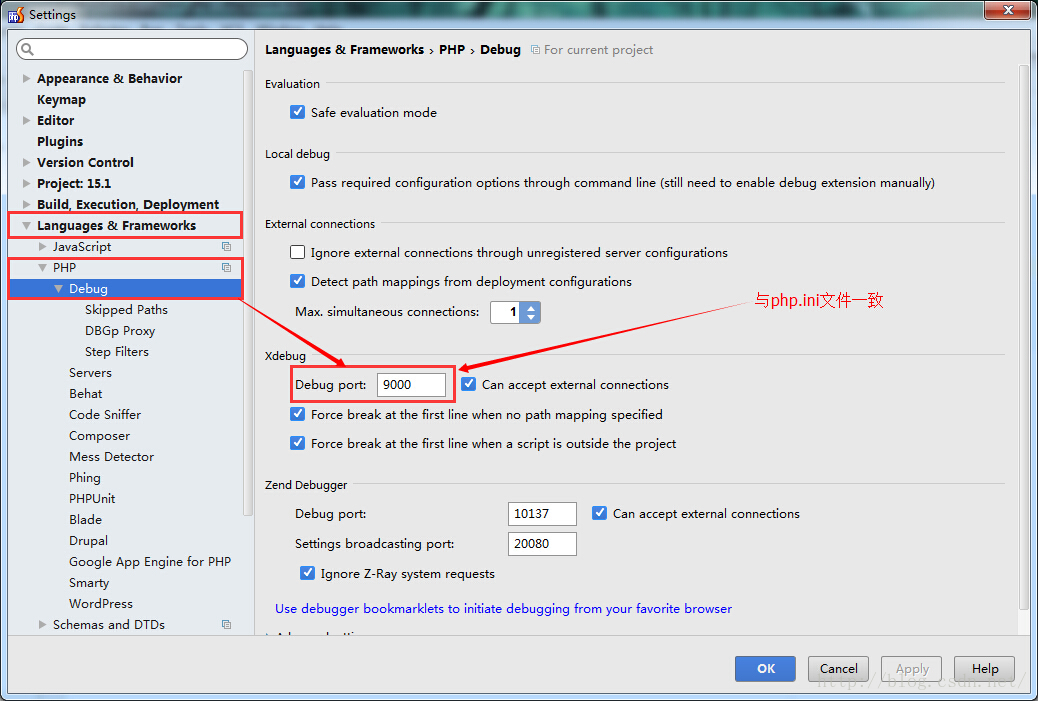
File>Settings>Languages&Frameworks>PHP>Debug
看到XDebug选项卡,port填9000,其他默认。
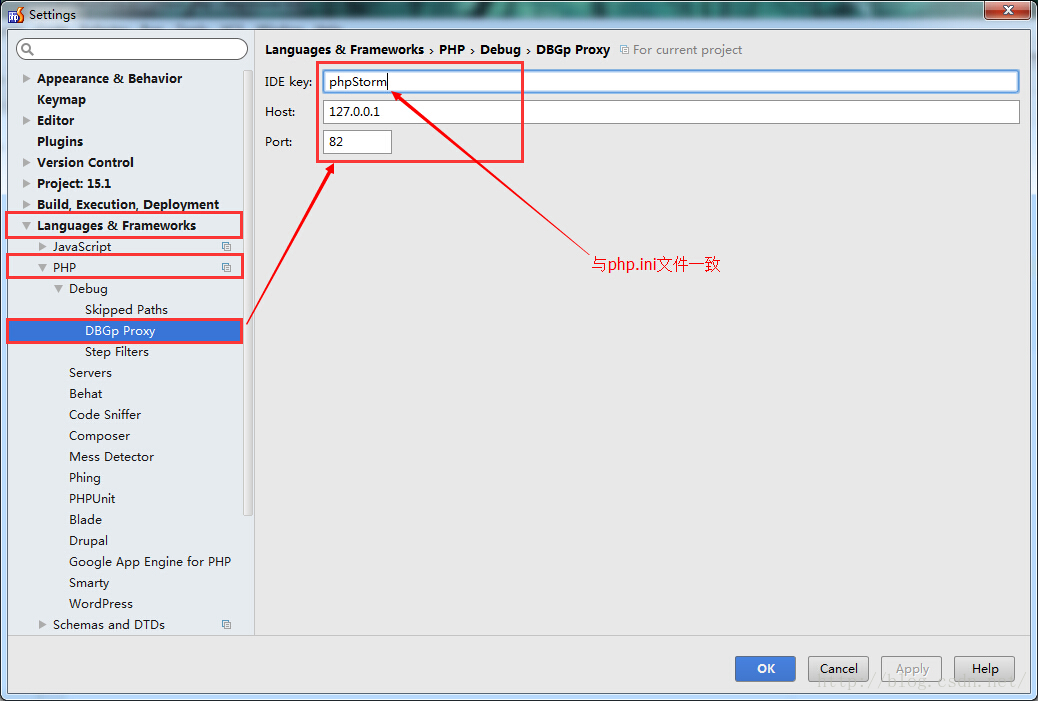
File>Settings>Languages&Frameworks>PHP>Debug>DBGp Proxy
IDE key 填 phpStorm,host 填localhost,port 填82。
浏览器设置(火狐、谷歌使用另外的方式)
衔接 http://www.jetbrains.com/phpstorm/marklets,在左边填上phpStorm,点generate,把下面的链接添加到收藏夹,方便调用。

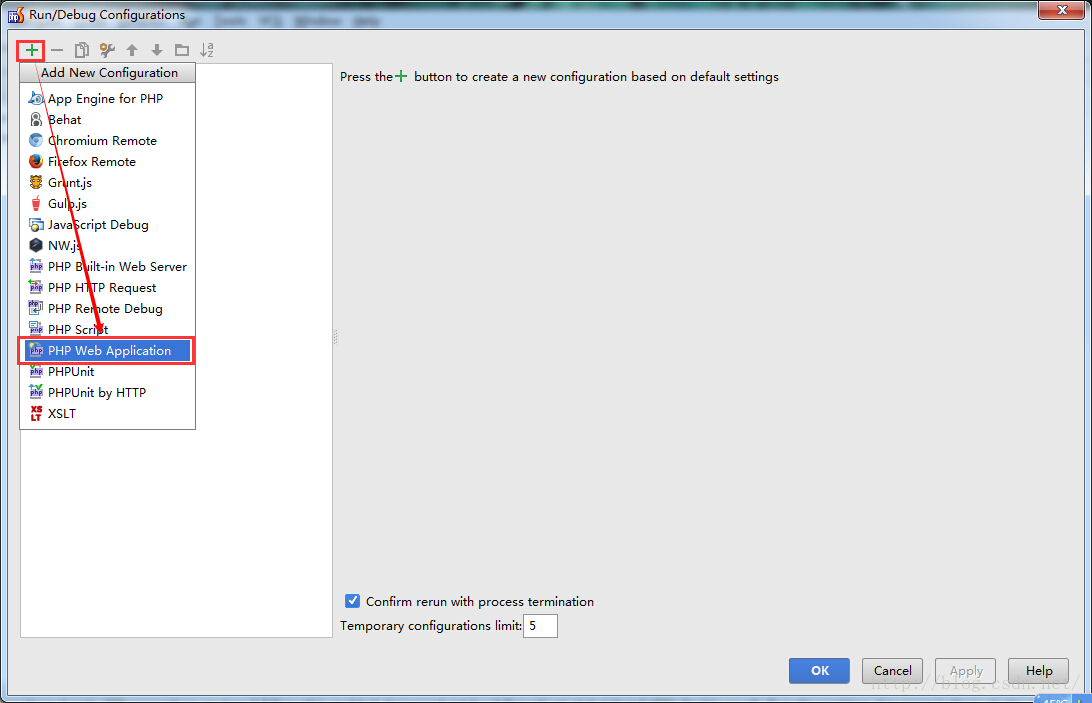
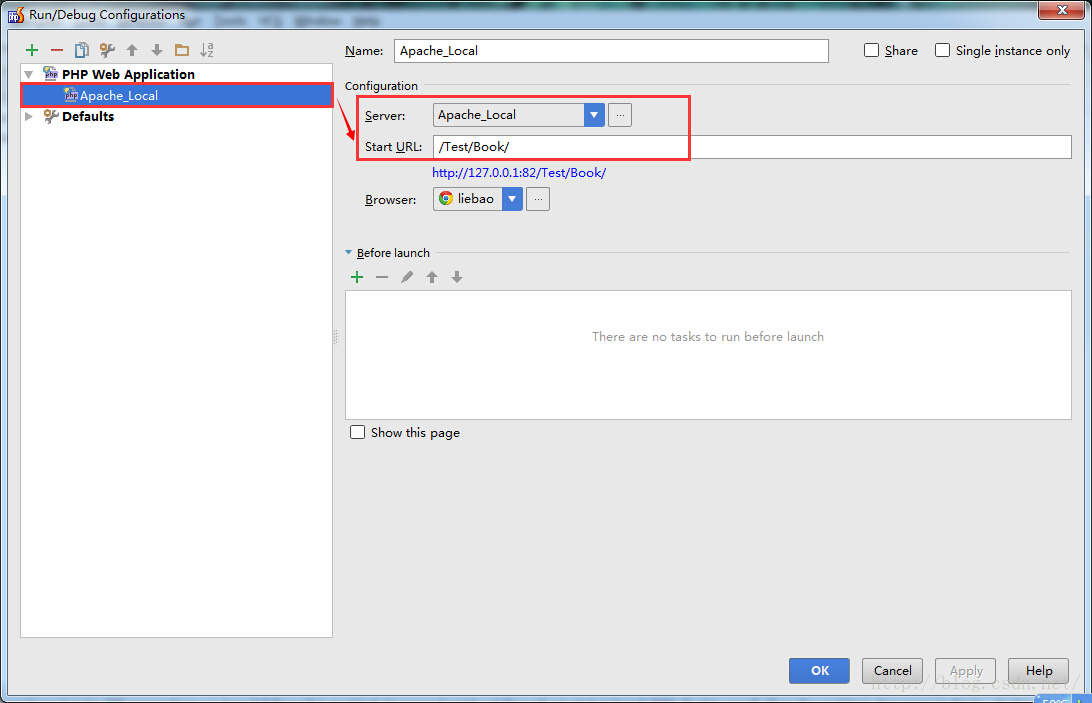
Run>Edit Configurations
添加Web调试服务器
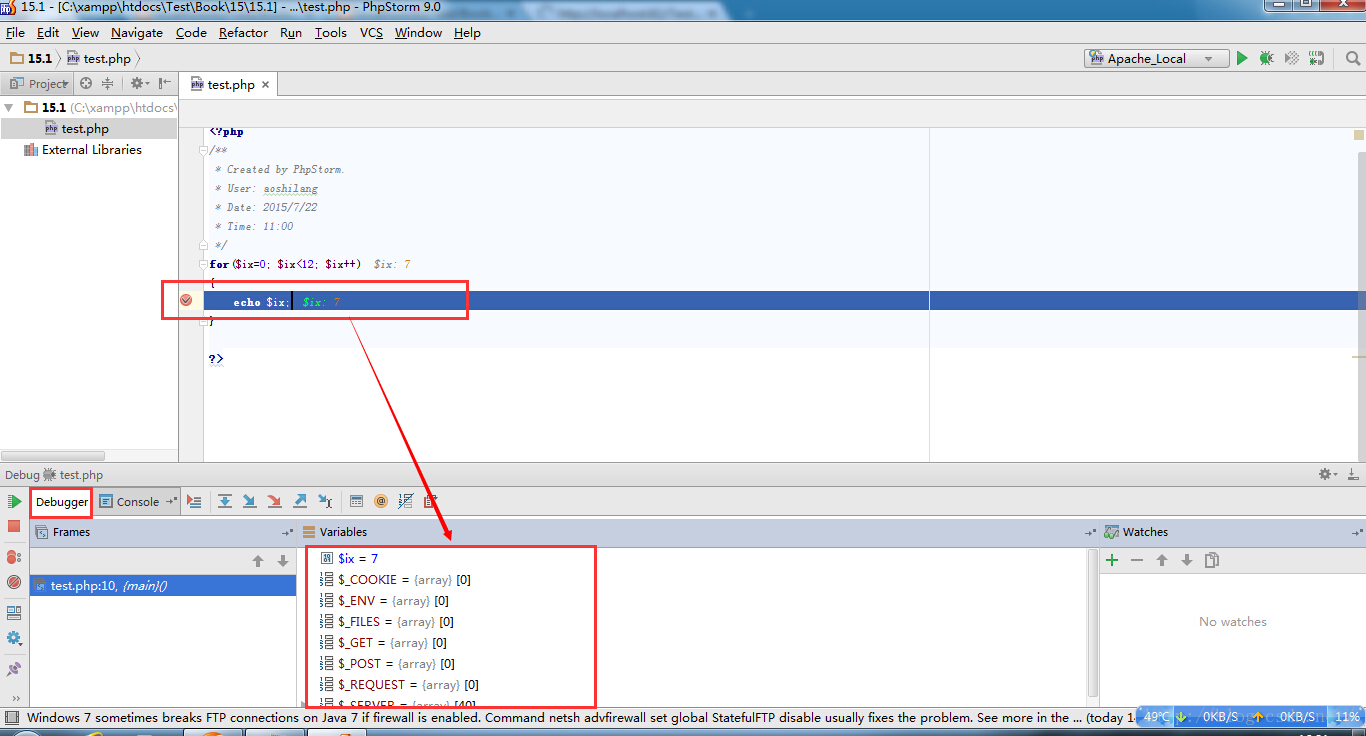
启动监听
在phpstorm中设置断点后,启动监听,就是电话一样的图标。用chrome浏览localhost中的指定断点的文件,会自动进入断点,在phpstorm中看到调试信息。


 988
988

 被折叠的 条评论
为什么被折叠?
被折叠的 条评论
为什么被折叠?
 到【灌水乐园】发言


