


前言:在android开发过程中,图表是使用比较频繁的功能,目前开源的框架也比较多,如大名鼎鼎的mpChart,WilliamChart等。
不过在使用过程中,各有各的好处,如mpChart在我使用lineChart的时候效果总是不太如意,而WilliamChart的使用在studio环境中表现不错,但是在eclipse环境中总是报错。无法集成。所以网上搜索了其他的开源框架,找到了hellochart开源项目。
试用之后表现不错,特推荐大家使用。
http://download.csdn.net/detail/xygy8860/9375426
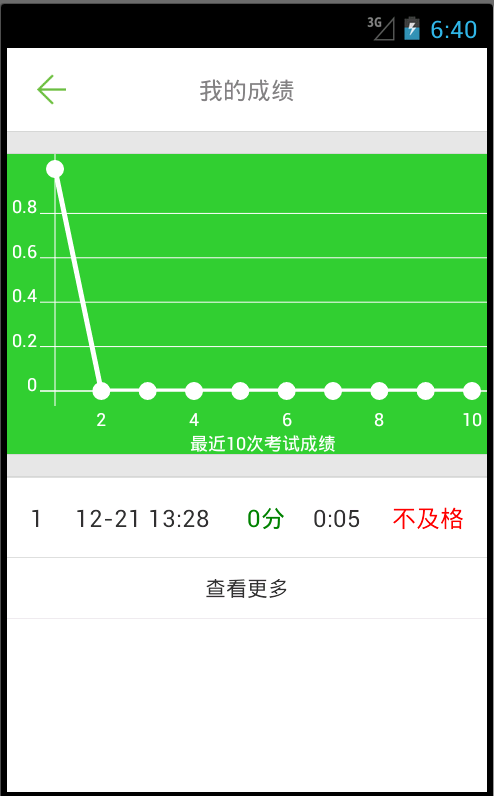
1.首先是折线图
布局很简单
<lecho.lib.hellocharts.view.LineChartView
	        android:id="@+id/chart"
	        android:layout_width="match_parent"
	        android:layout_height="200dp"
	        android:background="#32CD32"
	        >
	   </lecho.lib.hellocharts.view.LineChartView>
然后在activity中findViewById即可。
下面的变量是对lineChart的配置,可以显示多行,我都写上了注释。
/*******************    hellochart            ******************/

	@Bind(R.id.chart)  lecho.lib.hellocharts.view.LineChartView chart;

	private boolean hasAxes = true;
    private boolean hasAxesNames = true; // 横竖行的名字
    private boolean hasLines = true;
    private boolean hasPoints = true;
    private ValueShape shape = ValueShape.CIRCLE;
    private boolean isFilled = false;
    private boolean hasLabels = false; // 是否显示点的数据
    private boolean isCubic = false;
    private boolean hasLabelForSelected = false;
    private boolean pointsHaveDifferentColor;

    private LineChartData data;
    private int numberOfLines = 1; // 只显示一行数据
    private int maxNumberOfLines = 1; // 如果为4则表示最多显示4行,1表示只有一行数据
    private int numberOfPoints = 10; // 每行数据有多少个点
    // 存储数据
    float[][] randomNumbersTab = new float[maxNumberOfLines][numberOfPoints];
然后是对数据进行处理,最主要的是一个generateData()的函数。
/**
     * helloChart的初始化入口
     */
    private void generateData() {
    	int whiteColor = getResources().getColor(R.color.white);

    	generateValues();
        List<Line> lines = new ArrayList<Line>();

		for (int i = 0; i < numberOfLines; ++i) {

            List<PointValue> values = new ArrayList<PointValue>();

			for (int j = 0; j < numberOfPoints; ++j) {
                values.add(new PointValue(j+1, randomNumbersTab[i][j]));
            }

            Line line = new Line(values);
            //line.setColor(ChartUtils.COLORS[i]); // 多条数据时选择这个即可
            line.setColor(whiteColor); // 定制线条颜色
            line.setShape(shape);
            line.setCubic(isCubic);
            line.setFilled(isFilled);
            line.setHasLabels(hasLabels);
            line.setHasLabelsOnlyForSelected(hasLabelForSelected);
            line.setHasLines(hasLines);
            line.setHasPoints(hasPoints);
            if (pointsHaveDifferentColor){
            	//多条数据时选择这个即可
                //line.setPointColor(ChartUtils.COLORS[(i + 1) % ChartUtils.COLORS.length]);
            	line.setPointColor(whiteColor);
            }
            lines.add(line);
        }

        data = new LineChartData(lines);

        if (hasAxes) {
            Axis axisX = new Axis();
            Axis axisY = new Axis().setHasLines(true);
            if (hasAxesNames) {
                axisX.setName("最近10次考试成绩");
                axisY.setName("");
                axisX.setTextColor(whiteColor);
                axisY.setTextColor(whiteColor);
                axisY.setLineColor(whiteColor);
                axisX.setLineColor(whiteColor);
            }
            data.setAxisXBottom(axisX);
            data.setAxisYLeft(axisY);
        } else {
            data.setAxisXBottom(null);
            data.setAxisYLeft(null);
        }

        data.setBaseValue(Float.NEGATIVE_INFINITY);
        chart.setLineChartData(data);

    }
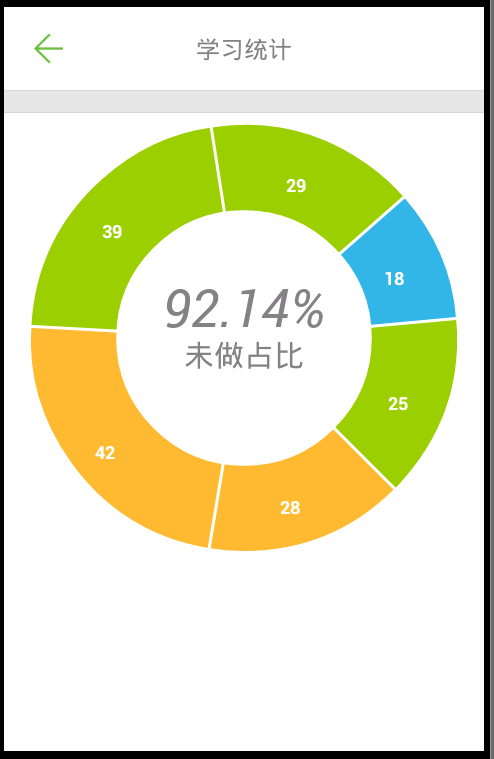
2.PieChart的使用
与lineChart的使用类似,首先是布局文件
	  <lecho.lib.hellocharts.view.PieChartView
        android:id="@+id/piechart"
        android:layout_width="match_parent"
        android:layout_height="300dp" >
    </lecho.lib.hellocharts.view.PieChartView>
然后是activity的变量设置
	/******************** PieChart *****************************/
	@Bind(R.id.piechart)  lecho.lib.hellocharts.view.PieChartView chart;
	private PieChartData data;

    private boolean hasLabels = true; // 是否显示数据
    private boolean hasLabelsOutside = false; // 数据是否显示在外面
    private boolean hasCenterCircle = true; // 是否含有中圈,显示下面的内容这个必须为true
    private boolean hasCenterText1 = true; // 圆中是否含有内容1
    private boolean hasCenterText2 = true; // 圆中是否含有内容2
    private boolean isExploded = false; // 是否爆破形式
    private boolean hasLabelForSelected = false; // 是否选中显示数据,一般为false

    /******************** PieChart *****************************/
最后则是函数的调用
	private void generateData() {
        int numValues = 6;

        List<SliceValue> values = new ArrayList<SliceValue>();
        for (int i = 0; i < numValues; ++i) {
            SliceValue sliceValue = new SliceValue((float) Math.random() * 30 + 15, ChartUtils.pickColor());
            values.add(sliceValue);
        }

        data = new PieChartData(values);
        data.setHasLabels(hasLabels);
        data.setHasLabelsOnlyForSelected(hasLabelForSelected);
        data.setHasLabelsOutside(hasLabelsOutside);
        data.setHasCenterCircle(hasCenterCircle);
        // 设置不显示数据的背景颜色
        data.setValueLabelBackgroundEnabled(false);

        if (isExploded) {
            data.setSlicesSpacing(24);
        }

        if (hasCenterText1) {
            data.setCenterText1("92.14%");

            // Get roboto-italic font.
            Typeface tf = Typeface.createFromAsset(getAssets(), "Roboto-Italic.ttf");
            data.setCenterText1Typeface(tf);

            // Get font size from dimens.xml and convert it to sp(library uses sp values).
            data.setCenterText1FontSize(ChartUtils.px2sp(getResources().getDisplayMetrics().scaledDensity,
                    (int) getResources().getDimension(R.dimen.pie_chart_text1_size)));
            data.setCenterText1Color(getResources().getColor(R.color.gray));
        }

        if (hasCenterText2) {
            data.setCenterText2("未做占比");

            //Typeface tf = Typeface.createFromAsset(getAssets(), "Roboto-Italic.ttf");
            //data.setCenterText2Typeface(tf);
            data.setCenterText2FontSize(ChartUtils.px2sp(getResources().getDisplayMetrics().scaledDensity,
                    (int) getResources().getDimension(R.dimen.pie_chart_text2_size)));
            data.setCenterText2Color(getResources().getColor(R.color.gray));
        }

        chart.setPieChartData(data);
    }
3.当然其他图表的使用可以参考github。


 285
285


 被折叠的 条评论
为什么被折叠?
被折叠的 条评论
为什么被折叠?
 到【灌水乐园】发言


