


 本文详细介绍了Android内存泄露检测工具LeakCanary的使用方式和原理,包括如何检测对象是否被回收、何时执行观测、分析hprof文件等。LeakCanary简化了内存泄露检测的过程,使得开发者无需手动进行复杂的内存分析。
原创地址:http://blog.csdn.net/zivensonice/article/details/51639763
曾经检测内存泄露的方式
让我们来看看在没有LeakCanary之前,我们怎么来检测内存泄露
1. Bug收集
通过Bugly、友盟这样的统计平台,统计Bug,了解OutOfMemaryError的情况。
2. 重现问题
对Bug进行筛选,归类,排除干扰项。然后为了重现问题,有时候你必须找到出现问题的机型,因为有些问题只会在特定的设备上才会出现。为了找到特定的机型,可能会想尽一切办法,去买、去借、去求人(14年的时候,上家公司专门派了一个商务去广州找了一家租赁手机的公司,借了50台手机回来,600块钱一天)。然后,为了重现问题,一遍一遍的尝试,去还原当时OutOfMemaryError出现的原因,用最原始、最粗暴的方式。
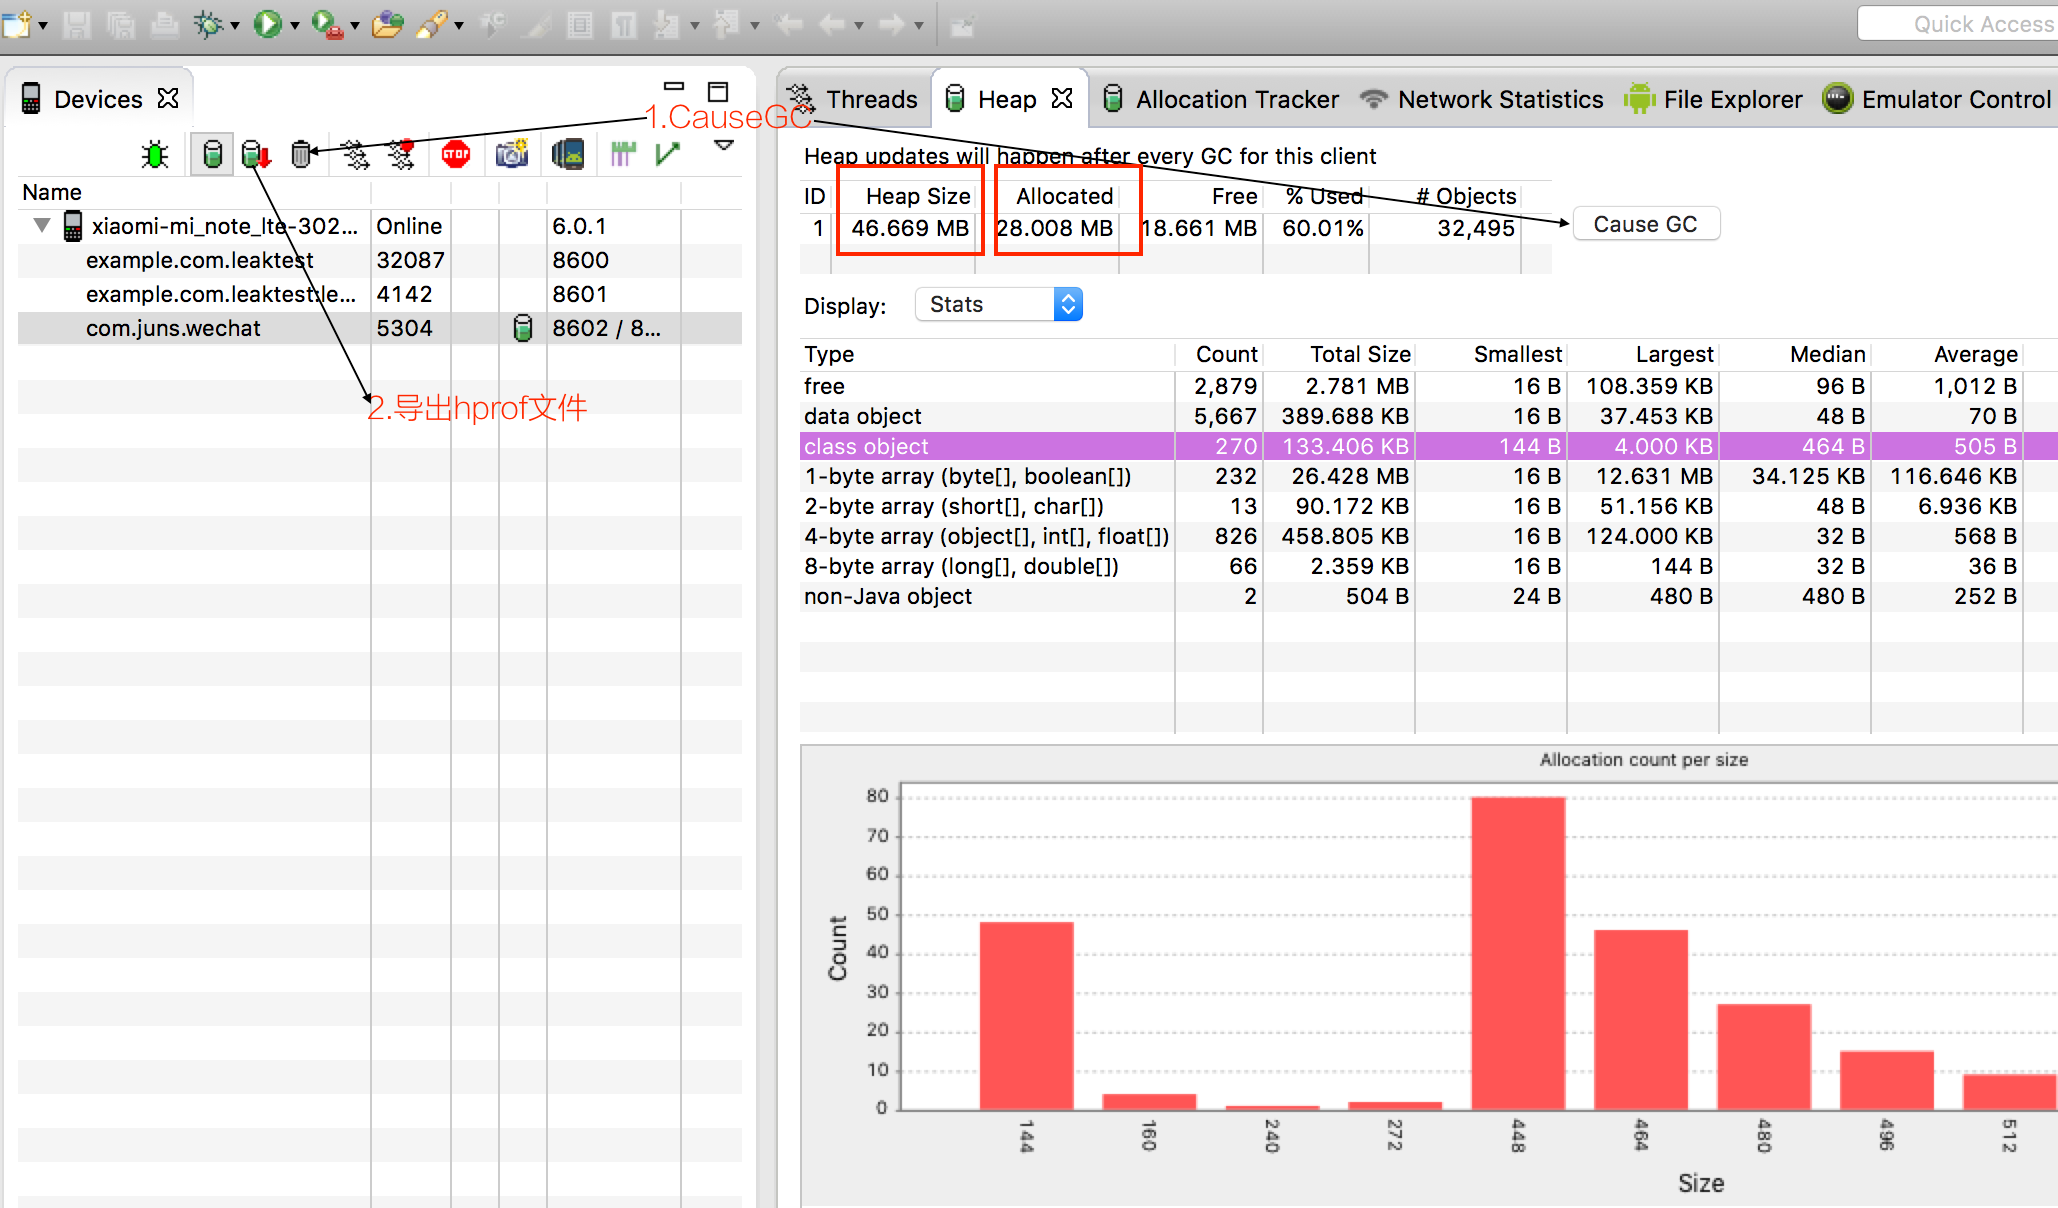
3. Dump导出hprof文件
使用Eclipse ADT的DDMS,观察Heap,然后点击手动GC按钮(Cause GC),观察内存增长情况,导出hprof文件。
主要观测的两项数据:
3-1. Heap Size的大小,当资源增加到堆空余空间不够的时候,系统会增加堆空间的大小,但是超过可分配的最大值(比如手机给App分配的最大堆空间为128M)就会发生OutOfMemaryError,这个时候进程就会被杀死。这个最大堆空间,不同手机会有不同的值,跟手机内存大小和厂商定制过后的系统存在关联。
3-2. Allocated堆中已分配的大小,这是应用程序实际占用的大小,资源回收后,这项数据会变小。
查看操作前后的堆数据,看是否存在内存泄露,比如反复打开、关闭一个页面,看看堆空间是否会一直增大。
4. 然后使用MAT内存分析工具打开,反复查看找到那些原本应该被回收掉的对象。
5. 计算这个对象到GC roots的最短强引用路径。
6. 确定那个路径中那个引用不该有,然后修复问题。
很麻烦,不是吗。现在有一个类库可以直接解决这个问题
LeakCanary
使用方式
使用AndroidStudio,在Module.app的build.gradle中引入
 dependencies {
   debugCompile 'com.squareup.leakcanary:leakcanary-android:1.4-beta2'
   releaseCompile 'com.squareup.leakcanary:leakcanary-android-no-op:1.4-beta2'
   testCompile 'com.squareup.leakcanary:leakcanary-android-no-op:1.4-beta2'
}然后在Application中重写onCreate()方法
public class ExampleApplication extends Application {


  @Override public void onCreate() {
    super.onCreate();
    LeakCanary.install(this);
  }
}
在Activity中写一些导致内存泄露的代码,当发生内存泄露了,会在通知栏弹出消息,点击跳转到泄露页面
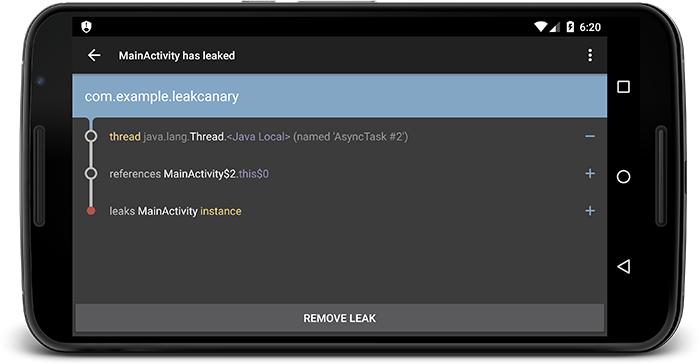
LeakCanary 可以做到非常简单方便、低侵入性地捕获内存泄漏代码,甚至很多时候你可以捕捉到 Android 系统组件的内存泄漏代码,最关键是不用再进行(捕获错误+Bug归档+场景重现+Dump+Mat分析) 这一系列复杂操作,6得不行。
原理分析
如果我们自己实现
首先,设想如果让我们自己来实现一个LeakCanary,我们怎么来实现。
按照前面说的曾经检测内存的方式,我想,大概需要以下几个步骤:
1. 检测一个对象,查看他是否被回收了。
2. 如果没有被回收,使用DDMS的dump导出.hprof文件,确定是否内存泄露,如果泄露了导出最短引用路径
3. 把最短引用路径封装到一个对象中,用Intent发送给Notification,然后点击跳转到展示页,页面展示
检测对象,是否被回收
我们来看看,LeakCanary是不是按照这种方式实现的。除了刚才说的只需要在Application中的onCreate方法注册LeakCanary.install(this);这种方式。 查看源码,使用官方给的Demo示例代码中,我们发现有一个RefWatcher对象,也可以用来监测,看看它是如何使用的。
MainActivity.class
    @Override
    protected void onCreate(Bundle savedInstanceState) {
        super.onCreate(savedInstanceState);
        setContentView(R.layout.activity_main);
        RefWatcher refWatcher = LeakCanary.androidWatcher(getApplicationContext(),
                new ServiceHeapDumpListener(getApplicationContext(), DisplayLeakService.class),
                AndroidExcludedRefs.createAppDefaults().build());
        refWatcher.watch(this);
}就是把MainActivity作为一个对象监测起来,查看refWatcher.watch(this)的实现
  public void watch(Object watchedReference) {
    watch(watchedReference, "");
  }

  /**
   * Watches the provided references and checks if it can be GCed. This method is non blocking,
   * the check is done on the {@link Executor} this {@link RefWatcher} has been constructed with.
   *
   * @param referenceName An logical identifier for the watched object.
   */
  public void watch(Object watchedReference, String referenceName) {
    Preconditions.checkNotNull(watchedReference, "watchedReference");
    Preconditions.checkNotNull(referenceName, "referenceName");
    if (debuggerControl.isDebuggerAttached()) {
      return;
    }
    final long watchStartNanoTime = System.nanoTime();
    String key = UUID.randomUUID().toString();
    retainedKeys.add(key);
    final KeyedWeakReference reference =
        new KeyedWeakReference(watchedReference, key, referenceName, queue);

    watchExecutor.execute(new Runnable() {
      @Override public void run() {
        ensureGone(reference, watchStartNanoTime);
      }
    });
  }
可以总结出他的实现步骤如下:
1. 先检查监测对象是否为空,为空抛出异常
2. 如果是在调试Debugger过程中允许内存泄露出现,不再监测。因为这个时候监测的对象是不准确的,而且会干扰我们调试代码。
3. 给监测对象生成UUID唯一标识符,存入Set集合,方便查找。
4. 然后定义了一个KeyedWeakReference,查看下KeyedWeakReference是个什么玩意
public final class KeyedWeakReference extends WeakReference<Object> {


  public final String key;
  public final String name;

  KeyedWeakReference(Object referent, String key, String name,
      ReferenceQueue<Object> referenceQueue) {
    super(Preconditions.checkNotNull(referent, "referent"), Preconditions.checkNotNull(referenceQueue, "referenceQueue"));
    this.key = Preconditions.checkNotN
最低0.47元/天 解锁文章


 被折叠的 条评论
为什么被折叠?
被折叠的 条评论
为什么被折叠?
 到【灌水乐园】发言


