


打开前端Vue项目kongguan_web,创建前端 src/components/WarnStatistice.vue 页面,并使用ECharts插件实现柱状图
- src/components/WarnStatistice.vue 页面div设计,代码如下:
<template>
    <div>
       <div class="home">
         <div id="map-chart-05"></div>
       </div>
     </div>
</template>
... 略 ...- 引入 ECharts插件和Api路由文件,代码如下:
... 略 ...
<script>
  import echarts from "echarts";
  import {getAnnualWarningAreaStatistics} from "../api/user/api.js";
... 略 ... - 初始化ECharts,设置title、tooltip、legend、grid,代码如下:
... 略 ...
  export default {
    name: "Home",
    data() {
      return {
        chart: null,
        geoCoordMap: {},
        charVal:[],
        charValData:[]
      };
    },
    mounted() {
      this.loadData();
    },
    methods: {
      initChart() {

        const option = {
              title: {
                  text: '年度告警区域统计',
                top: 18,
                left: 26,
              },
              tooltip: {
                  trigger: 'axis',
                  axisPointer: {
                      type: 'shadow'
                  }
              },
              legend: {
                  data: ['2011年']
              },
              grid: {
                  left: '3%',
                  right: '4%',
                  bottom: '3%',
                  containLabel: true
              },
... 略 ... - 设置柱状图的X轴和Y轴,代码如下:
... 略 ...
              xAxis: {
                  type: 'value',
                  boundaryGap: [0, 0.01],
                  show:false,
              },
              yAxis: {
                  type: 'category',
                  data: this.charVal,
                  show:true,
                  axisLabel:{
                    color:'#bdcad3'
                  },
                  axisTick:{
                    show:false
                  },
                  axisLine:{
                    lineStyle:{
                      color:'#bdcad3'
                    },
                    show:true
                  }
              },
... 略 ... - 设置渲染的值,代码如下:
... 略 ...
              series: [
                  {
                      name: '',
                      type: 'bar',
                      itemStyle:{
                        normal:{
                          color:'#7d93fe'
                        }
                      },
                      barGap:35,
                      barWidth:20,
                      data: this.charValData
                  }
              ]

        };
        this.chart = echarts.init(document.getElementById("map-chart-05"));
        this.chart.setOption(option);
      },
... 略 ... - 获取后端数据展示,代码如下:
... 略 ...
      loadData(){
        getAnnualWarningAreaStatistics().then(data => {

          if (data.isSuccess) {
            var res  = data.result;
            for(var i =0;i<res.length;i++){
              this.charVal[i] = res[i]['gjSector'];
              this.charValData[i] = res[i]['gjCount'];
            }
            this.initChart();
          } else {
            this.$message.error("数据获取失败");
          }
        });

      }
    }
  };
</script>

<style>
  #map-chart-05 {
    height: 700px;
    margin: 0 auto;
    background-color: #ffffff;
    border: 1px solid #ebedf2;
    border-radius: 10px;
    box-shadow: 3px 3px 3px 3px #ebedf2;
  }
</style>- src/components/WarnStatistice.vue 页面的完整代码如下:
<template>
    <div>
       <div class="home">
         <div id="map-chart-05"></div>
       </div>
     </div>
</template>

<script>
  import echarts from "echarts";
  import {getAnnualWarningAreaStatistics} from "../api/user/api.js";
  export default {
    name: "Home",
    data() {
      return {
        chart: null,
        geoCoordMap: {},
        charVal:[],
        charValData:[]
      };
    },
    mounted() {
      this.loadData();
    },
    methods: {
      initChart() {
        const option = {
              title: {
                  text: '年度告警区域统计',
                top: 18,
                left: 26,
              },
              tooltip: {
                  trigger: 'axis',
                  axisPointer: {
                      type: 'shadow'
                  }
              },
              legend: {
                  data: ['2011年']
              },
              grid: {
                  left: '3%',
                  right: '4%',
                  bottom: '3%',
                  containLabel: true
              },
              xAxis: {
                  type: 'value',
                  boundaryGap: [0, 0.01],
                  show:false,
              },
              yAxis: {
                  type: 'category',
                  data: this.charVal,
                  show:true,
                  axisLabel:{
                    color:'#bdcad3'
                  },
                  axisTick:{
                    show:false
                  },
                  axisLine:{
                    lineStyle:{
                      color:'#bdcad3'
                    },
                    show:true
                  }
              },
              series: [
                  {
                      name: '',
                      type: 'bar',
                      itemStyle:{
                        normal:{
                          color:'#7d93fe'
                        }
                      },
                      barGap:35,
                      barWidth:20,
                      data: this.charValData
                  }
              ]

        };
        this.chart = echarts.init(document.getElementById("map-chart-05"));
        this.chart.setOption(option);
      },
      loadData(){
        getAnnualWarningAreaStatistics().then(data => {

          if (data.isSuccess) {
            var res  = data.result;
            for(var i =0;i<res.length;i++){
              this.charVal[i] = res[i]['gjSector'];
              this.charValData[i] = res[i]['gjCount'];
            }
            this.initChart();
          } else {
            this.$message.error("数据获取失败");
          }
        });
      }
    }
  };
</script>

<style>
  #map-chart-05 {
    height: 700px;
    margin: 0 auto;
    background-color: #ffffff;
    border: 1px solid #ebedf2;
    border-radius: 10px;
    box-shadow: 3px 3px 3px 3px #ebedf2;
  }
</style>- 编写前端路由api/user/api.js,向后端发送get方式的请求,代码如下:
import request from '../../utils/request'

const baseUrl="/api"

//获取年度告警统计信息
export function getAnnualWarningAreaStatistics(data){
  return request({
    url:baseUrl+"/warnFlightHistory/annualWarningAreaStatistics",
    method:"get",
    data:data
  })
}
//获取指挥航空公司架次与延误率占比
export function getFindCompanyDelay(data){
  return request({
    url:baseUrl+"/company/findCompanyDelay",
    method:"get",
    data:data
  })
}
//获取各扇区航班数
export function getSectionVal(data){
  return request({
    url:baseUrl+"/atc/findSectorSortie",
    method:"get",
    data:data
  })
}
2、后端数据获取,打开后端项目BigData-KongGuan
- 编写关于告警信息的数据操作和存储的实体类com.qrsoft.entity.WarnFlightHistory,内容如下:
package com.qrsoft.entity;

import com.baomidou.mybatisplus.annotation.IdType;
import com.baomidou.mybatisplus.annotation.TableField;
import com.baomidou.mybatisplus.annotation.TableId;
import com.baomidou.mybatisplus.annotation.TableName;
import lombok.AllArgsConstructor;
import lombok.Data;
import lombok.NoArgsConstructor;

import java.io.Serializable;

@Data
@AllArgsConstructor
@NoArgsConstructor
@TableName("warnflighthistory_number")
public class WarnFlightHistory implements Serializable {

	@TableId(value = "id",type = IdType.AUTO)
	private Integer id;

	@TableField(value = "gj_type")
	private String gjType;

	@TableField(value = "gj_id")
	private String gjId;

	@TableField(value = "gj_msg_type")
	private String gjMsgType;

	@TableField(value = "gj_track_num1")
	private String gjTrackNum1;

	@TableField(value = "gj_track_num2")
	private String gjTrackNum2;

	@TableField(value = "gj_distinct")
	private String gjDistinct;

	@TableField(value = "gj_radian")
	private String gjRadian;

	@TableField(value = "gj_name")
	private String gjName;

	@TableField(value = "gj_distinct_bz")
	private String gjDistinctBz;

	@TableField(value = "gj_city")
	private String gjCity;

	@TableField(value = "gj_date")
	private String gjDate;

	@TableField(value = "count")
	private Integer count;

	@TableField(value = "gj_sector")
	private String gjSector;

	@TableField(exist = false)
	private String gjCount;

	//告警的两个航班号
	@TableField(exist = false)
	private  String gjACIds;
}- 编写BigData-KongGuan/src/main/java/com/qrsoft/mapper/WarnFlightHistoryMapper.java数据访问类:
package com.qrsoft.mapper;

import com.baomidou.mybatisplus.core.mapper.BaseMapper;
import com.qrsoft.entity.WarnFlightHistory;
import org.apache.ibatis.annotations.Mapper;
import org.apache.ibatis.annotations.Param;
import org.apache.ibatis.annotations.Select;

import java.util.HashMap;
import java.util.List;

@Mapper
public interface WarnFlightHistoryMapper extends BaseMapper<WarnFlightHistory> {
	@Select("SELECT gj_sector,COUNT(*) as gjCount FROM warnflighthistory_number GROUP BY gj_sector ORDER BY sum(count) desc LIMIT 11;")
	List<WarnFlightHistory> annualWarningAreaStatistics();

	@Select("select gj_name,count(*) as gjCount from warnflighthistory_number group by gj_name;")
	List<WarnFlightHistory> annualWarningStatisticsByCategory();

	@Select("select gj_type,gj_id,gj_msg_type,gj_track_num1,gj_track_num2,gj_distinct,gj_radian,gj_name,gj_distinct_bz,gj_city,gj_date,gj_acids,gj_num1_long,gj_num1_lat,gj_num2_long,gj_num2_lat from warntp_number;")
	List<HashMap<String,Object>> findWarnTp();

	@Select("select count(*) from multiradar_number where `ACID` IN (#{acid},#{bcid});")
	Integer getWarn(@Param("acid") String acid, @Param("bcid") String bcid);
}- 编写BigData-KongGuan/src/main/java/com/qrsoft/service/WarnFlightHistoryService.java服务接口类:
package com.qrsoft.service;

import com.baomidou.mybatisplus.extension.service.impl.ServiceImpl;
import com.qrsoft.common.Result;
import com.qrsoft.common.ResultConstants;
import com.qrsoft.entity.WarnFlightHistory;
import com.qrsoft.mapper.WarnFlightHistoryMapper;
import org.springframework.stereotype.Service;

import java.util.*;

@Service
public class WarnFlightHistoryService extends ServiceImpl<WarnFlightHistoryMapper, WarnFlightHistory> {

	/**
	 * 年度警告区域统计
	 */
	public Result annualWarningAreaStatistics(){

		List<WarnFlightHistory> warnFlightHistories = baseMapper.annualWarningAreaStatistics();
		return new Result(ResultConstants.SUCCESS, ResultConstants.C_SUCCESS,warnFlightHistories);
	}

	/**
	 * 年度警告分类统计
	 */
	public Result annualWarningStatisticsByCategory(){
		List<WarnFlightHistory> warnFlightHistories = baseMapper.annualWarningStatisticsByCategory();
		return new Result(ResultConstants.SUCCESS, ResultConstants.C_SUCCESS,warnFlightHistories);
	}


	/**
	 * 管制指令纠错
	 */
	public Result findWarnTp(){
		List<HashMap<String, Object>> result = new ArrayList<>();
		List<HashMap<String, Object>> warnTp = baseMapper.findWarnTp();
		for (HashMap<String,Object> hm :warnTp){
			String gj_acids = (String)hm.get("gj_acids");
			String[] split = gj_acids.split("-");
			System.out.println(split.length);
			if(split.length>=2) {
				Integer warn = baseMapper.getWarn(split[0], split[1]);
				if(warn >=2){
					result.add(hm);
				}
			}
		}
		return new Result(ResultConstants.SUCCESS, ResultConstants.C_SUCCESS,result);
	}
}- 编写BigData-KongGuan/src/main/java/com/qrsoft/controller/WarnFlightHistoryController.Java控制器类:
package com.qrsoft.controller;

import com.qrsoft.common.Result;
import com.qrsoft.service.WarnFlightHistoryService;
import io.swagger.annotations.Api;
import io.swagger.annotations.ApiOperation;
import org.springframework.beans.factory.annotation.Autowired;
import org.springframework.web.bind.annotation.GetMapping;
import org.springframework.web.bind.annotation.RequestMapping;
import org.springframework.web.bind.annotation.RestController;

@Api(tags = "年度统计")
@RestController
@RequestMapping("/api/warnFlightHistory")
public class WarnFlightHistoryController {

	@Autowired
	private WarnFlightHistoryService service;

	/**
	 * 年度警告分类统计
	 */
	@ApiOperation(value = "年度警告分类统计")
	@GetMapping("/annualWarningStatisticsByCategory")
	public Result annualWarningStatisticsByCategory(){
		return service.annualWarningStatisticsByCategory();
	}
	/**
	 * 年度警告区域统计
	 */
	@ApiOperation(value = "年度警告区域统计")
	@GetMapping("/annualWarningAreaStatistics")
	public Result annualWarningAreaStatistics(){
		return service.annualWarningAreaStatistics();
	}

	/**
	 * 管制指令纠错
	 */
	@ApiOperation(value = "管制指令纠错")
	@GetMapping("/findWarnTp")
	public Result findWarnTp(){
		return service.findWarnTp();
	}
}
3、完成前端Index.vue页面,展示“年度告警区域统计”
- 在src/views/Home/Index.vue页面引入WarnStatistice.vue组件
import WarnStatistice from "../../components/WarnStatistice";- 声明组件,代码如下:
components: {AirLine, Section, WarnStatistice, Delay},- 展示,代码如下:
<el-row :gutter="30" v-show="isShow('/section/warning')">
      <el-col :span="12" align="center">
        <air-port-count-chart/>
      </el-col>
      <el-col :span="12" align="center">
        <WarnStatistice/>
      </el-col>
</el-row>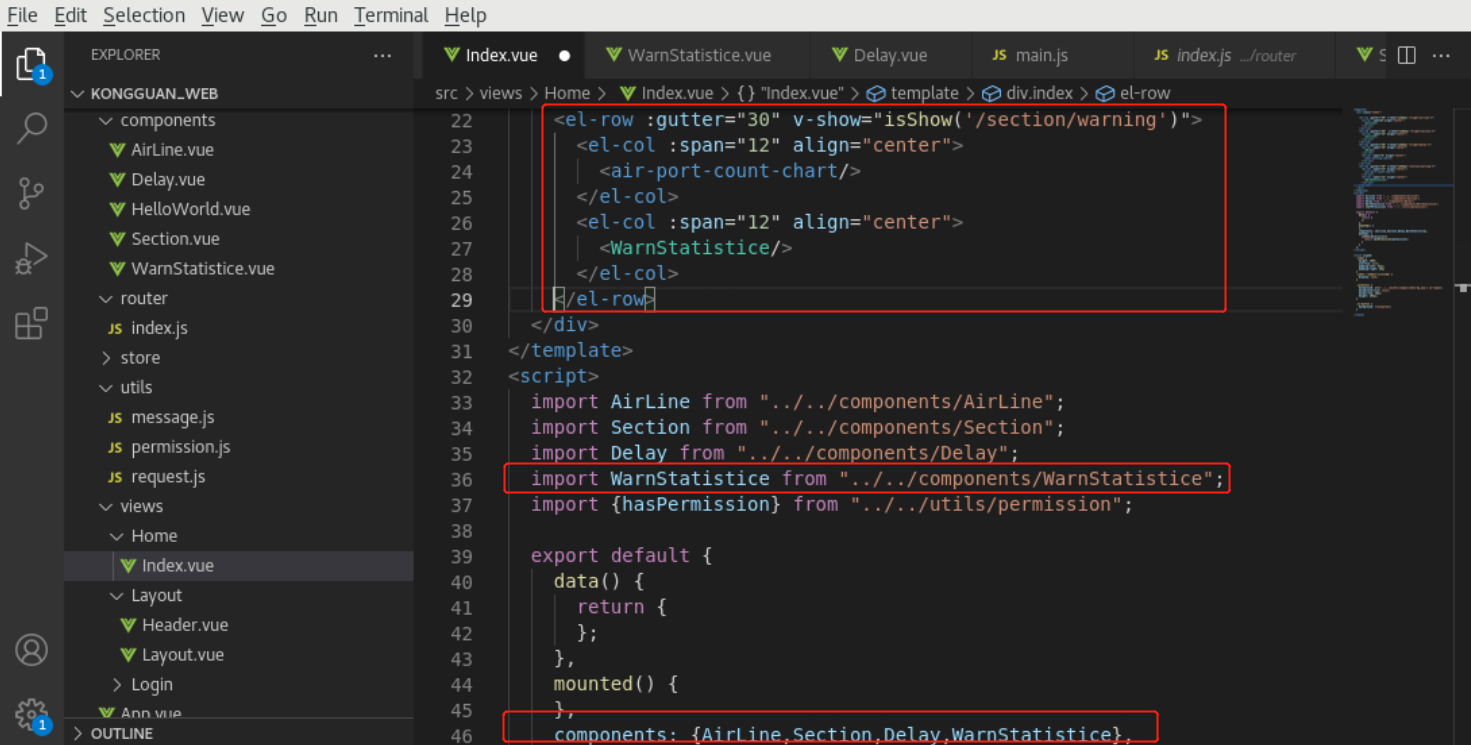
注意:在上面代码中【 v-show="isShow('/section/warning')" 】属性的作用是判断当前登录的用户是否有权限显示当前内容,如果当前登录的用户没有权限,则不会显示当前内容,新用户的权限需要到MySQL数据库中进行设置。
这里有两种方式,可以显示当前内容:
1)去掉【 v-show="isShow('/section/warning')" 】属性,即不判断是否有权限显示。
2)需要使用有权限的用户登录才能显示,或到数据库中分配权限。
参照任务“动态航线图”进行设置。
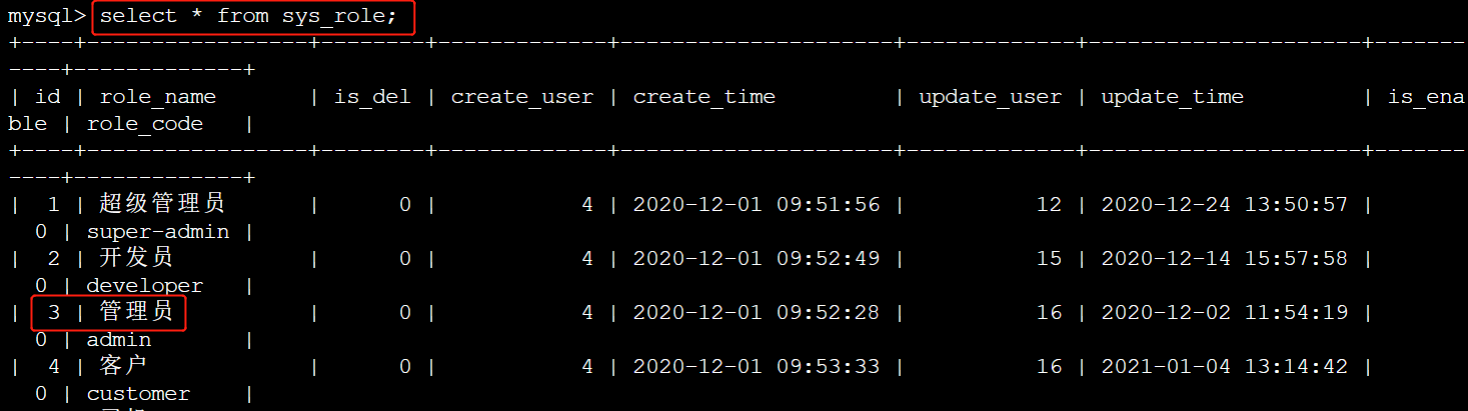
例如我们前面使用的用户admin,该用户没有权限显示,所以使用admin用户登录系统时是不会显示当前内容的,如果要进行权限设置,可以进入MySQL安装节点(node3节点),然后进入数据库,为admin用户授权。
[root@node3 ~]# mysql -uroot -p123456mysql> use kongguan;先查看角色表中,“管理员”的ID:
修改sys_auth表,添加一个【/section/warning】权限:
mysql> insert into sys_auth(auth_name,auth_code,menu_url) values('show warning','/section/warning','/section/warning');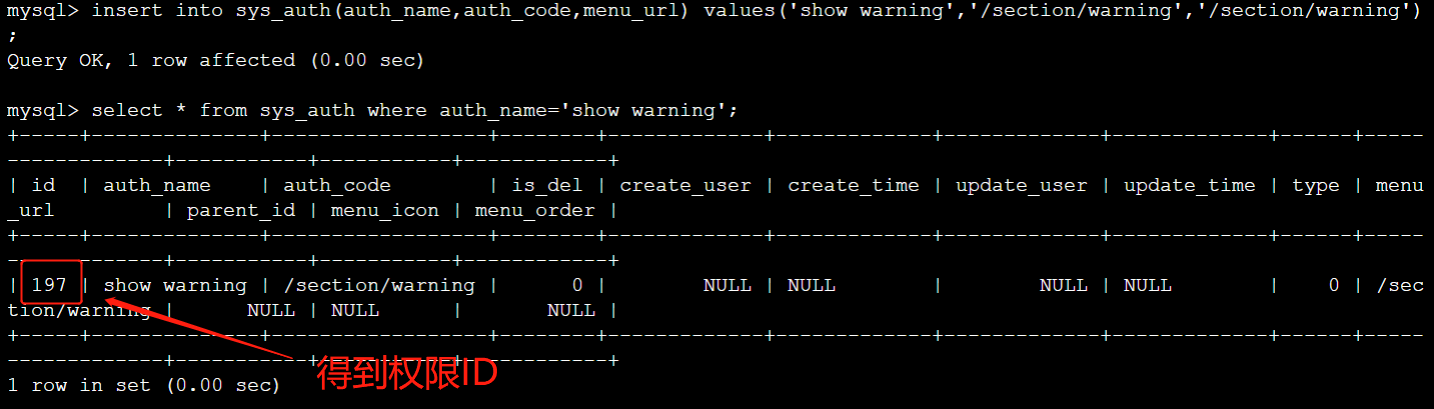
修改role_auth表,将权限授权给“管理员”角色:
mysql>insert into role_auth(role_id,auth_id) values(3,197);
- Index.vue页面的完整代码如下:
<template>
  <div class="index">
    <el-row :gutter="30"  v-show="isShow('/flight/section')">
      <el-col :span="24" align="center">
        <Section/>
      </el-col>
    </el-row>
    <el-row :gutter="30" v-show="isShow('/flight/airline')">
      <el-col :span=24 align="center">
        <AirLine/>
      </el-col>
    </el-row>
    <el-row :gutter="30" v-show="isShow('/section/warning')">
      <el-col :span="12" align="center">
        <air-port-count-chart/>
      </el-col>
      <el-col :span="12" align="center">
        <WarnStatistice/>
      </el-col>
    </el-row>

    <el-row :gutter="30" v-show="isShow('/flight/delay')">
      <el-col :span="16" align="center">
        <Delay/>
      </el-col>
      <el-col :span="8" align="center">
        <year-warning-chart/>
      </el-col>
    </el-row>
  </div>
</template>

<script>
  import AirLine from "../../components/AirLine";
  import Section from "../../components/Section";
  import WarnStatistice from "../../components/WarnStatistice";
  import Delay from "../../components/Delay";

  import {hasPermission} from "../../utils/permission";

  export default {
    data() {
      return {
      };
    },

    mounted() {
    },
    components: {AirLine, Section, WarnStatistice, Delay},
    methods: {
      isShow(permission){
        return hasPermission(permission);
      }
    }
  };
</script>

<style scoped>
  .index {
    height: 100%;
    overflow: auto;
    padding-left: 44px;
    padding-right: 44px
  }
  .index::-webkit-scrollbar {
    display: none;
  }

  .caseClass {
    background: url('../../assets/images/index-bg.png') no-repeat;
    background-size: cover;
    margin-top: 20px;
    height: 284px;
  }

  .el-button {
    background: transparent;
  }
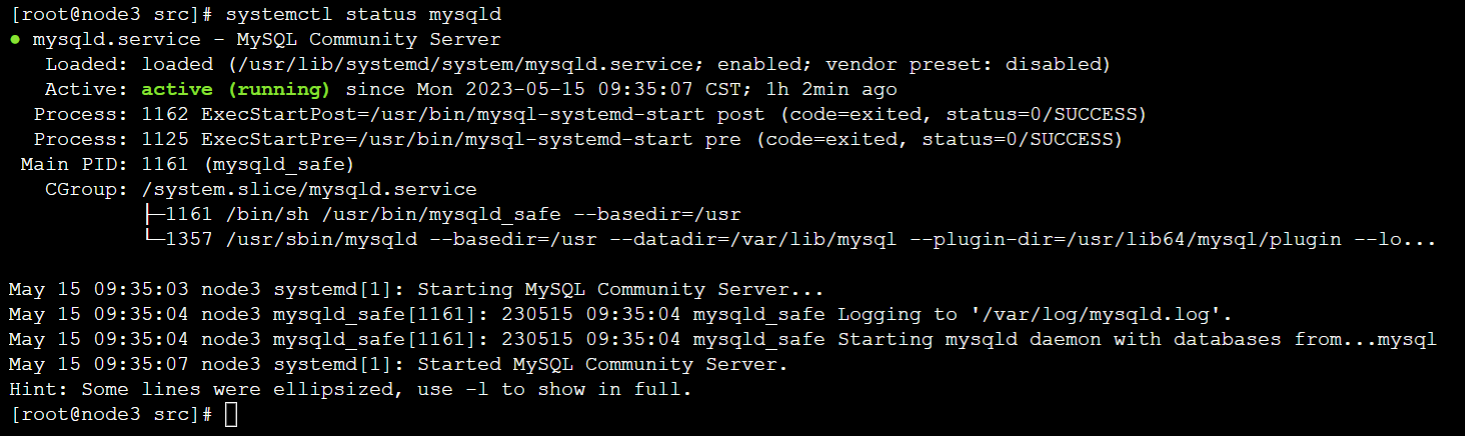
</style>- 确保Hadoop、Spark、Kafka、Redis、MySQL等服务均已经正常启动,如果没有正常启动,请参照前面的安装部署任务,完成这些服务的启动。
例如:查看MySQL是否正常启动。
- 启动后端项目 BigData-KongGuan
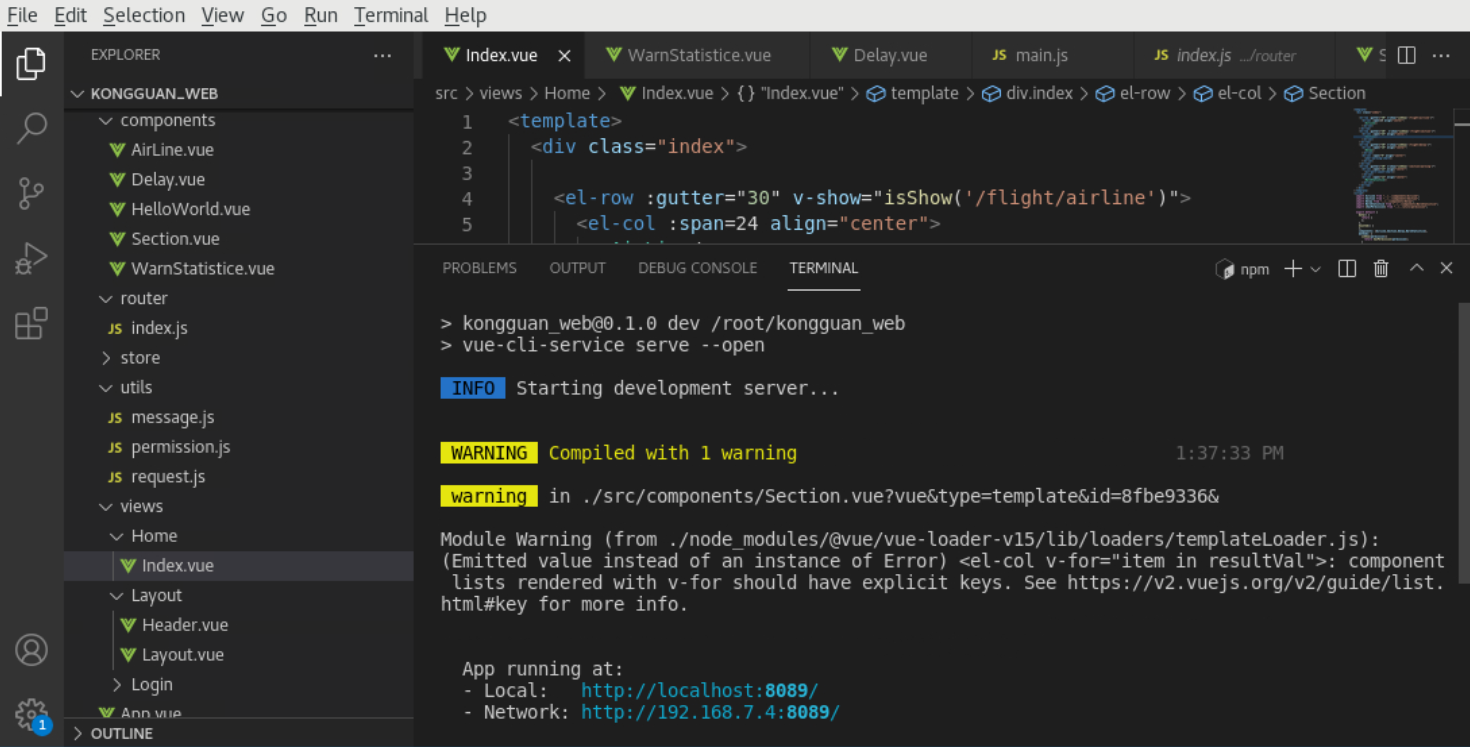
- 启动前端项目 kongguan_web
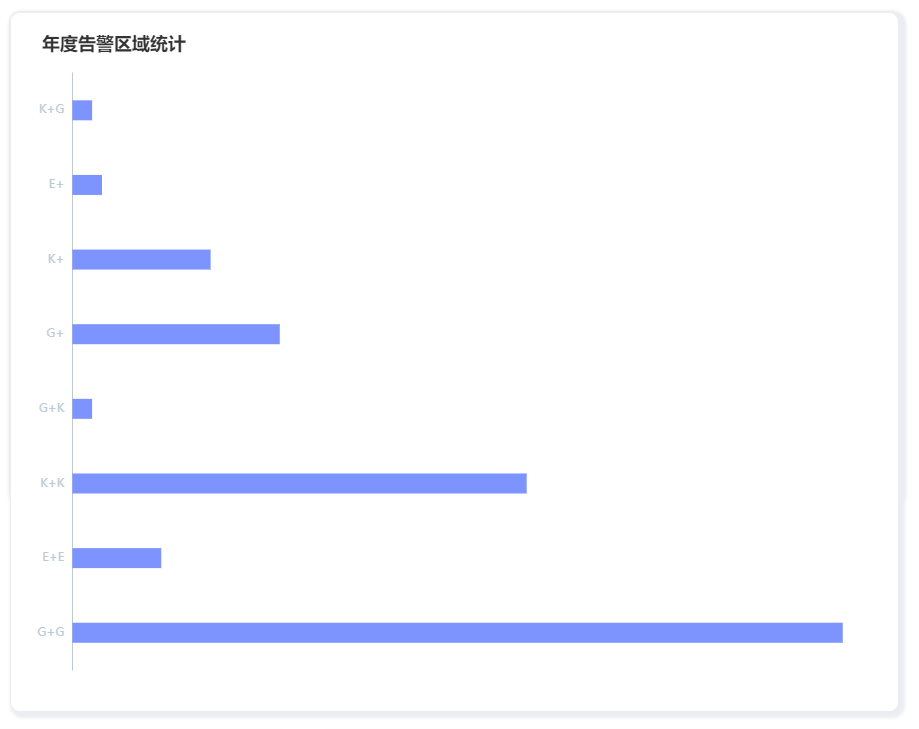
- 页面展示效果如下:


 319
319


 被折叠的 条评论
为什么被折叠?
被折叠的 条评论
为什么被折叠?
 到【灌水乐园】发言


