


 文章介绍了如何在Python中使用`NumberPlane`、`Axes`和`NumberLine`创建坐标轴,包括实线、虚线和非线性变换的应用。通过`create`和`animate`方法展示了线性映射和非线性变换在图形构造中的应用。
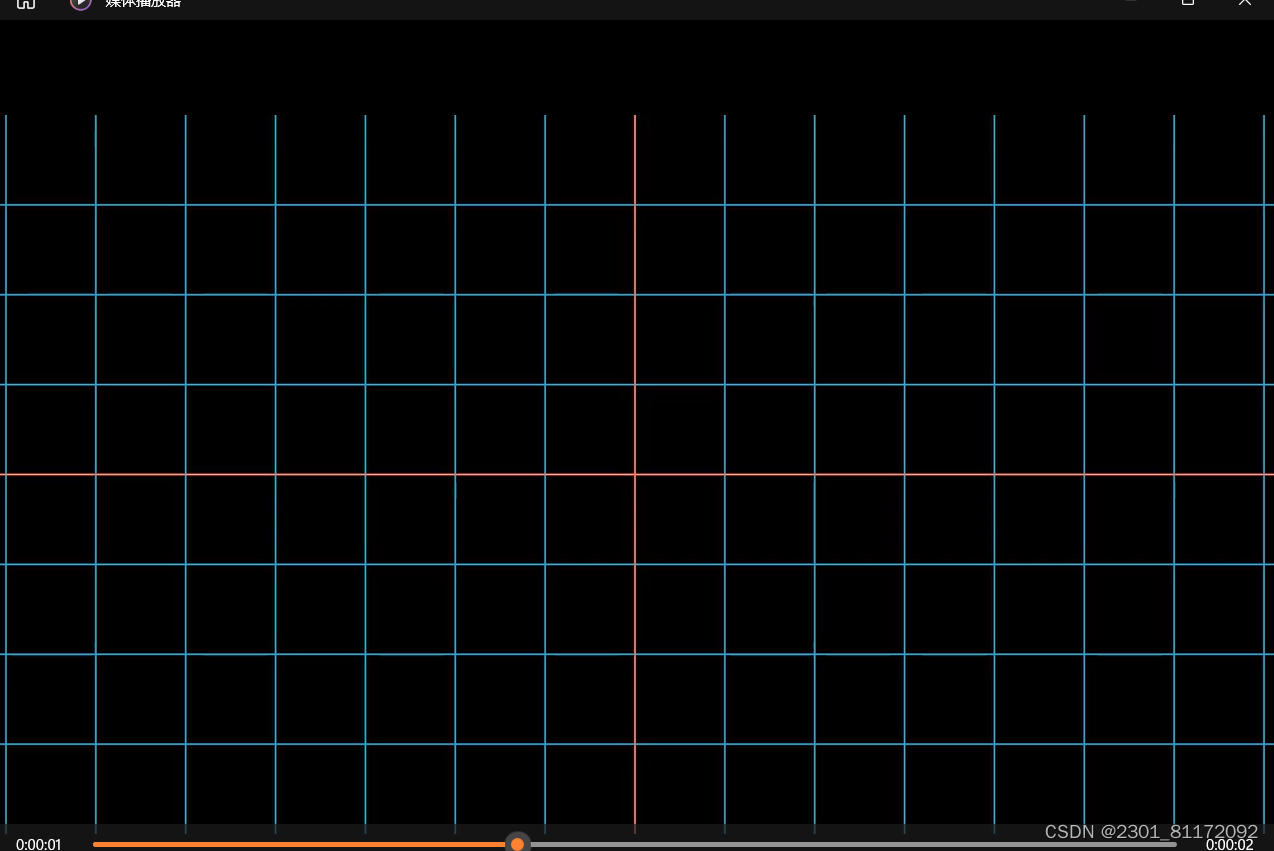
1.坐标轴展示
  (1)
def construct(self):
    grid=NumberPlane(
         axis_config={"stroke_color":RED}#这个是设置xy轴颜色用的
    )
    self.play(Create(grid))
    self.wait(2)
这个是我最喜欢的坐标轴
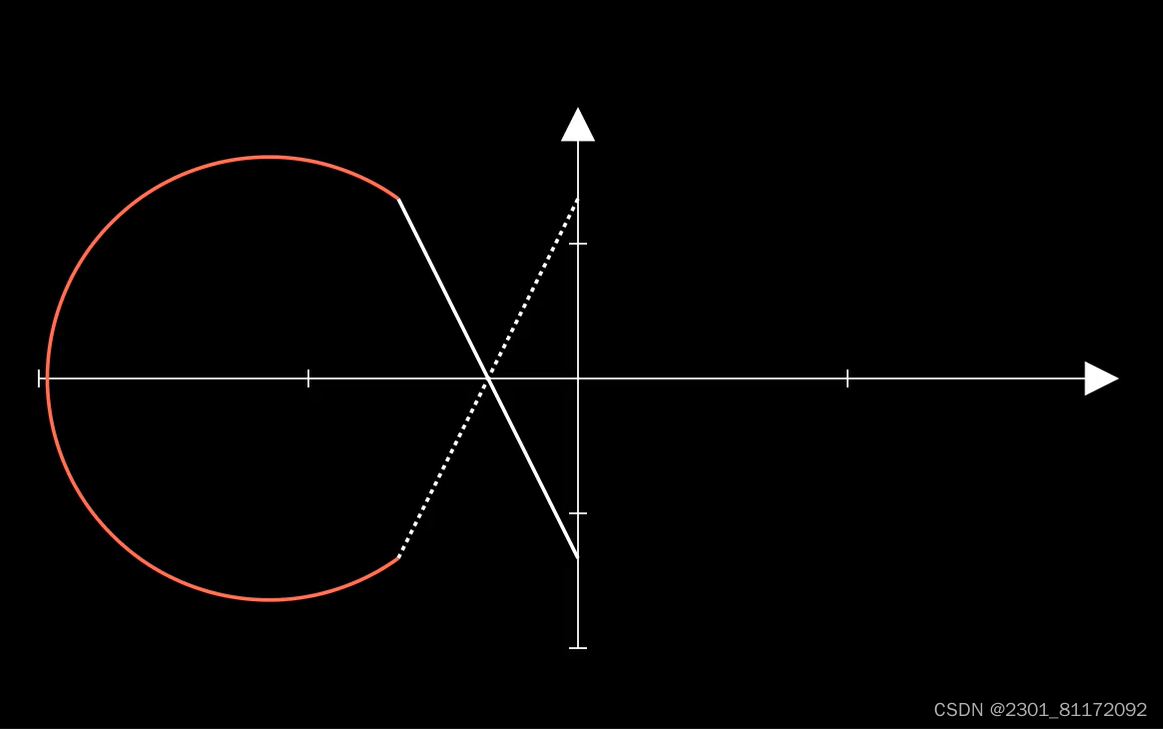
(2)
def construct(self):
    axes=Axes(x_range=[-2,2],y_range=[-2,2])
    line1=Line()
    line2=DashedLine(np.array([-2,-2,0]),np.array([0,2,0])
        )#虚线
    line1.put_start_and_end_on(
        np.array([-2, 2, 0]), np.array([0, -2, 0])
    )#实线
    line3=Line(
        np.array([-2,-2,0]),
        np.array([-2,2,0]),
        color=RED,
        path_arc=-4.39#拉直线为弧线
    )
    self.play(Create(axes))
    self.play(Create(line1))
    self.play(Create(line2))
    self.play(Create(line3))
    self.wait(2)
# self.add(axes.get_axis_labels())#获取x,y
# axes.add_coordinates()#可以显示全部的数轴值
# axes.add_coordinates(
#     [-1,2],[-2,1]
# )#还是都是点
上述为补充的几种应用
(第二种轴及加上直线的运用)
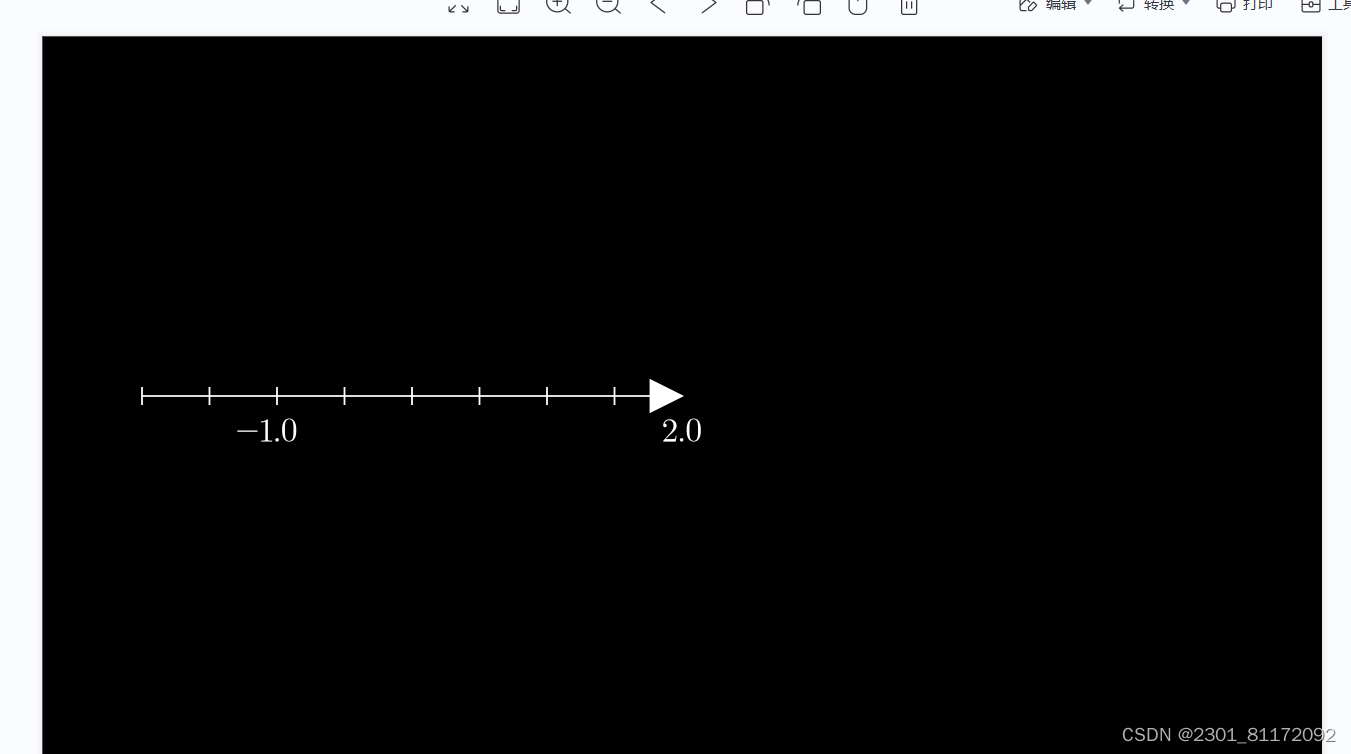
(3)
def construct(self):
axis=NumberLine(
    x_range=[-2,2,0.5],#第三个为间隔
    include_ticks=True,#包含刻度线
    include_tip=True,#在末端添加箭头
    include_numbers=False,#标上值
    unit_size=1.5,#视频上的效果:单位长度为1.5
    #label_direction=UP可以设置数标在上面


).shift(LEFT*3)
axis.add_numbers([-1,2])#这个不是一个区间,是两个点,表示展示两个点的刻度值
self.add(axis)
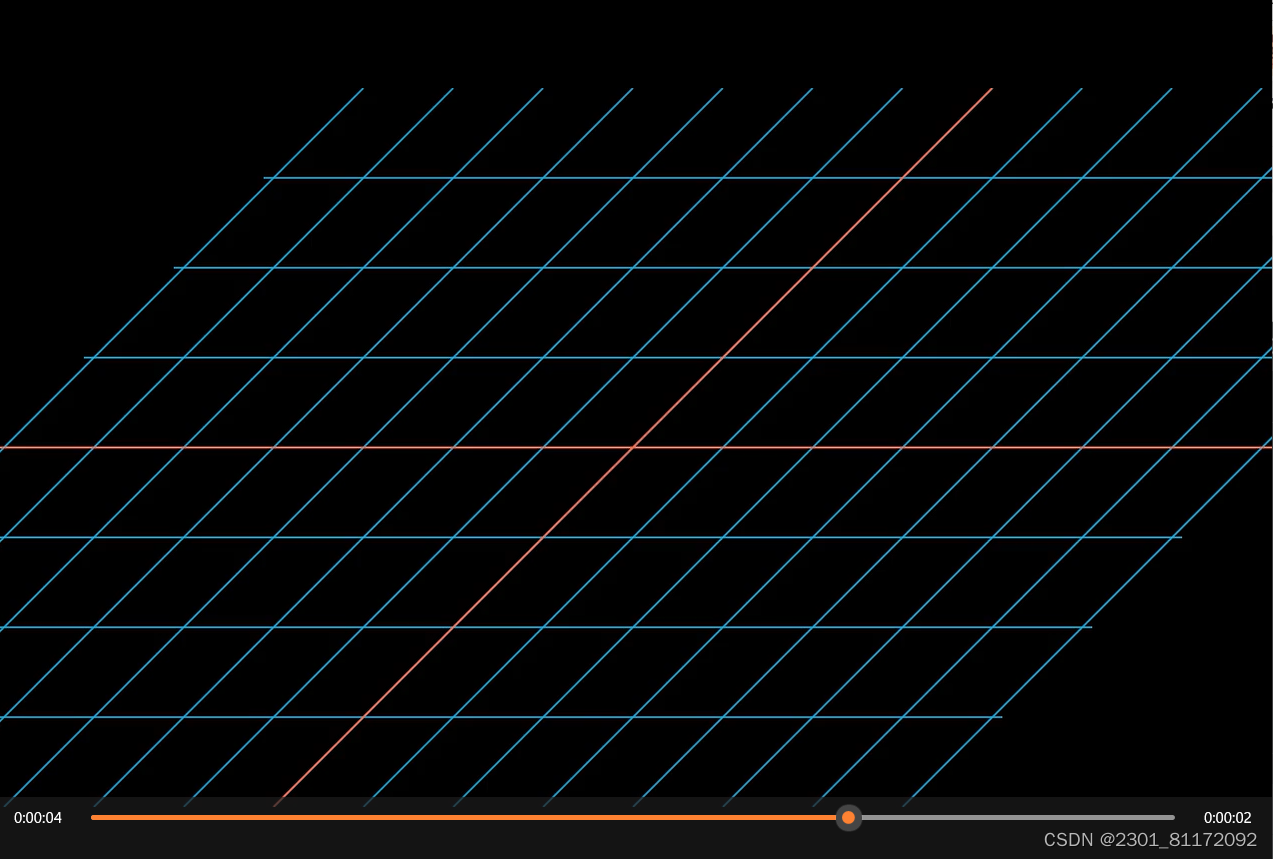
(4)进行线性变换
def construct(self):
    grid=NumberPlane(
         axis_config={"stroke_color":RED}#这个是设置xy轴颜色用的
    )
    self.play(Create(grid))
    self.wait(2)

    self.play(grid.animate.apply_function(lambda p:p+RIGHT*p[1]))
    self.wait(2)#这是基于线性映射,不线性的映射在下面
(5)
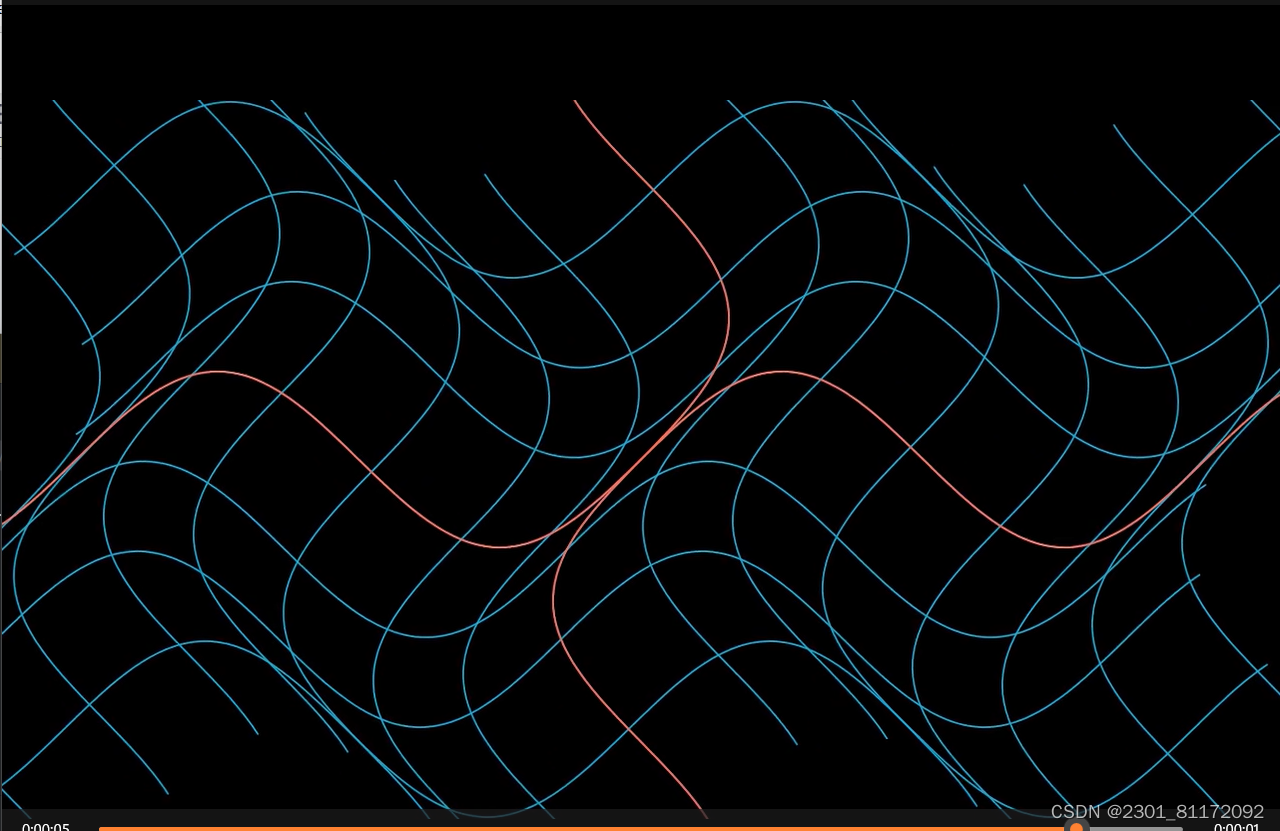
非线性变换
def construct(self):
    grid=NumberPlane(
         axis_config={"stroke_color":RED}#这个是设置xy轴颜色用的
    )
    self.play(Create(grid))
    self.wait(2)

    # self.play(grid.animate.apply_function(lambda p:p+RIGHT*p[1]))
    # self.wait(2)#这是基于线性映射,不线性的映射在下面
    grid.prepare_for_nonlinear_transform()
    self.play(
        grid.animate.apply_function(
            lambda p: p
                      + np.array(
                [
                    np.sin(p[1]),
                    np.sin(p[0]),
                    0,
                ],
            ),
        ),
        run_time=3,
    )


 被折叠的 条评论
为什么被折叠?
被折叠的 条评论
为什么被折叠?
 到【灌水乐园】发言


