jave
用eclipse软件
代码:
<!DOCTYPE html>
<html>
<head>
<meta charset="UTF-8">
<!-- 引入ECharts脚本 -->
<script src="js/echarts.js"></script>
<title>绘制堆积面积图</title>
</head>
<body>
<div id="main" style="width: 600px; height: 400px"></div>
<script type="text/javascript">
var myChart = echarts. init(document. getElementById("main"));
var option= {
title:{
text:"堆积面积图",
textStyle:{
color:'green',
},
left:20,
top:3
},
tooltip:{
trigger:'axis'
},
legend:{
data:['手机','冰箱','空调','电视','其他'],
left:160,
top:3
},
toolbox:{
show:true,
orient:'vertical',
feature:{
mark:{show:true}
dataView:{show:true,resdOnly:false},
magicType:{show:true,type:['line','bar','stack','tiled']},
restore:{show:true},
saveAsImage:{show:true}
},
top:52,
left:550
},
calculable:true,
xAxis:[
{
type:'category',
boundaryGap:false,
data:['周一','周二','周三','周四','周五','周六','周日']
}
],
yAxis:[
{
type:'value'
}
],
series:[
{
name:'手机',
type:'line',
stack:'总量',
color:'rgb(0,0,0)',
itemStyle:{
normal:
{
}
},
data:[434,345,456,222,333,444,432]
},
{
name:'冰箱',
type:'line',
stack:'总量',
color:'blue',
itemStyle:{
normal:{
}
},
data:[420,282,391,344,390,530,410]
},
{
name:'空调',
type:'line',
stack:'总量',
color:'green',
itemStyle:{
normal:{
}
},
data:[350,332,331,334,390,320,340]
},
{
name:'电视',
type:'line',
stack:'总量',
color:'green',
itemStyle:{
normal:{
}
},
data:[420,222,333,442,230,430,430]
},
{
name:'其他',
type:'line',
stack:'总量',
color:'#FA8072';,
itemStyle:{
normal:{
}
},
data:[330,442,432,555,456,666,877]
}
]
};
myChart.setOption(option);
</script>
</body>
</html>

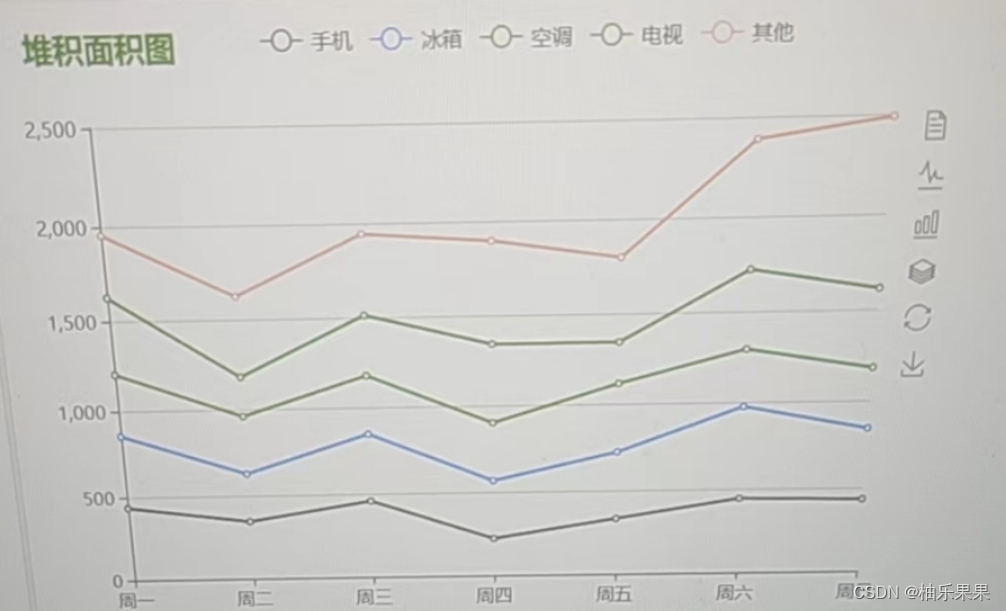
代码结果:


 1万+
1万+

 被折叠的 条评论
为什么被折叠?


