


OpenLayers交互式绘制的实现步骤
导入必要的模块
首先,需要导入OpenLayers的CSS和JavaScript库,以及用于绘制的交互控制模块。
使用link和脚本导入
<link rel="stylesheet" href="../v-7.4.0/theme/ol.css">
<script src="../v-7.4.0/en/latest/ol/dist/ol.js"></script>
使用import导入
import "ol/ol.css";
import { Map, View } from "ol";
import { Tile as TileLayer, Vector as VectorLayer } from "ol/layer";
import { OSM, Vector as VectorSource } from "ol/source";
import { Draw } from "ol/interaction";
import { Circle as CircleStyle, Fill, Stroke, Style } from "ol/style";
初始化地图和图层
创建一个地图实例,并添加底图图层和矢量图层。
const map = new Map({
  target: 'map',
  layers: [
    //底图
    new TileLayer({
      source: new OSM(),
    }),
    //矢量图层
    new VectorLayer({
      source: new VectorSource({ wrapX: false }),
      style: new Style({
         fill: new Fill({     //填充样式
          color: '#ffcc33'
                }),
        image: new CircleStyle({ //点样式
          radius: 5,
          fill: new Fill({
            color: 'rgba(255, 255, 255, 0.2)',
          }),
          stroke: new Stroke({  //线样式
            color: 'rgba(0, 0, 0, 0.5)',
            width: 2,
          }),
        }),
      }),
    }),
    }),
  ],
  view: new View({
    center: fromLonLat([120.15, 30.28]),
    zoom: 15,
  }),
});
配置绘制交互控制
创建一个Draw交互控制实例,并设置其类型(如点、线、面等)和样式。
const draw = new Draw({
  source: vectorSource,
    //还有其他类型LineString,Polygon,Circle
  type: 'Point',
  style: new Style({
    image: new CircleStyle({
      radius: 5,
      fill: new Fill({
        color: 'rgba(255, 255, 255, 0.2)',
      }),
      stroke: new Stroke({
        color: 'rgba(0, 0, 0, 0.5)',
        width: 2,
      }),
    }),
  }),
});
添加交互控制到地图
将绘制交互控制添加到地图实例中,使其成为地图的交互之一。
map.addInteraction(draw);处理绘制结束事件
监听drawend事件,以便在用户完成绘制后执行特定的操作,如保存绘制的图形到服务器或本地存储。
draw.on('drawend', function(event) {
  const feature = event.feature;
  console.log(feature.getGeometry().getCoordinates());
});
最终效果
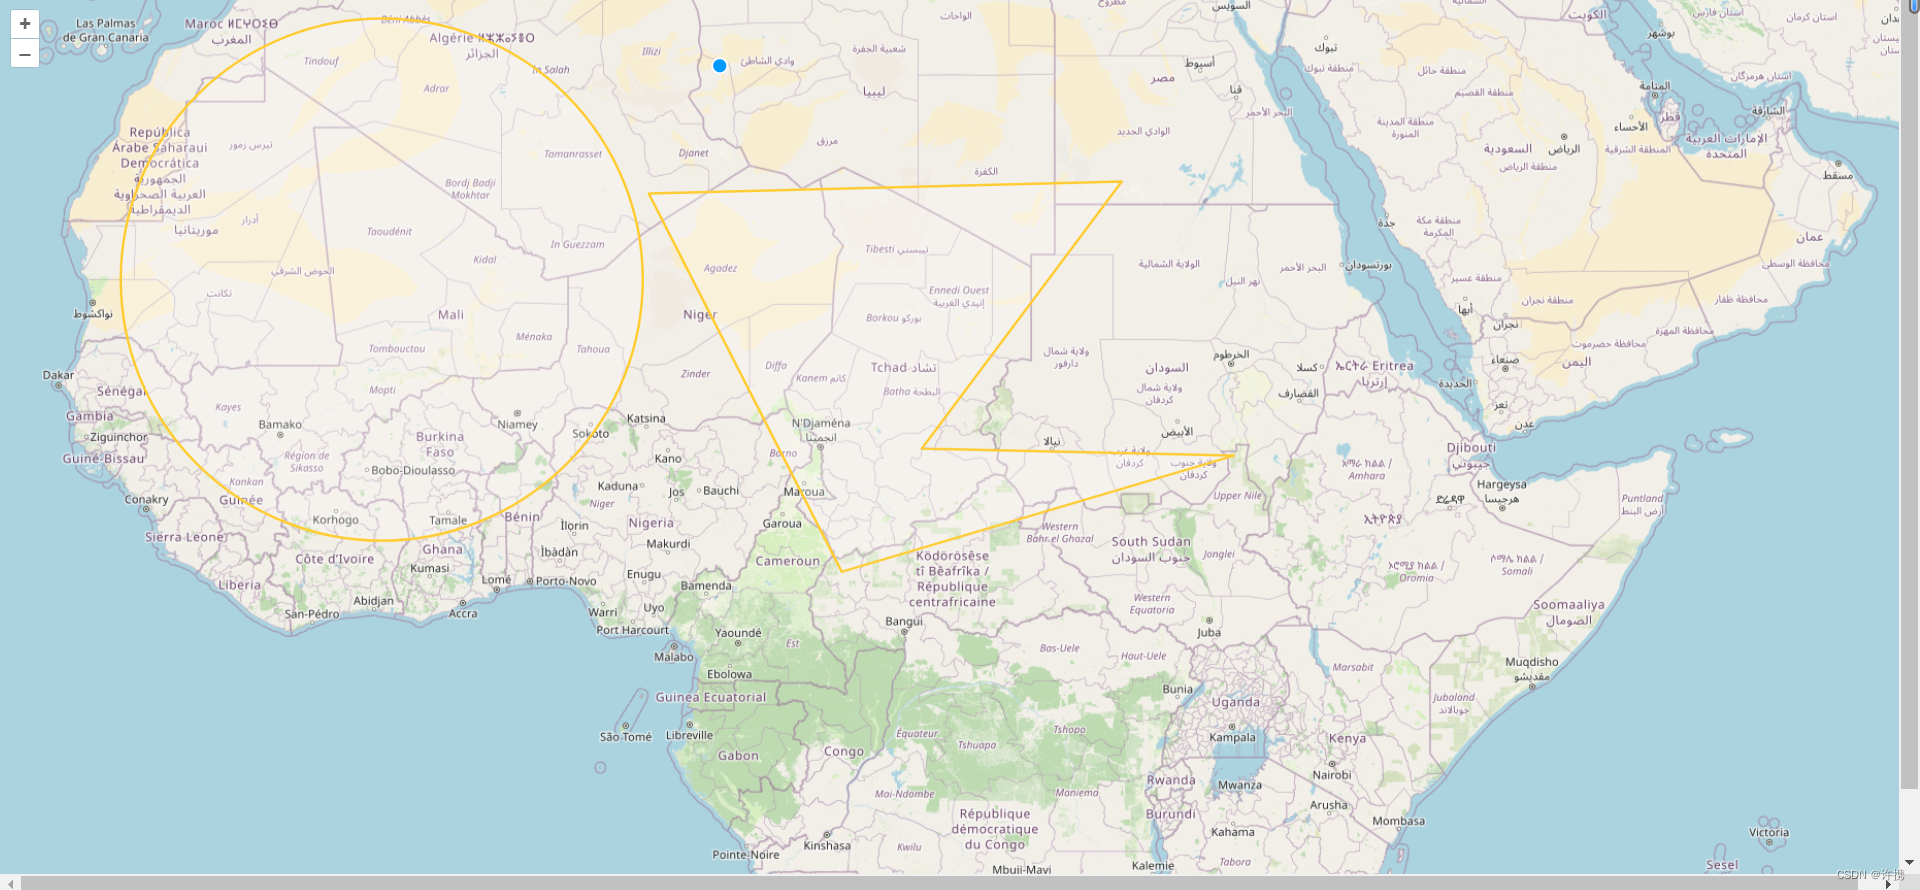
细节补充
OpenLayers的绘制功能既包括组件也包括方法。可以通过代码直接创建几何形状,也可以使用draw类型的交互组件来绘制几何形状。
例如,OpenLayers提供了绘制圆、折线、矩形、星形等方法,同时也支持通过自定义draw组件的geometryFunction来实现更复杂图形的绘制,如椭圆。此外,OpenLayers还提供了一系列的交互功能,包括select、modify、draw等,这些交互功能允许用户与地图上的几何要素进行互动,包括绘制、选择和修改等操作。


 248
248


 被折叠的 条评论
为什么被折叠?
被折叠的 条评论
为什么被折叠?
 到【灌水乐园】发言


