


本文我们使用具体的题目来进行数据的决策分析及可视化,通过构建数学模型、编写Python代码进行计算,并利用数据可视化技术直观展示分析结果,为决策提供科学依据。
一、问题背景与模型构建
以新能源汽车厂商生产线升级方案选择为例,厂商面临三个不同的升级方案,每个方案都有不同的生产线投资成本、单车生产成本、预期年销量和销售单价。目标是通过计算各方案的年利润,选择出利润最高的方案。
为了解决这个问题,我们构建了年利润计算模型:
利润 = (销售单价 - 单车成本) × 年销量 - 生产线投资
这个模型考虑了销售单价、单车成本、年销量和生产线投资四个关键因素,能够全面反映各方案的经济效益。
| 方案 | 生产线投资(万元) | 单车成本(万元) | 年销量(万辆) | 销售单价(万元) |
|---|---|---|---|---|
| 方案A | 8000 | 16.5 | 1.2 | 22 |
| 方案B | 9500 | 15.8 | 1.2 | 22 |
| 方案C | 11000 | 15.0 | 1.2 | 22 |
import matplotlib.pyplot as plt
import numpy as np
# 数据定义
schemes = ['方案A', '方案B', '方案C']
investments = [8000, 9500, 11000] # 单位:万元
costs = [16.5, 15.8, 15.0] # 单位:万元
sales = [1.2, 1.2, 1.2] # 单位:万辆
price = 22 # 单位:万元
# 计算利润(修正单位换算)
profits = []
for i in range(len(schemes)):
# 统一单位换算(万元→元,万辆→辆)
investment = investments[i] * 10000 # 生产线投资转元
cost = costs[i] * 10000 # 单车成本转元
quantity = sales[i] * 10000 # 年销量转辆
# 利润计算公式
profit = (price * 10000 - cost) * quantity - investment
profits.append(profit)
# 寻找最优方案
best_scheme = schemes[np.argmax(profits)]
max_profit = max(profits)
# 可视化配置
plt.figure(figsize=(10, 6))
bars = plt.bar(schemes, profits, color=['#1f77b4', '#2ca02c', '#d62728']) # 定义颜色
plt.title('新能源汽车生产线升级方案利润对比', fontsize=14, pad=20)
plt.xlabel('升级方案', fontsize=12, labelpad=10)
plt.ylabel('年利润(元)', fontsize=12, labelpad=10)
plt.axhline(y=0, color='black', linewidth=0.8, linestyle='--') # 添加虚线基线
# 数据标签配置
for bar in bars:
height = bar.get_height()
plt.text(
bar.get_x() + bar.get_width()/2, # 水平居中
height + 50000000, # 垂直偏移量
f'{height/100000000:.1f}亿', # 数值格式化
ha='center',
va='bottom',
fontsize=9
)
# 高亮最优方案
best_bar = bars[np.argmax(profits)]
best_bar.set_color('gold')
plt.text(
best_bar.get_x() + best_bar.get_width()/2,
max_profit + 150000000,
'最优方案',
ha='center',
color='gold',
fontweight='bold',
fontsize=11,
bbox=dict(facecolor='white', alpha=0.8, edgecolor='gold', boxstyle='round,pad=0.4') # 添加文字背景框
)
# 图表优化
plt.ylim(-200000000, 600000000) # 固定Y轴范围
plt.grid(axis='y', linestyle='--', alpha=0.7) # 添加横向网格线
plt.tight_layout()
# 输出结果
print(f"计算结果:\n{best_scheme} 年利润最高,为 {max_profit/100000000:.1f} 亿元")
# 保存图表
plt.savefig('./profit_comparison_final.png', dpi=300, bbox_inches='tight')
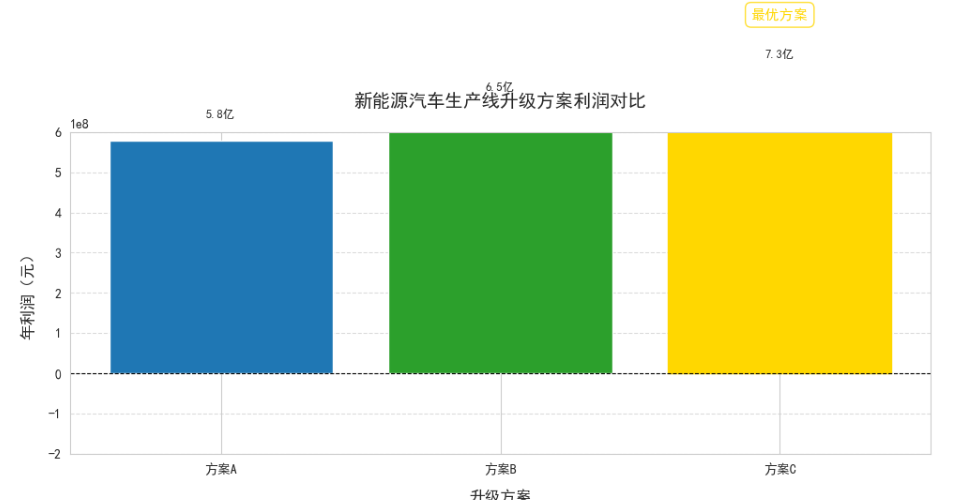 计算结果:
计算结果:
方案C 年利润最高,为 7.3 亿元


 被折叠的 条评论
为什么被折叠?
被折叠的 条评论
为什么被折叠?
 到【灌水乐园】发言


