


① 自定义主题
② 设置启动Activity主题
③ 在代码中将主题设置回来
protected void onCreate(Bundle savedInstanceState) {
setTheme(R.style.AppTheme)
super.onCreate(savedInstanceState);
}
1.3 测量启动时间
1.3.1 测量方式
- 系统日志输出:在
Android4.4及更高的版本中,logcat包括一个输出行,其中包含命令为Displayed的值,此值代表从启动进程到在屏幕上完成对应用Activity绘制所经过的时间(MI6测试,并没有);
- 启动进程;
- 初始化对象;
- 创建并初始化
Activity:ActivityManager:displayed com.sty.ne.appperformance/.MainActivity: +550ms;- 扩充布局;
- 首次绘制应用。
adb命令:adb shell Activity Manager:
adb [ -d | -e | -s ] shell am start -S -W
com.sty.ne.appperformance/.MainActivity
-c android.intent.category.LAUNCHER
-a android.intent.action.MAIN
adb shell am start -W com.sty.ne.appperformance/.MainActivity
显示结果如下:
GGGdeMac-mini:NeAppPerformance tian$ adb shell am start -W com.sty.ne.appperformance/.activity.SplashActivity
Starting: Intent { act=android.intent.action.MAIN cat=[android.intent.category.LAUNCHER] cmp=com.sty.ne.appperformance/.activity.SplashActivity }
Status: ok
Activity: com.sty.ne.appperformance/.MainActivity
ThisTime: 186 (最后一个Activity启动耗时)
TotalTime: 395 (所有Activity启动耗时)
WaitTime: 417 (AMS启动Activity的总耗时)
Complete
- 手动获取:手动打印日志计算启动时间,只能记录应用内耗时。
private void findViews() {
final View viewRoot = findViewById(R.id.root);
viewRoot.getViewTreeObserver().addOnPreDrawListener(new ViewTreeObserver.OnPreDrawListener() {
@Override
public boolean onPreDraw() {
viewRoot.getViewTreeObserver().removeOnPreDrawListener(this);
LauncherTimer.logEnd(“tag3”);
return false;
}
});
}
@Override
protected void onResume() {
super.onResume();
LauncherTimer.logEnd(“tag1”);
}
@Override
public void onWindowFocusChanged(boolean hasFocus) {
super.onWindowFocusChanged(hasFocus);
LauncherTimer.logEnd(“tag2”);
}
// D/Time: 2/tag1 launcher time=101
// D/Time: 2/tag3 launcher time=139
// D/Time: 2/tag2 launcher time=146
1.3.2 方法耗时统计
traceview统计:可以用代码统计,也可以用Android Studio自带的cup profiler来统计;缺点是代码侵入性强,会拖慢程序运行。
①Debug Trace:
@Override
public void onCreate() {
super.onCreate();
Debug.startMethodTracing(“Launcher”);
coreSize = Runtime.getRuntime().availableProcessors();
executorService = Executors.newFixedThreadPool(Math.max(2, Math.min(coreSize - 1, 4)));
application = this;
context = this.getApplicationContext();
AppProfile.context = context;
ScreenUtil.init(context);
initLog();
AppForegroundWatcher.init(context);
CrashReport.initCrashReport(getApplicationContext(), “e9bf59bd43”, false);
Debug.stopMethodTracing();
//sdcard/Android/data/com.sty.ne.appperformance/files/Launcher.trace --> save as 导出来,用Profiler打开
}
sdcard/Android/data/com.sty.ne.appperformance/files/Launcher.trace --> save as 导出来,用Profiler打开,如下图所示:
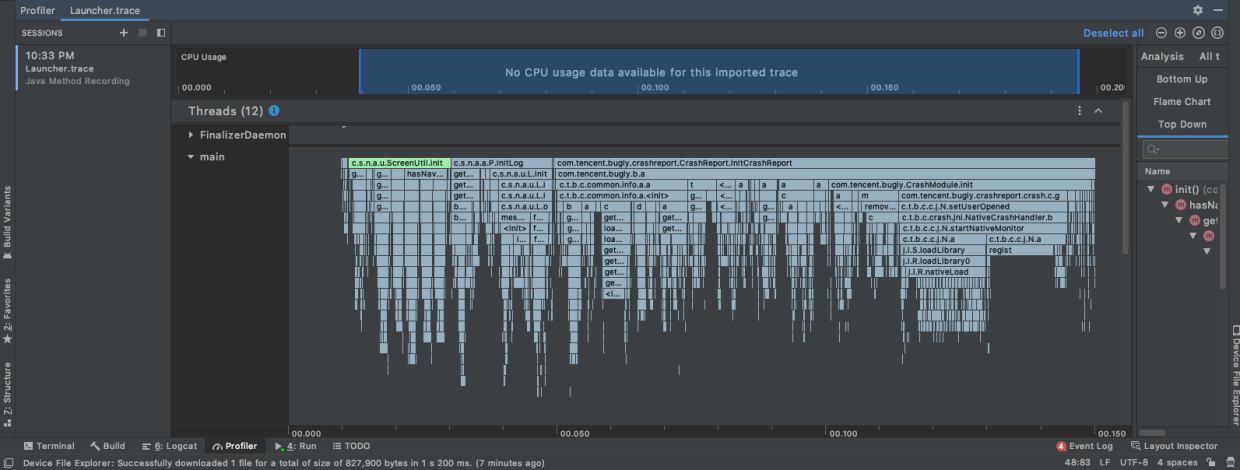
缺点:只能记录应用内程序执行时间。
②CPU Profiler:
不需要侵入代码(无需写Debug.startMethodTracing("Launcher"),但是需要做如下配置:
run->edit configurations;- 勾选
start recording a method trace on startup;- 从菜单中选择
cpu记录配置(profiling菜单下勾选两个复选框);apply-->profile模式部署。
systrace统计
在代码中添加命令:
@Override
public void onCreate() {
super.onCreate();
//systemtrace方式
Trace.beginSection(“Launcher”);
coreSize = Runtime.getRuntime().availableProcessors();
executorService = Executors.newFixedThreadPool(Math.max(2, Math.min(coreSize - 1, 4)));
application = this;
context = this.getApplicationContext();
AppProfile.context = context;
ScreenUtil.init(context);
initLog();
AppForegroundWatcher.init(context);
CrashReport.initCrashReport(getApplicationContext(), “e9bf59bd43”, false);
Trace.endSection();
}
命令行终端进入如下目录:/Users/tian/Library/Android/sdk/platform-tools/systrace
输入如下命令进入监听状态:
python systrace.py -o mynewtrace.html sched freq idle am wm gfx view binder_driver hal dalvik camera input res
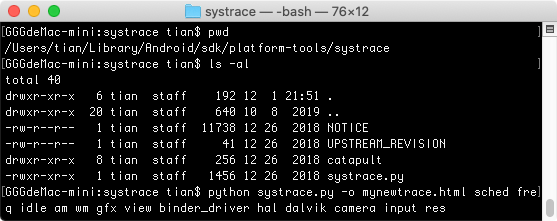
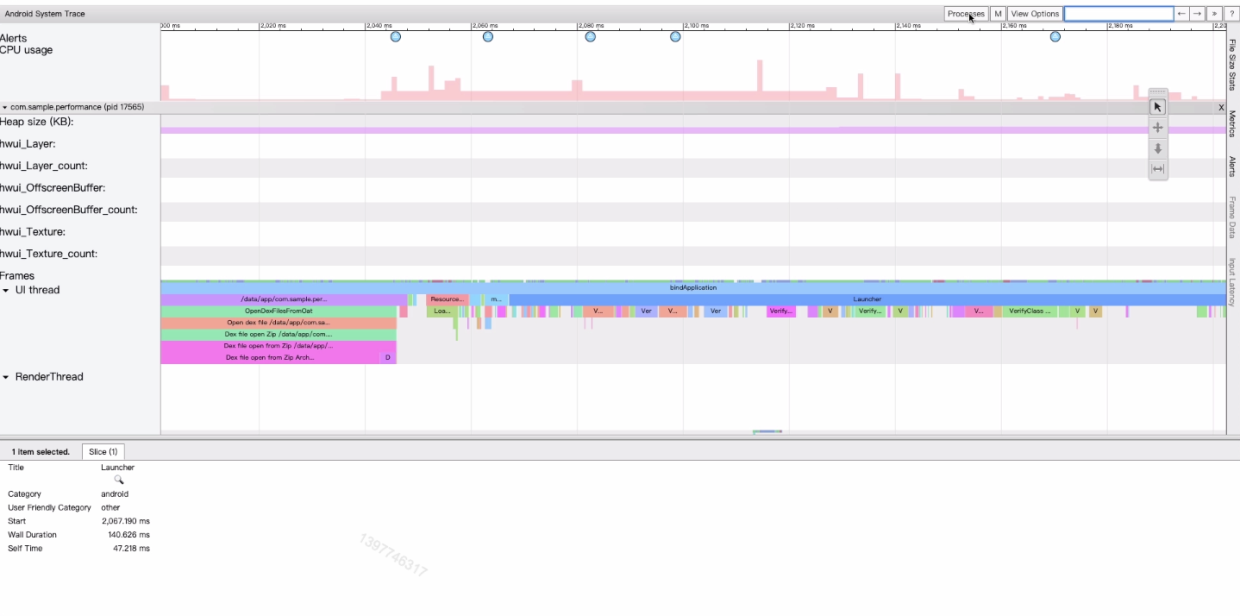
此时运行代码,完成之后在命令行窗口按Enter键结束监听,然后会生成目标文件mynewtrace.html:

分析目标文件:
自我介绍一下,小编13年上海交大毕业,曾经在小公司待过,也去过华为、OPPO等大厂,18年进入阿里一直到现在。
深知大多数HarmonyOS鸿蒙开发工程师,想要提升技能,往往是自己摸索成长或者是报班学习,但对于培训机构动则几千的学费,着实压力不小。自己不成体系的自学效果低效又漫长,而且极易碰到天花板技术停滞不前!
因此收集整理了一份《2024年HarmonyOS鸿蒙开发全套学习资料》,初衷也很简单,就是希望能够帮助到想自学提升又不知道该从何学起的朋友,同时减轻大家的负担。

既有适合小白学习的零基础资料,也有适合3年以上经验的小伙伴深入学习提升的进阶课程,基本涵盖了95%以上HarmonyOS鸿蒙开发知识点,真正体系化!
由于文件比较大,这里只是将部分目录大纲截图出来,每个节点里面都包含大厂面经、学习笔记、源码讲义、实战项目、讲解视频,并且会持续更新
如果你觉得这些内容对你有帮助,可以添加VX:vip204888 (备注鸿蒙获取)

一个人可以走的很快,但一群人才能走的更远。不论你是正从事IT行业的老鸟或是对IT行业感兴趣的新人,都欢迎扫码加入我们的的圈子(技术交流、学习资源、职场吐槽、大厂内推、面试辅导),让我们一起学习成长!
里只是将部分目录大纲截图出来,每个节点里面都包含大厂面经、学习笔记、源码讲义、实战项目、讲解视频,并且会持续更新**
如果你觉得这些内容对你有帮助,可以添加VX:vip204888 (备注鸿蒙获取)
[外链图片转存中…(img-TwZfGPKJ-1712645411822)]
一个人可以走的很快,但一群人才能走的更远。不论你是正从事IT行业的老鸟或是对IT行业感兴趣的新人,都欢迎扫码加入我们的的圈子(技术交流、学习资源、职场吐槽、大厂内推、面试辅导),让我们一起学习成长!


 1322
1322


 被折叠的 条评论
为什么被折叠?
被折叠的 条评论
为什么被折叠?
 到【灌水乐园】发言


