


先自我介绍一下,小编浙江大学毕业,去过华为、字节跳动等大厂,目前阿里P7
深知大多数程序员,想要提升技能,往往是自己摸索成长,但自己不成体系的自学效果低效又漫长,而且极易碰到天花板技术停滞不前!
因此收集整理了一份《2024年最新Golang全套学习资料》,初衷也很简单,就是希望能够帮助到想自学提升又不知道该从何学起的朋友。


既有适合小白学习的零基础资料,也有适合3年以上经验的小伙伴深入学习提升的进阶课程,涵盖了95%以上Go语言开发知识点,真正体系化!
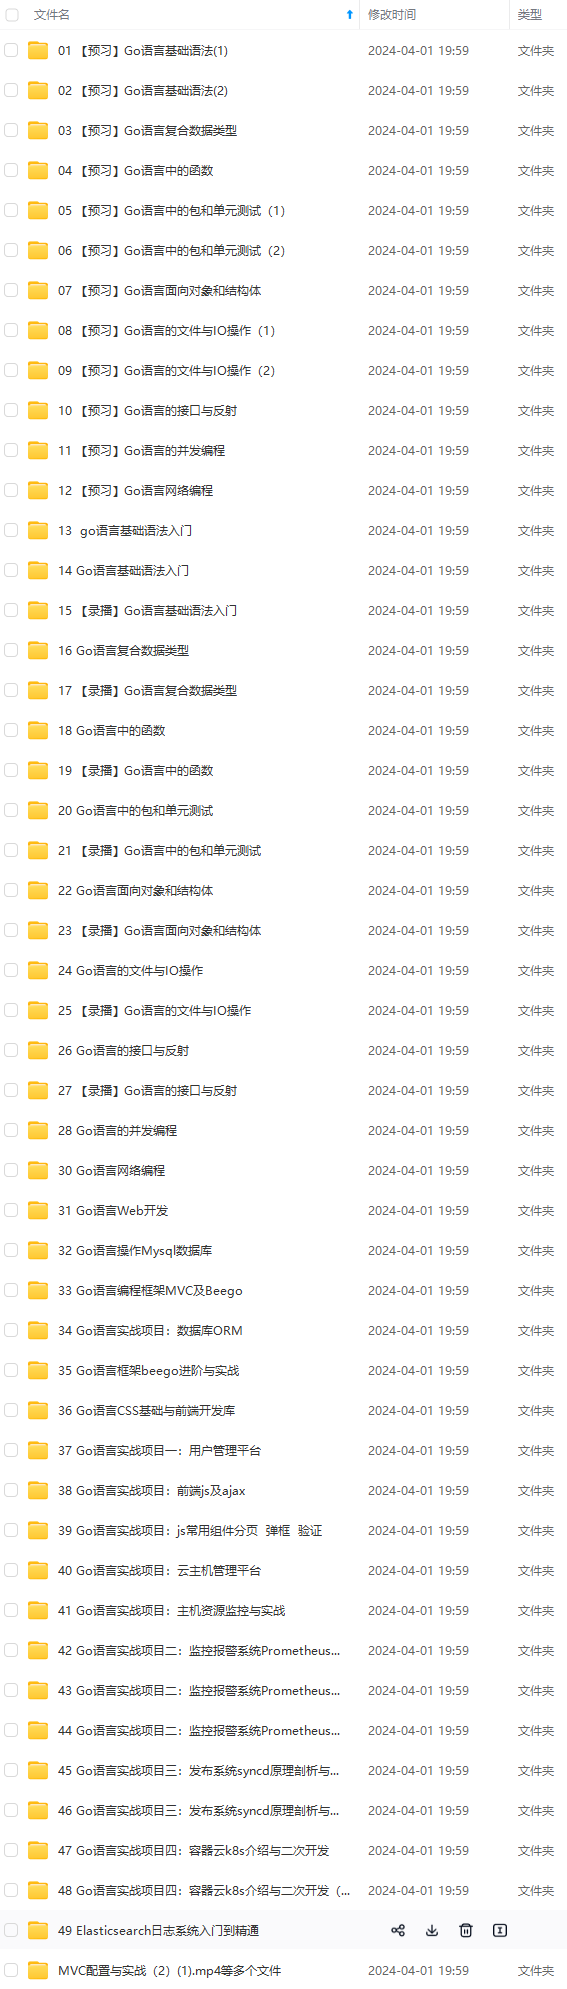
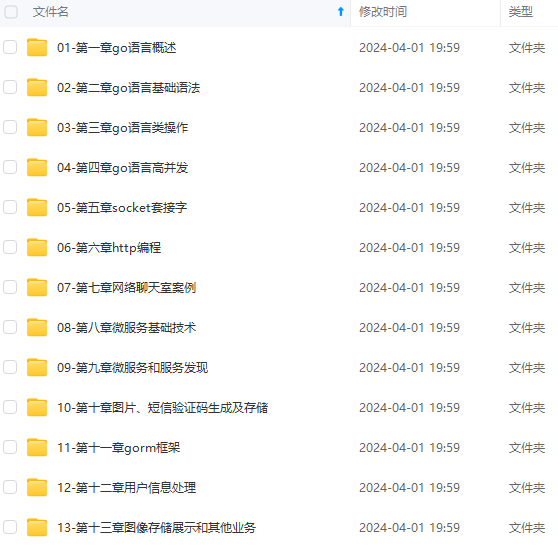
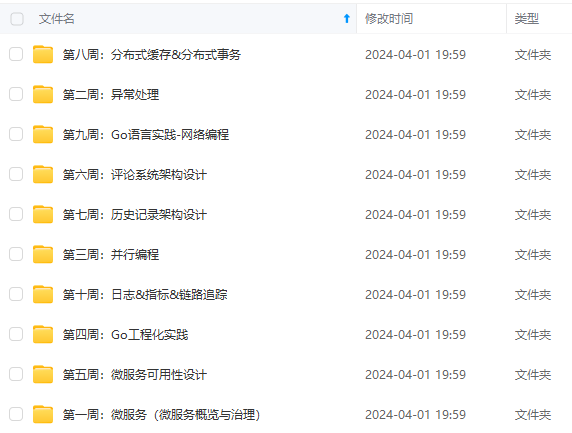
由于文件比较多,这里只是将部分目录截图出来,全套包含大厂面经、学习笔记、源码讲义、实战项目、大纲路线、讲解视频,并且后续会持续更新
如果你需要这些资料,可以添加V获取:vip1024b (备注go)

正文
//结束记录
end = clock();
cost = (double)(end - begin)/CLOCKS_PER_SEC;
printf(“constant CLOCKS_PER_SEC is: %ld, time cost is: %lf secs”, CLOCKS_PER_SEC, cost);
}
constant CLOCKS_PER_SEC is: 1000, time cost is: 0.273000 secs
可以看出浮点型的加和减耗时大概是整型加减的5倍
浮点乘除:
#include <stdio.h>
#include <stdlib.h>
#include <time.h>
int main()
{
clock_t begin, end;
double cost;
//开始记录
begin = clock();
/*待测试程序段*/
double a = 1.0;
for (int i = 0; i < 100000000; i++) {
a = a / i;
}
//结束记录
end = clock();
cost = (double)(end - begin)/CLOCKS_PER_SEC;
printf(“constant CLOCKS_PER_SEC is: %ld, time cost is: %lf secs”, CLOCKS_PER_SEC, cost);
}
constant CLOCKS_PER_SEC is: 1000, time cost is: 0.509000 secs
浮点型的乘和除耗时大概是浮点型的加和减耗时的2倍。
但总体来看进行算术运算的耗时还是比较小的。
测试打印printf
#include <stdio.h>
#include <stdlib.h>
#include <time.h>
int main()
{
clock_t begin, end;
double cost;
//开始记录
begin = clock();
/*待测试程序段*/
for (int i = 0; i < 1000; i++) {
printf(“h”);
}
//结束记录
end = clock();
cost = (double)(end - begin)/CLOCKS_PER_SEC;
printf(“constant CLOCKS_PER_SEC is: %ld, time cost is: %lf secs”, CLOCKS_PER_SEC, cost);
}
constant CLOCKS_PER_SEC is: 1000, time cost is: 0.025000 secs
25 ms/ 1000 = 0.025 ms =25 us
测试还发现一个有趣的现象,打印语句耗时和打印的内容中字符的长短有关。
如果 printf(“h”) 改成 printf(“hh”) 、printf(“hhh”)、printf(“hhhh”)、printf(“hhhhh”)。则耗时分别变成
constant CLOCKS_PER_SEC is: 1000, time cost is: 0.053000 secs
constant CLOCKS_PER_SEC is: 1000, time cost is: 0.076000 secs
constant CLOCKS_PER_SEC is: 1000, time cost is: 0.108000 secs
constant CLOCKS_PER_SEC is: 1000, time cost is: 0.142000 secs
差不多和字符的长度成正比。
函数调用
其实在C语言中,我们都会把经常要调用的代码不长的函数弄成宏或内联函数,这样可以提高运行效率。
这篇博客讲解了一下函数调用耗时的情况:函数调用太多了会有性能问题吗?
下面我们来测试一下函数调用:
#include <stdio.h>
#include <stdlib.h>
#include <time.h>
int callme(int a) {
a = a + 1;
return a;
}
int main()
{
clock_t begin, end;
double cost;
//开始记录
begin = clock();
/*待测试程序段*/
int b;
for (int i = 0; i < 1000000000; i++) {
b = callme(i);
}
//结束记录
end = clock();
cost = (double)(end - begin)/CLOCKS_PER_SEC;
printf(“constant CLOCKS_PER_SEC is: %ld, time cost is: %lf secs”, CLOCKS_PER_SEC, cost);
}
constant CLOCKS_PER_SEC is: 1000, time cost is: 1.198000 secs
1.198s = 1198000000 ns / 1000000000 =1.19 ns
可以看到和上面那篇博客的计算的耗时是差不多的。
二、程序性能分析工具
1.gprof
gprof是一款 GNU profile工具,可以运行于linux、AIX、Sun等操作系统进行C、C++、Pascal、Fortran程序的性能分析,用于程序的性能优化以及程序瓶颈问题的查找和解决。
gprof介绍
gprof(GNU profiler)是GNU binutils工具集中的一个工具,linux系统当中会自带这个工具。它可以分析程序的性能,能给出函数调用时间、调用次数和调用关系,找出程序的瓶颈所在。在编译和链接选项中都加入-pg之后,gcc会在每个函数中插入代码片段,用于记录函数间的调用关系和调用次数,并采集函数的调用时间。
gprof安装
gprof是gcc自带的工具,一般无需额外安装步骤。
首先检查工具是否已经安装在系统上。 为此,只需在终端中运行以下命令即可。
$ gprof
如果您收到以下错误:
$ a.out: No such file or directory
那么这意味着该工具已经安装。 否则可以使用以下命令安装它:
$ apt-get install binutils
gprof使用步骤
1. 用gcc、g++、xlC编译程序时,使用-pg参数
如:g++ -pg -o test.exe test.cpp
编译器会自动在目标代码中插入用于性能测试的代码片断,这些代码在程序运行时采集并记录函数的调用关系和调用次数,并记录函数自身执行时间和被调用函数的执行时间。
2. 执行编译后的可执行程序,生成文件gmon.out
如:./test.exe
该步骤运行程序的时间会稍慢于正常编译的可执行程序的运行时间。程序运行结束后,会在程序所在路径下生成一个缺省文件名为gmon.out的文件,这个文件就是记录程序运行的性能、调用关系、调用次数等信息的数据文件。
3. 使用gprof命令来分析记录程序运行信息的gmon.out文件
如:gprof test.exe gmon.out
可以在显示器上看到函数调用相关的统计、分析信息。上述信息也可以采用gprof test.exe gmon.out> gprofresult.txt重定向到文本文件以便于后续分析。
实战一:用gprof测试基本函数调用及控制流
测试代码
#include <stdio.h>
void loop(int n){
int m = 0;
for(int i=0; i<n; i++){
for(int j=0; j<n; j++){
m++;
}
}
}
void fun2(){
return;
}
void fun1(){
fun2();
}
int main(){
loop(10000);
//fun1callfun2
fun1();
return 0;
}
操作步骤
liboxuan@ubuntu:~/Desktop$ vim test.c
liboxuan@ubuntu:~/Desktop$ gcc -pg -o test_gprof test.c
liboxuan@ubuntu:~/Desktop$ ./test_gprof
liboxuan@ubuntu:~/Desktop$ gprof ./test_gprof gmon.out
报告逻辑是数据表 + 表项解释
Flat profile:
1.第一张表是各个函数的执行和性能报告。
Each sample counts as 0.01 seconds.
% cumulative self self total
time seconds seconds calls ms/call ms/call name
101.20 0.12 0.12 1 121.45 121.45 loop
0.00 0.12 0.00 1 0.00 0.00 fun1
0.00 0.12 0.00 1 0.00 0.00 fun2
% the percentage of the total running time of the
time program used by this function.
cumulative a running sum of the number of seconds accounted
seconds for by this function and those listed above it.
self the number of seconds accounted for by this
seconds function alone. This is the major sort for this
listing.
calls the number of times this function was invoked, if
this function is profiled, else blank.
self the average number of milliseconds spent in this
ms/call function per call, if this function is profiled,
else blank.
total the average number of milliseconds spent in this
ms/call function and its descendents per call, if this
function is profiled, else blank.
name the name of the function. This is the minor sort
for this listing. The index shows the location of
the function in the gprof listing. If the index is
in parenthesis it shows where it would appear in
the gprof listing if it were to be printed.
Copyright © 2012-2015 Free Software Foundation, Inc.
Copying and distribution of this file, with or without modification,
are permitted in any medium without royalty provided the copyright
notice and this notice are preserved.
2.第二张表是程序运行时的
Call graph (explanation follows)
granularity: each sample hit covers 2 byte(s) for 8.23% of 0.12 seconds
index % time self children called name
0.12 0.00 1/1 main [2]
[1] 100.0 0.12 0.00 1 loop [1]
[2] 100.0 0.00 0.12 main [2] 0.12 0.00 1/1 loop [1] 0.00 0.00 1/1 fun1 [3] ----------------------------------------------- 0.00 0.00 1/1 main [2] [3] 0.0 0.00 0.00 1 fun1 [3] 0.00 0.00 1/1 fun2 [4] ----------------------------------------------- 0.00 0.00 1/1 fun1 [3] [4] 0.0 0.00 0.00 1 fun2 [4] -----------------------------------------------
This table describes the call tree of the program, and was sorted by
the total amount of time spent in each function and its children.
Each entry in this table consists of several lines. The line with the
index number at the left hand margin lists the current function.
The lines above it list the functions that called this function,
and the lines below it list the functions this one called.
This line lists:
index A unique number given to each element of the table.
Index numbers are sorted numerically.
The index number is printed next to every function name so
it is easier to look up where the function is in the table.
% time This is the percentage of the `total’ time that was spent
in this function and its children. Note that due to
different viewpoints, functions excluded by options, etc,
these numbers will NOT add up to 100%.
self This is the total amount of time spent in this function.
children This is the total amount of time propagated into this
function by its children.
called This is the number of times the function was called.
If the function called itself recursively, the number
only includes non-recursive calls, and is followed by
a `+’ and the number of recursive calls.
name The name of the current function. The index number is
网上学习资料一大堆,但如果学到的知识不成体系,遇到问题时只是浅尝辄止,不再深入研究,那么很难做到真正的技术提升。
需要这份系统化的资料的朋友,可以添加V获取:vip1024b (备注Go)

一个人可以走的很快,但一群人才能走的更远!不论你是正从事IT行业的老鸟或是对IT行业感兴趣的新人,都欢迎加入我们的的圈子(技术交流、学习资源、职场吐槽、大厂内推、面试辅导),让我们一起学习成长!
n-recursive calls, and is followed by
a `+’ and the number of recursive calls.
name The name of the current function. The index number is
网上学习资料一大堆,但如果学到的知识不成体系,遇到问题时只是浅尝辄止,不再深入研究,那么很难做到真正的技术提升。
需要这份系统化的资料的朋友,可以添加V获取:vip1024b (备注Go)
[外链图片转存中…(img-NZaAF02x-1713287691572)]
一个人可以走的很快,但一群人才能走的更远!不论你是正从事IT行业的老鸟或是对IT行业感兴趣的新人,都欢迎加入我们的的圈子(技术交流、学习资源、职场吐槽、大厂内推、面试辅导),让我们一起学习成长!


 被折叠的 条评论
为什么被折叠?
被折叠的 条评论
为什么被折叠?
 到【灌水乐园】发言


