


先自我介绍一下,小编浙江大学毕业,去过华为、字节跳动等大厂,目前阿里P7
深知大多数程序员,想要提升技能,往往是自己摸索成长,但自己不成体系的自学效果低效又漫长,而且极易碰到天花板技术停滞不前!
因此收集整理了一份《2024年最新软件测试全套学习资料》,初衷也很简单,就是希望能够帮助到想自学提升又不知道该从何学起的朋友。

既有适合小白学习的零基础资料,也有适合3年以上经验的小伙伴深入学习提升的进阶课程,涵盖了95%以上软件测试知识点,真正体系化!
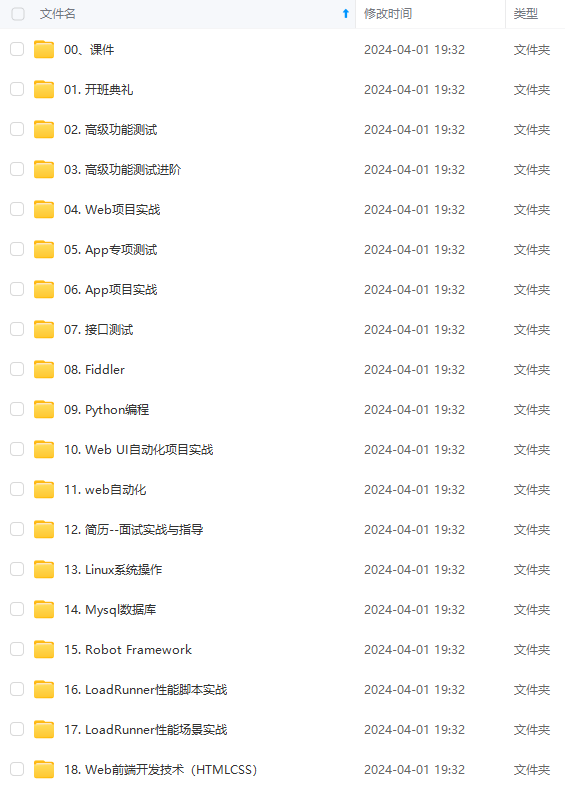
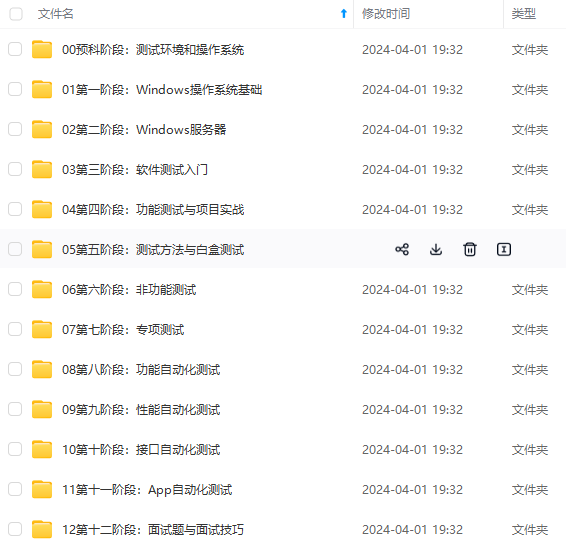
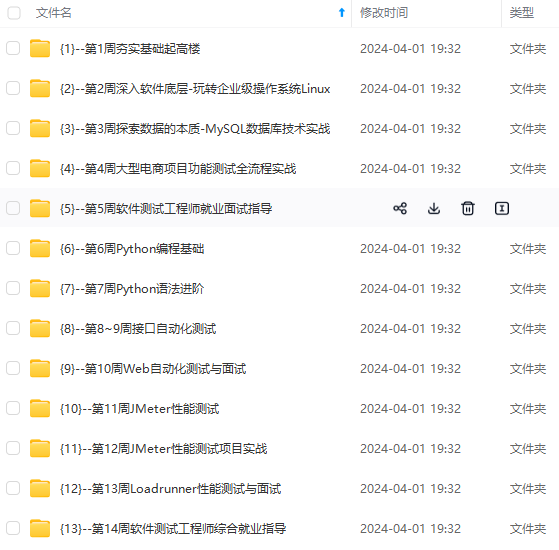
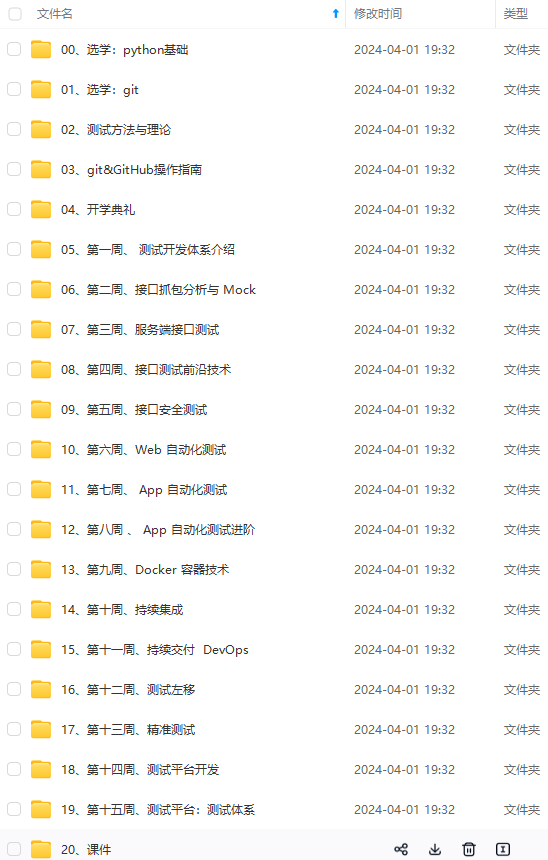
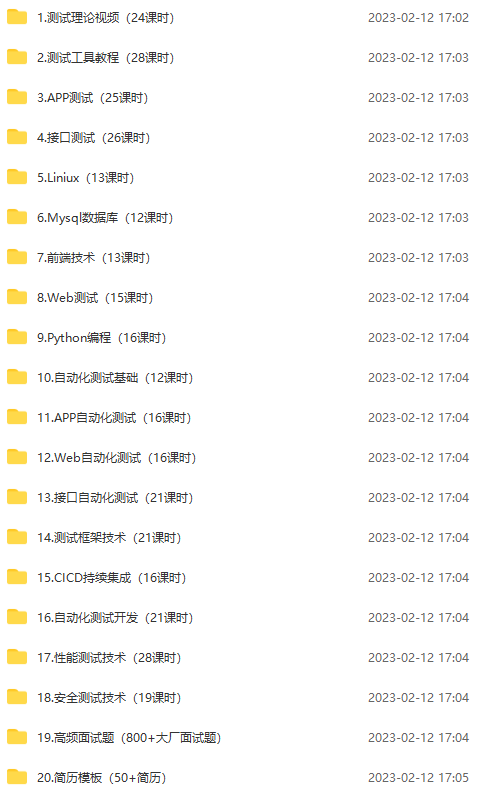
由于文件比较多,这里只是将部分目录截图出来,全套包含大厂面经、学习笔记、源码讲义、实战项目、大纲路线、讲解视频,并且后续会持续更新
如果你需要这些资料,可以添加V获取:vip1024b (备注软件测试)

正文
在 util_test.go 添加性能测试:
// 性能测试
func BenchmarkGenShortID(b *testing.B) {
for i := 0; i < b.N; i++ {
GenShortID()
}
}
运行结果如下(使用 --run=none 避免运行普通的测试函数, 因为一般不可能有函数名匹配 none):
root@592402321ce7:/workspace# go test -v -bench=“BenchmarkGenShortID$” --run=none ./util/
goos: linux
goarch: amd64
pkg: tzh.com/web/util
BenchmarkGenShortID-2 507237 2352 ns/op
PASS
ok tzh.com/web/util 1.229s
这说明, 平均每次运行 GenShortID() 需要 2352 纳秒.
性能分析
运行测试的时候, 可以指定一些参数, 生成性能文件 profile.
-blockprofile block.out
Write a goroutine blocking profile to the specified file
when all tests are complete.
Writes test binary as -c would.
-blockprofilerate n
Control the detail provided in goroutine blocking profiles by
calling runtime.SetBlockProfileRate with n.
See ‘go doc runtime.SetBlockProfileRate’.
The profiler aims to sample, on average, one blocking event every
n nanoseconds the program spends blocked. By default,
if -test.blockprofile is set without this flag, all blocking events
are recorded, equivalent to -test.blockprofilerate=1.
-coverprofile cover.out
Write a coverage profile to the file after all tests have passed.
Sets -cover.
-cpuprofile cpu.out
Write a CPU profile to the specified file before exiting.
Writes test binary as -c would.
-memprofile mem.out
Write an allocation profile to the file after all tests have passed.
Writes test binary as -c would.
-memprofilerate n
Enable more precise (and expensive) memory allocation profiles by
setting runtime.MemProfileRate. See ‘go doc runtime.MemProfileRate’.
To profile all memory allocations, use -test.memprofilerate=1.
-mutexprofile mutex.out
Write a mutex contention profile to the specified file
when all tests are complete.
Writes test binary as -c would.
-mutexprofilefraction n
Sample 1 in n stack traces of goroutines holding a
contended mutex.
使用下面的命令, 生成 CPU 的 profile:
go test -v -bench=“BenchmarkGenShortID$” --run=none -cpuprofile cpu.out ./util/
当前目录下, 应该会生成 cpu.out 文件和 util.test 文件.
使用下面的命令, 观察耗时操作:
进入交互模式
go tool pprof cpu.out
top
安装 Graphviz 后可以生成可视化的分析图.
apt install graphviz
go tool pprof -http=“:” cpu.out
测试覆盖率
root@592402321ce7:/workspace# go test -v -coverprofile=cover.out ./util/
=== RUN TestGenShortID
— PASS: TestGenShortID (0.00s)
PASS
coverage: 9.1% of statements
ok tzh.com/web/util 0.005s coverage: 9.1% of statements
root@592402321ce7:/workspace# go tool cover -func=cover.out
tzh.com/web/util/util.go:12: GenShortID 100.0%
tzh.com/web/util/util.go:17: GetReqID 0.0%
tzh.com/web/util/util.go:22: TimeToStr 0.0%
tzh.com/web/util/util.go:30: GetTag 0.0%
total: (statements) 9.1%
使用 -coverprofile=cover.out 选项可以统计测试覆盖率. 使用 go tool cover -func=cover.out 可以查看更加详细的测试覆盖率结果, 统计每个函数的测试覆盖率.
总结
测试是开发中非常重要的一个环节, 用于保证软件质量, 切不可偷懒.
最后感谢每一个认真阅读我文章的人,看着粉丝一路的上涨和关注,礼尚往来总是要有的,虽然不是什么很值钱的东西,如果你用得到的话可以直接拿走!
软件测试面试文档
我们学习必然是为了找到高薪的工作,下面这些面试题是来自阿里、腾讯、字节等一线互联网大厂最新的面试资料,并且有字节大佬给出了权威的解答,刷完这一套面试资料相信大家都能找到满意的工作。
网上学习资料一大堆,但如果学到的知识不成体系,遇到问题时只是浅尝辄止,不再深入研究,那么很难做到真正的技术提升。
需要这份系统化的资料的朋友,可以添加V获取:vip1024b (备注软件测试)

一个人可以走的很快,但一群人才能走的更远!不论你是正从事IT行业的老鸟或是对IT行业感兴趣的新人,都欢迎加入我们的的圈子(技术交流、学习资源、职场吐槽、大厂内推、面试辅导),让我们一起学习成长!
资料的朋友,可以添加V获取:vip1024b (备注软件测试)**
[外链图片转存中…(img-JWKrXYyf-1713458063455)]
一个人可以走的很快,但一群人才能走的更远!不论你是正从事IT行业的老鸟或是对IT行业感兴趣的新人,都欢迎加入我们的的圈子(技术交流、学习资源、职场吐槽、大厂内推、面试辅导),让我们一起学习成长!


 672
672


 被折叠的 条评论
为什么被折叠?
被折叠的 条评论
为什么被折叠?
 到【灌水乐园】发言


