


final_day = [] # 存放当天的数据
count = 0
for i in dayone:
temp = []
if count <=23:
temp.append(i[‘od21’]) # 添加时间
temp.append(i[‘od22’]) # 添加当前时刻温度
temp.append(i[‘od24’]) # 添加当前时刻风力方向
temp.append(i[‘od25’]) # 添加当前时刻风级
temp.append(i[‘od26’]) # 添加当前时刻降水量
temp.append(i[‘od27’]) # 添加当前时刻相对湿度
temp.append(i[‘od28’]) # 添加当前时刻控制质量
#print(temp)
final_day.append(temp)
count = count +1
下面爬取7天的数据
ul = data.find(‘ul’) # 找到所有的ul标签
li = ul.find_all(‘li’) # 找到左右的li标签
i = 0 # 控制爬取的天数
for day in li: # 遍历找到的每一个li
if i < 7 and i > 0:
temp = [] # 临时存放每天的数据
date = day.find(‘h1’).string # 得到日期
date = date[0:date.index(‘日’)] # 取出日期号
temp.append(date)
inf = day.find_all(‘p’) # 找出li下面的p标签,提取第一个p标签的值,即天气
temp.append(inf[0].string)
tem_low = inf[1].find(‘i’).string # 找到最低气温
if inf[1].find(‘span’) is None: # 天气预报可能没有最高气温
tem_high = None
else:
tem_high = inf[1].find(‘span’).string # 找到最高气温
temp.append(tem_low[:-1])
if tem_high[-1] == ‘℃’:
temp.append(tem_high[:-1])
else:
temp.append(tem_high)
wind = inf[2].find_all(‘span’) # 找到风向
for j in wind:
temp.append(j[‘title’])
wind_scale = inf[2].find(‘i’).string # 找到风级
index1 = wind_scale.index(‘级’)
temp.append(int(wind_scale[index1-1:index1]))
final.append(temp)
i = i + 1
return final_day,final
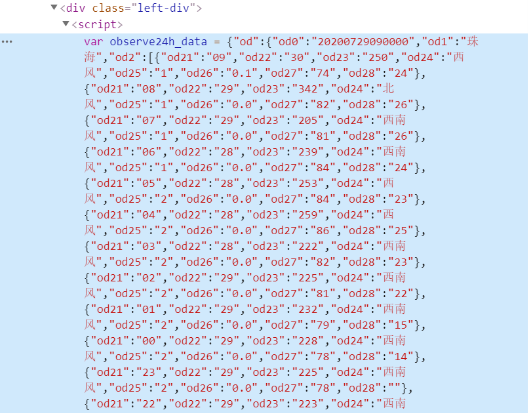
同样对于/weather15d:15天的信息,也做同样的处理,这里经过查看后发现他的15天网页中只有8-14天,前面的1-7天在/weather中,这里就分别访问两个网页将爬取得到的数据进行合并得到最终14天的数据。- 前面是未来14天的数据爬取过程,对于当天24小时的天气信息数据,经过查找发现他是一个json数据,可以通过json.loads()
方法获取当天的数据,进而对当天的天气信息进行提取。
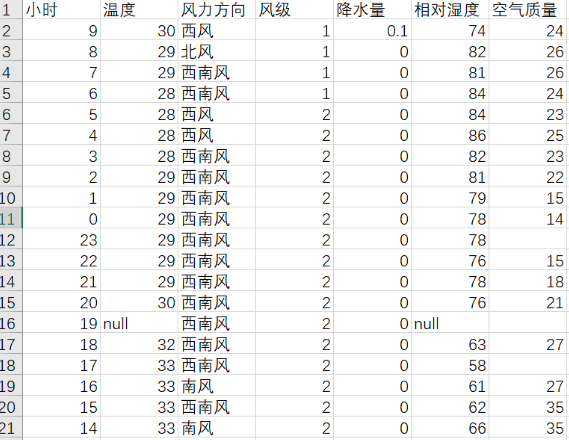
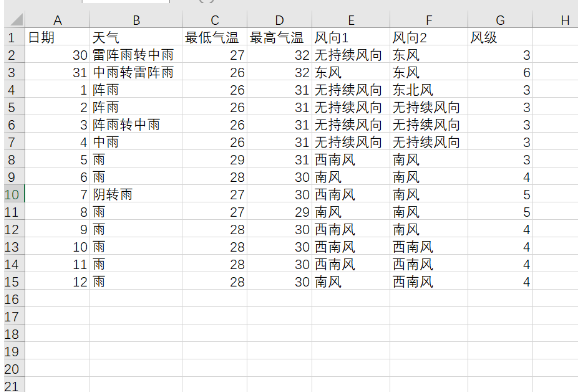
**保存csv文件**
前面将爬取的数据添加到列表中,这里引入csv库,利用f\_csv.writerow(header)和f\_csv.writerows(data)方法,分别写入表头和每一行的数据,这里将1天和未来14天的数据分开存储,分别保存为weather1.csv和weather14.csv,下面是他们保存的表格图:
### **2.可视化分析**
**当天温度变化曲线图**
采用matplotlib中plt.plot()方法绘制出一天24小时的温度变化曲线,并用plt.text()方法点出最高温和最低温,并画出平均温度线,下图为温度变化曲线图:(代码见附录)
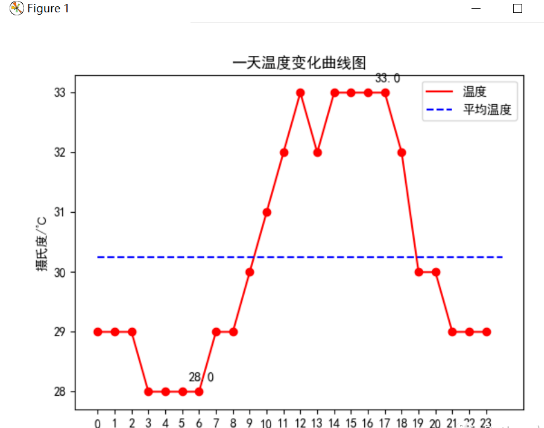
分析可以发现这一天最高温度为33℃,最低温度为28℃,并且平均温度在20.4℃左右,通过对时间分析,发现昼夜温差5℃,低温分布在凌晨,高温分布在中午到下午的时间段。
**当天相对湿度变化曲线图**
采用matplotlib中plt.plot()方法绘制出一天24小时的湿度变化曲线,并画出平均相对湿度线,下图为湿度变化曲线图:(代码见附录)
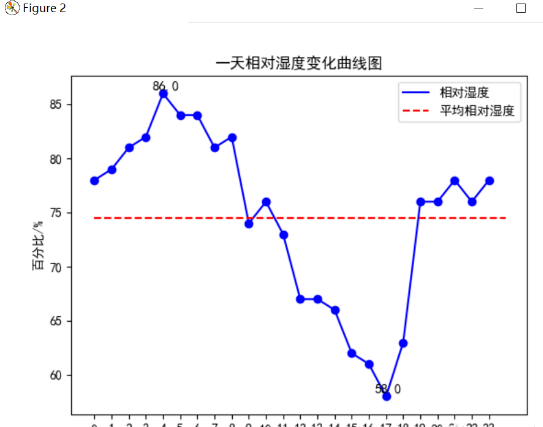
分析可以发现这一天最高相对湿度为86%,最低相对湿度为58℃,并且平均相对湿度在75%左右,通过对时间分析,清晨的湿度比较大,而下午至黄昏湿度较小。
**温湿度相关性分析图**
经过前面两个图的分析我们可以感觉到温度和湿度之间是有关系的,为了更加清楚直观地感受这种关系,使用plt.scatter()方法将温度为横坐标、湿度为纵坐标,每个时刻的点在图中点出来,并且计算相关系数,下图为结果图:
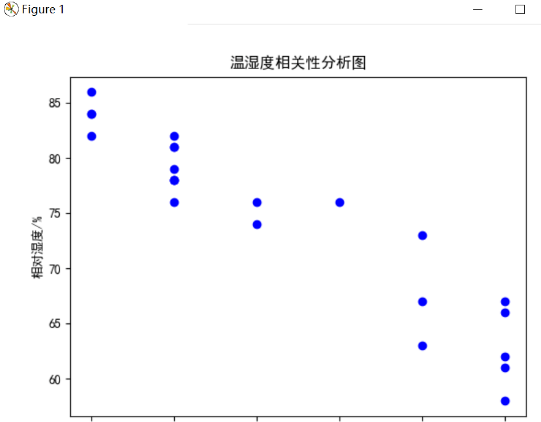
分析可以发现一天的温度和湿度具有强烈的相关性,他们呈负相关,这就说明他们时间是负相关关系,并且进一步分析,当温度较低时,空气中水分含量较多,湿度自然较高,而温度较高时,水分蒸发,空气就比较干 燥,湿度较低,符合平时气候现象。
**空气质量指数柱状图**
空气质量指数AQI是定量描述空气质量状况的指数,其数值越大说明空气污染状况越重,对人体健康的危害也就越大。一般将空气质量指数分为6个等级,等级越高说明污染越严重,下面使用plt.bar方法对一天24小时的空气质量进行了柱状图绘制,并且根据6个等级的不同,相应的柱状图的颜色也从浅到深,也表明污染逐步加重,更直观的显示污染情况,并且也将最高和最低的空气质量指数标出,用虚线画出平均的空气质量指数,下图是绘制结果图:
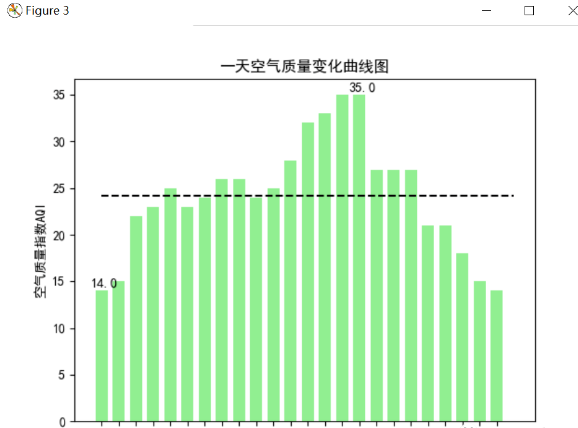
上面这张是南方珠海的控制质量图,可以看出空气质量指数最大也是在健康范围,说明珠海空气非常好,分析可以发现这一天最高空气质量指数达到了35,最低则只有14,并且平均在25左右,通过时间也可以发现,基本在清晨的时候是空气最好的时候(4-9点),在下午是空气污染最严重的时候,所以清晨一般可以去外面呼吸新鲜的空气,那时污染最小。
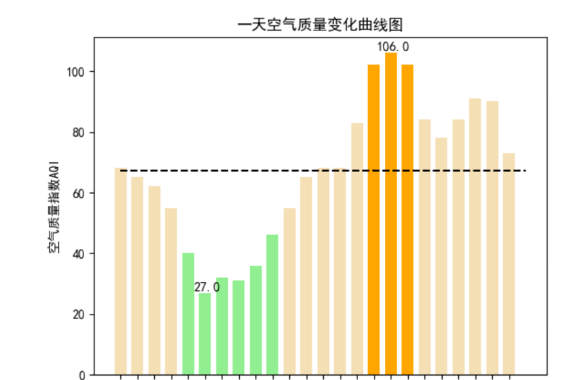
而下面这个空气质量图是选取的北方的一个城市,可以看到这里的环境远远比不上珠海。
**风向风级雷达图**
统计一天的风力和风向,由于风力风向使用极坐标的方式展现较好,所以这里采用的是极坐标的方式展现一天的风力风向图,将圆分为8份,每一份代表一个风向,半径代表平均风力,并且随着风级增高,蓝色加深,最后结果如下所示:
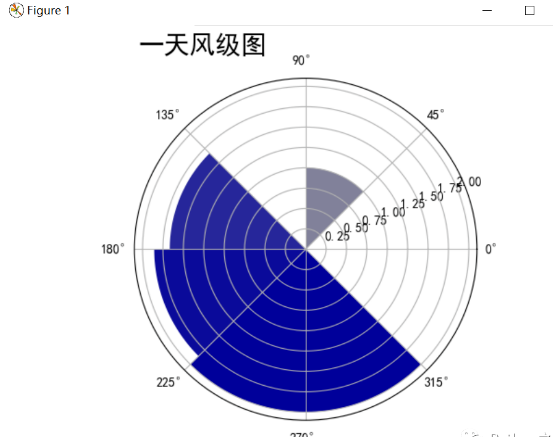
分析可以发现这一天西南风最多,平均风级达到了1.75级,东北风也有小部分1.0级,其余空白方向无来风。
**未来14天高低温变化曲线图**
统计未来14天的高低温度变化,并绘制出他们的变化曲线图,分别用虚线将他们的平均气温线绘制出来,最后结果如下所示:
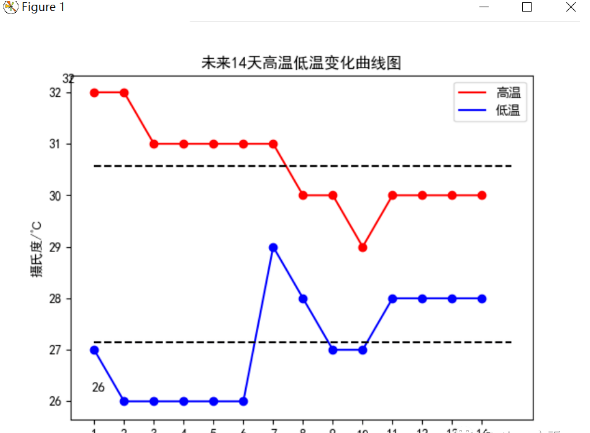
分析可以发现未来14天高温平均气温为30.5℃,温度还是比较高,但是未来的第8天有降温,需要做好降温准备,低温前面处于平稳趋势,等到第8天开始下降,伴随着高温也下降,整体温度下降,低温平均在27℃左右。
**未来14天风向风级雷达图**
统计未来14天的风向和平均风力,并和前面一样采用极坐标形式,将圆周分为8个部分,代表8个方向,颜色越深代表风级越高,最后结果如下所示:
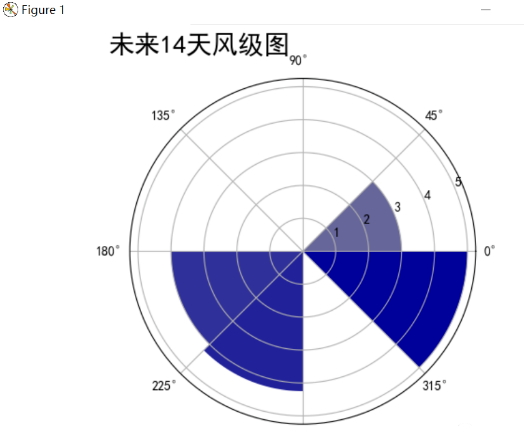
分析可以发现未来14天东南风、西南风所占主要风向,风级最高达到了5级,最低的西风平均风级也有3级。
**未来14天气候分布饼图**
统计未来14天的气候,并求每个气候的总天数,最后将各个气候的饼图绘制出来,结果如下所示:
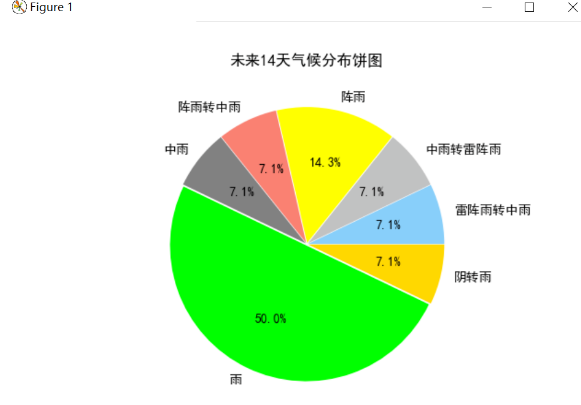
分析可以发现未来14天气候基本是“雨”、“阴转雨”和“阵雨”,下雨的天数较多,结合前面的气温分布图可以看出在第8-9天气温高温下降,可以推测当天下雨,导致气温下降。
### **3、结论**
1.首先根据爬取的温湿度数据进行的分析,温度从早上低到中午高再到晚上低,湿度和温度的趋势相反,通过相关系数发现温度和湿度有强烈的负相关关系,经查阅资料发现因为随着温度升高水蒸汽蒸发加剧,空气中水分降低湿度降低。当然,湿度同时受气压和雨水的影响,下雨湿度会明显增高。
2.经查阅资料空气质量不仅跟工厂、汽车等排放的烟气、废气等有关,更为重要的是与气象因素有关。由于昼夜温差明显变化,当地面温度高于高空温度时,空气上升,污染物易被带到高空扩散;当地面温度低于一定高度的温度时,天空形成逆温层,它像一个大盖子一样压在地面上空,使地表空气中各种污染物不易扩散。一般在晚间和清晨影响较大,而当太阳出来后,地面迅速升温,逆温层就会逐渐消散,于是污染空气也就扩散了。
3.风是由气压在水平方向分布的不均匀导致的。风受大气环流、地形、水域等不同因素的综合影响,表现形式多种多样,如季风、地方性的海陆风、山谷风等,一天的风向也有不同的变化,根据未来14天的风向雷达图可以发现未来所有风向基本都有涉及,并且没有特别的某个风向,原因可能是近期没有降水和气文变化不大,导致风向也没有太大的变化规律。
4.天气是指某一个地区距离地表较近的大气层在短时间内的具体状态。跟某瞬时内大气中各种气象要素分布的综合表现。根据未来14天的天气和温度变化可以大致推断出某个时间的气候,天气和温度之间也是有联系的。
**4、代码框架**
代码主要分为weather.py:对中国天气网进行爬取天气数据并保存csv文件;data1\_analysis.py:对当天的天气信息进行可视化处理;data14\_analysis.py:对未来14天的天气信息进行可视化处理。下面是代码的结构图:

**附源代码**
**weather.py**
# weather.py
import requests
from bs4 import BeautifulSoup
import csv
import json
def getHTMLtext(url):
“”“请求获得网页内容”“”
try:
r = requests.get(url, timeout = 30)
r.raise_for_status()
r.encoding = r.apparent_encoding
print(“成功访问”)
return r.text
except:
print(“访问错误”)
return" "
def get_content(html):
“”“处理得到有用信息保存数据文件”“”
final = [] # 初始化一个列表保存数据
bs = BeautifulSoup(html, “html.parser”) # 创建BeautifulSoup对象
body = bs.body
data = body.find(‘div’, {
‘id’: ‘7d’}) # 找到div标签且id = 7d
# 下面爬取当天的数据
data2 = body.find_all(‘div’,{
‘class’:‘left-div’})
text = data2[2].find(‘script’).string
text = text[text.index(‘=’)+1 :-2] # 移除改var data=将其变为json数据
jd = json.loads(text)
dayone = jd[‘od’][‘od2’] # 找到当天的数据
final_day = [] # 存放当天的数据
count = 0
for i in dayone:
temp = []
if count <=23:
temp.append(i[‘od21’]) # 添加时间
temp.append(i[‘od22’]) # 添加当前时刻温度
temp.append(i[‘od24’]) # 添加当前时刻风力方向
temp.append(i[‘od25’]) # 添加当前时刻风级
temp.append(i[‘od26’]) # 添加当前时刻降水量
temp.append(i[‘od27’]) # 添加当前时刻相对湿度
temp.append(i[‘od28’]) # 添加当前时刻控制质量
#print(temp)
final_day.append(temp)
count = count +1
# 下面爬取7天的数据
ul = data.find(‘ul’) # 找到所有的ul标签
li = ul.find_all(‘li’) # 找到左右的li标签
i = 0 # 控制爬取的天数
for day in li: # 遍历找到的每一个li
if i < 7 and i > 0:
temp = [] # 临时存放每天的数据
date = day.find(‘h1’).string # 得到日期
date = date[0:date.index(‘日’)] # 取出日期号
temp.append(date)
inf = day.find_all(‘p’) # 找出li下面的p标签,提取第一个p标签的值,即天气
temp.append(inf[0].string)
tem_low = inf[1].find(‘i’).string # 找到最低气温
if inf[1].find(‘span’) is None: # 天气预报可能没有最高气温
tem_high = None
else:
tem_high = inf[1].find(‘span’).string # 找到最高气温
temp.append(tem_low[:-1])
if tem_high[-1] == ‘℃’:
temp.append(tem_high[:-1])
else:
temp.append(tem_high)
wind = inf[2].find_all(‘span’) # 找到风向
for j in wind:
temp.append(j[‘title’])
wind_scale = inf[2].find(‘i’).string # 找到风级
index1 = wind_scale.index(‘级’)
temp.append(int(wind_scale[index1-1:index1]))
final.append(temp)
i = i + 1
return final_day,final
#print(final)
def get_content2(html):
“”“处理得到有用信息保存数据文件”“”
final = [] # 初始化一个列表保存数据
bs = BeautifulSoup(html, “html.parser”) # 创建BeautifulSoup对象
body = bs.body
data = body.find(‘div’, {
‘id’: ‘15d’}) # 找到div标签且id = 15d
ul = data.find(‘ul’) # 找到所有的ul标签
li = ul.find_all(‘li’) # 找到左右的li标签
final = []
i = 0 # 控制爬取的天数
for day in li: # 遍历找到的每一个li
if i < 8:
temp = [] # 临时存放每天的数据
date = day.find(‘span’,{
‘class’:‘time’}).string # 得到日期
date = date[date.index(‘(’)+1:-2] # 取出日期号
temp.append(date)
weather = day.find(‘span’,{
‘class’:‘wea’}).string # 找到天气
temp.append(weather)
tem = day.find(‘span’,{
‘class’:‘tem’}).text # 找到温度
temp.append(tem[tem.index(‘/’)+1:-1]) # 找到最低气温
temp.append(tem[:tem.index(‘/’)-1]) # 找到最高气温
wind = day.find(‘span’,{
‘class’:‘wind’}).string # 找到风向
if ‘转’ in wind: # 如果有风向变化
temp.append(wind[:wind.index(‘转’)])
temp.append(wind[wind.index(‘转’)+1:])
else: # 如果没有风向变化,前后风向一致
temp.append(wind)
temp.append(wind)
wind_scale = day.find(‘span’,{
‘class’:‘wind1’}).string # 找到风级
index1 = wind_scale.index(‘级’)
temp.append(int(wind_scale[index1-1:index1]))
final.append(temp)
return final
def write_to_csv(file_name, data, day=14):
“”“保存为csv文件”“”
with open(file_name, ‘a’, errors=‘ignore’, newline=‘’) as f:
if day == 14:
header = [‘日期’,‘天气’,‘最低气温’,‘最高气温’,‘风向1’,‘风向2’,‘风级’]
else:
header = [‘小时’,‘温度’,‘风力方向’,‘风级’,‘降水量’,‘相对湿度’,‘空气质量’]
f_csv = csv.writer(f)
f_csv.writerow(header)
f_csv.writerows(data)
def main():
“”“主函数”“”
print(“Weather test”)
# 珠海
url1 = ‘http://www.weather.com.cn/weather/101280701.shtml’ # 7天天气中国天气网
url2 = ‘http://www.weather.com.cn/weather15d/101280701.shtml’ # 8-15天天气中国天气网
html1 = getHTMLtext(url1)
data1, data1_7 = get_content(html1) # 获得1-7天和当天的数据
html2 = getHTMLtext(url2)
data8_14 = get_content2(html2) # 获得8-14天数据
data14 = data1_7 + data8_14
#print(data)
write_to_csv(‘weather14.csv’,data14,14) # 保存为csv文件
write_to_csv(‘weather1.csv’,data1,1)
if name == ‘main’:
main()
**data1\_analysis.py:**
# data1_analysis.py
import matplotlib.pyplot as plt
import numpy as np
import pandas as pd
import math
def tem_curve(data):
“”“温度曲线绘制”“”
hour = list(data[‘小时’])
tem = list(data[‘温度’])
for i in range(0,24):
if math.isnan(tem[i]) == True:
tem[i] = tem[i-1]
tem_ave = sum(tem)/24 # 求平均温度
tem_max = max(tem)
tem_max_hour = hour[tem.index(tem_max)] # 求最高温度
tem_min = min(tem)
tem_min_hour = hour[tem.index(tem_min)] # 求最低温度
x = []
y = []
for i in range(0, 24):
x.append(i)
y.append(tem[hour.index(i)])
plt.figure(1)
plt.plot(x,y,color=‘red’,label=‘温度’) # 画出温度曲线
plt.scatter(x,y,color=‘red’) # 点出每个时刻的温度点
plt.plot([0, 24], [tem_ave, tem_ave], c=‘blue’, linestyle=‘–’,label=‘平均温度’) # 画出平均温度虚线
plt.text(tem_max_hour+0.15, tem_max+0.15, str(tem_max), ha=‘center’, va=‘bottom’, fontsize=10.5) # 标出最高温度
plt.text(tem_min_hour+0.15, tem_min+0.15, str(tem_min), ha=‘center’, va=‘bottom’, fontsize=10.5) # 标出最低温度
plt.xticks(x)
plt.legend()
plt.title(‘一天温度变化曲线图’)
plt.xlabel(‘时间/h’)
plt.ylabel(‘摄氏度/℃’)
plt.show()
def hum_curve(data):
“”“相对湿度曲线绘制”“”
hour = list(data[‘小时’])
hum = list(data[‘相对湿度’])
for i in range(0,24):
if math.isnan(hum[i]) == True:
hum[i] = hum[i-1]
hum_ave = sum(hum)/24 # 求平均相对湿度
hum_max = max(hum)
hum_max_hour = hour[hum.index(hum_max)] # 求最高相对湿度
hum_min = min(hum)
hum_min_hour = hour[hum.index(hum_min)] # 求最低相对湿度
x = []
y = []
for i in range(0, 24):
x.append(i)
y.append(hum[hour.index(i)])
plt.figure(2)
plt.plot(x,y,color=‘blue’,label=‘相对湿度’) # 画出相对湿度曲线
plt.scatter(x,y,color=‘blue’) # 点出每个时刻的相对湿度
plt.plot([0, 24], [hum_ave, hum_ave], c=‘red’, linestyle=‘–’,label=‘平均相对湿度’) # 画出平均相对湿度虚线
plt.text(hum_max_hour+0.15, hum_max+0.15, str(hum_max), ha=‘center’, va=‘bottom’, fontsize=10.5) # 标出最高相对湿度
plt.text(hum_min_hour+0.15, hum_min+0.15, str(hum_min), ha=‘center’, va=‘bottom’, fontsize=10.5) # 标出最低相对湿度
plt.xticks(x)
plt.legend()
plt.title(‘一天相对湿度变化曲线图’)
plt.xlabel(‘时间/h’)
plt.ylabel(‘百分比/%’)
plt.show()
def air_curve(data):
“”“空气质量曲线绘制”“”
hour = list(data[‘小时’])
air = list(data[‘空气质量’])
print(type(air[0]))
for i in range(0,24):
if math.isnan(air[i]) == True:
air[i] = air[i-1]
air_ave = sum(air)/24 # 求平均空气质量
air_max = max(air)
air_max_hour = hour[air.index(air_max)] # 求最高空气质量
air_min = min(air)
air_min_hour = hour[air.index(air_min)] # 求最低空气质量
x = []
y = []
for i in range(0, 24):
x.append(i)
y.append(air[hour.index(i)])
plt.figure(3)
for i in range(0,24):
if y[i] <= 50:
plt.bar(x[i],y[i],color=‘lightgreen’,width=0.7) # 1等级
elif y[i] <= 100:
plt.bar(x[i],y[i],color=‘wheat’,width=0.7) # 2等级
elif y[i] <= 150:
plt.bar(x[i],y[i],color=‘orange’,width=0.7) # 3等级
elif y[i] <= 200:
plt.bar(x[i],y[i],color=‘orangered’,width=0.7) # 4等级
elif y[i] <= 300:
plt.bar(x[i],y[i],color=‘darkviolet’,width=0.7) # 5等级
elif y[i] > 300:
plt.bar(x[i],y[i],color=‘maroon’,width=0.7) # 6等级
plt.plot([0, 24], [air_ave, air_ave], c=‘black’, linestyle=‘–’) # 画出平均空气质量虚线
plt.text(air_max_hour+0.15, air_max+0.15, str(air_max), ha=‘center’, va=‘bottom’, fontsize=10.5) # 标出最高空气质量
plt.text(air_min_hour+0.15, air_min+0.15, str(air_min), ha=‘center’, va=‘bottom’, fontsize=10.5) # 标出最低空气质量
plt.xticks(x)
plt.title(‘一天空气质量变化曲线图’)
plt.xlabel(‘时间/h’)
plt.ylabel(‘空气质量指数AQI’)
plt.show()
def wind_radar(data):
“”“风向雷达图”“”
wind = list(data[‘风力方向’])
wind_speed = list(data[‘风级’])
for i in range(0,24):
if wind[i] == “北风”:
wind[i] = 90
elif wind[i] == “南风”:
wind[i] = 270
elif wind[i] == “西风”:
wind[i] = 180
elif wind[i] == “东风”:
wind[i] = 360
elif wind[i] == “东北风”:
wind[i] = 45
elif wind[i] == “西北风”:
wind[i] = 135
elif wind[i] == “西南风”:
wind[i] = 225
elif wind[i] == “东南风”:
wind[i] = 315
degs = np.arange(45,361,45)
temp = []
for deg in degs:
speed = []
# 获取 wind_deg 在指定范围的风速平均值数据
for i in range(0,24):
if wind[i] == deg:
speed.append(wind_speed[i])
if len(speed) == 0:
temp.append(0)
else:
temp.append(sum(speed)/len(speed))
print(temp)
N = 8
theta = np.arange(0.+np.pi/8,2np.pi+np.pi/8,2np.pi/8)
# 数据极径
radii = np.array(temp)
# 绘制极区图坐标系
plt.axes(polar=True)
# 定义每个扇区的RGB值(R,G,B),x越大,对应的颜色越接近蓝色
colors = [(1-x/max(temp), 1-x/max(temp),0.6) for x in radii]
plt.bar(theta,radii,width=(2*np.pi/N),bottom=0.0,color=colors)
plt.title(‘一天风级图’,x=0.2,fontsize=20)
plt.show()
def calc_corr(a, b):
“”“计算相关系数”“”
a_avg = sum(a)/len(a)
b_avg = sum(b)/len(b)
cov_ab = sum([(x - a_avg)*(y - b_avg) for x,y in zip(a, b)])
sq = math.sqrt(sum([(x - a_avg)**2 for x in a])*sum([(x - b_avg)**2 for x in b]))
corr_factor = cov_ab/sq
return corr_factor
def corr_tem_hum(data):
“”“温湿度相关性分析”“”
一、网安学习成长路线图
网安所有方向的技术点做的整理,形成各个领域的知识点汇总,它的用处就在于,你可以按照上面的知识点去找对应的学习资源,保证自己学得较为全面。
二、网安视频合集
观看零基础学习视频,看视频学习是最快捷也是最有效果的方式,跟着视频中老师的思路,从基础到深入,还是很容易入门的。

三、精品网安学习书籍
当我学到一定基础,有自己的理解能力的时候,会去阅读一些前辈整理的书籍或者手写的笔记资料,这些笔记详细记载了他们对一些技术点的理解,这些理解是比较独到,可以学到不一样的思路。
四、网络安全源码合集+工具包
光学理论是没用的,要学会跟着一起敲,要动手实操,才能将自己的所学运用到实际当中去,这时候可以搞点实战案例来学习。
五、网络安全面试题
最后就是大家最关心的网络安全面试题板块
网上学习资料一大堆,但如果学到的知识不成体系,遇到问题时只是浅尝辄止,不再深入研究,那么很难做到真正的技术提升。
一个人可以走的很快,但一群人才能走的更远!不论你是正从事IT行业的老鸟或是对IT行业感兴趣的新人,都欢迎加入我们的的圈子(技术交流、学习资源、职场吐槽、大厂内推、面试辅导),让我们一起学习成长!


 3710
3710

 被折叠的 条评论
为什么被折叠?
被折叠的 条评论
为什么被折叠?
 到【灌水乐园】发言


