


 该文章介绍了使用Python进行中国电影票房数据的统计和可视化,包括2021年票房top10的线图、条形图、直方图以及不同类型电影的详细分析。作者展示了如何处理大量Excel数据,并通过各种图表展示票房与人次、价格的关系。
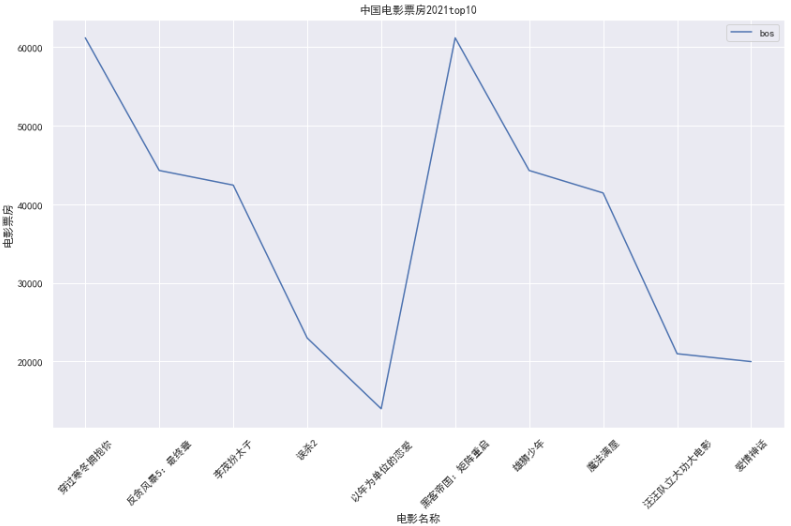
plt.figure(figsize=(14,8))
plt.title(“中国电影票房2021top10”)
plt.xlabel(“电影名称”)
plt.ylabel(“电影票房”)
sns.lineplot(data=cnbo2021top5[[‘bos’]])
plt.xticks(rotation=45)
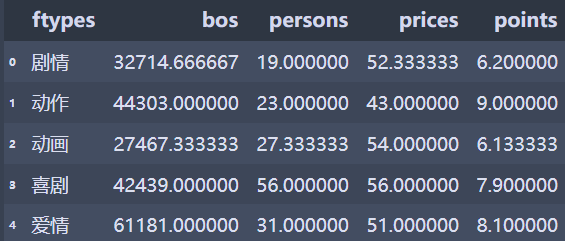
cnbo2021top5ftgb=cnbo2021top5.groupby([‘ftypes’])[‘bos’,‘persons’,‘prices’,‘points’].mean()
cnbo2021top5ftgb=cnbo2021top5ftgb.reset_index().replace()
cnbo2021top5ftgb
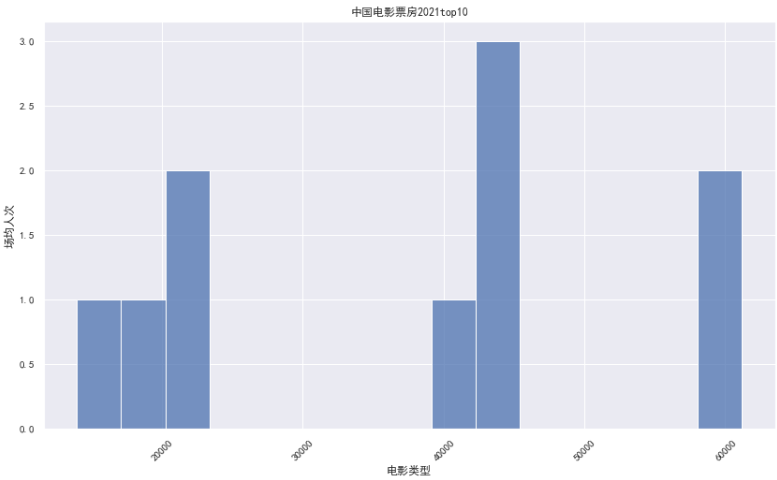
02 条形图
plt.figure(figsize=(14,8))
plt.title(“中国电影票房2021top10”)
sns.barplot(x=cnbo2021top5ftgb[‘ftypes’],y=cnbo2021top5ftgb[‘persons’])
plt.xlabel(“电影类型”)
plt.ylabel(“场均人次”)
plt.xticks(rotation=45)
plt.show()

03 直方图
plt.figure(figsize=(14,8))
plt.title(“中国电影票房2021top10”)
sns.histplot(x=cnbo2021top5[‘bos’],bins=15) # x=cnbo2021top5ftgb[‘ftypes’],y=cnbo2021top5ftgb[‘persons’]
plt.xlabel(“电影类型”)
plt.ylabel(“场均人次”)
plt.xticks(rotation=45)
plt.show()
==================================================================
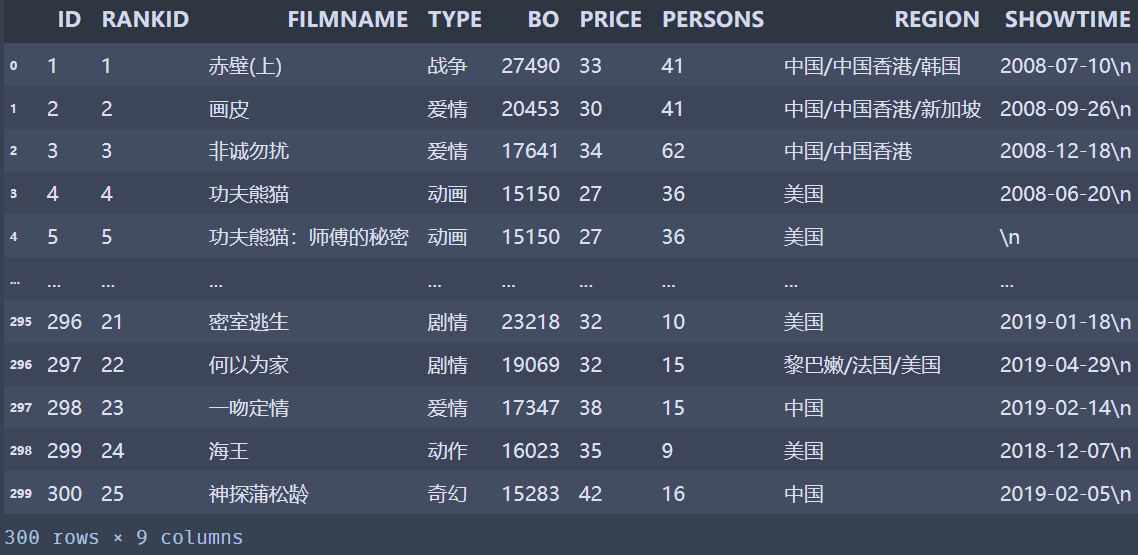
上面的数据只有十部电影,而下面的数据是我整理出来的电影数据:
import pandas as pd
cnboo=pd.read_excel(“cnboNPPD1.xlsx”)
cnboo
设定调色盘
sns.set_palette(color)
sns.palplot(sns.color_palette(color,11)) # 表示11种颜色
 最低0.47元/天 解锁文章


 633
633

 被折叠的 条评论
为什么被折叠?
被折叠的 条评论
为什么被折叠?
 到【灌水乐园】发言


