


既有适合小白学习的零基础资料,也有适合3年以上经验的小伙伴深入学习提升的进阶课程,涵盖了95%以上软件测试知识点,真正体系化!
由于文件比较多,这里只是将部分目录截图出来,全套包含大厂面经、学习笔记、源码讲义、实战项目、大纲路线、讲解视频,并且后续会持续更新
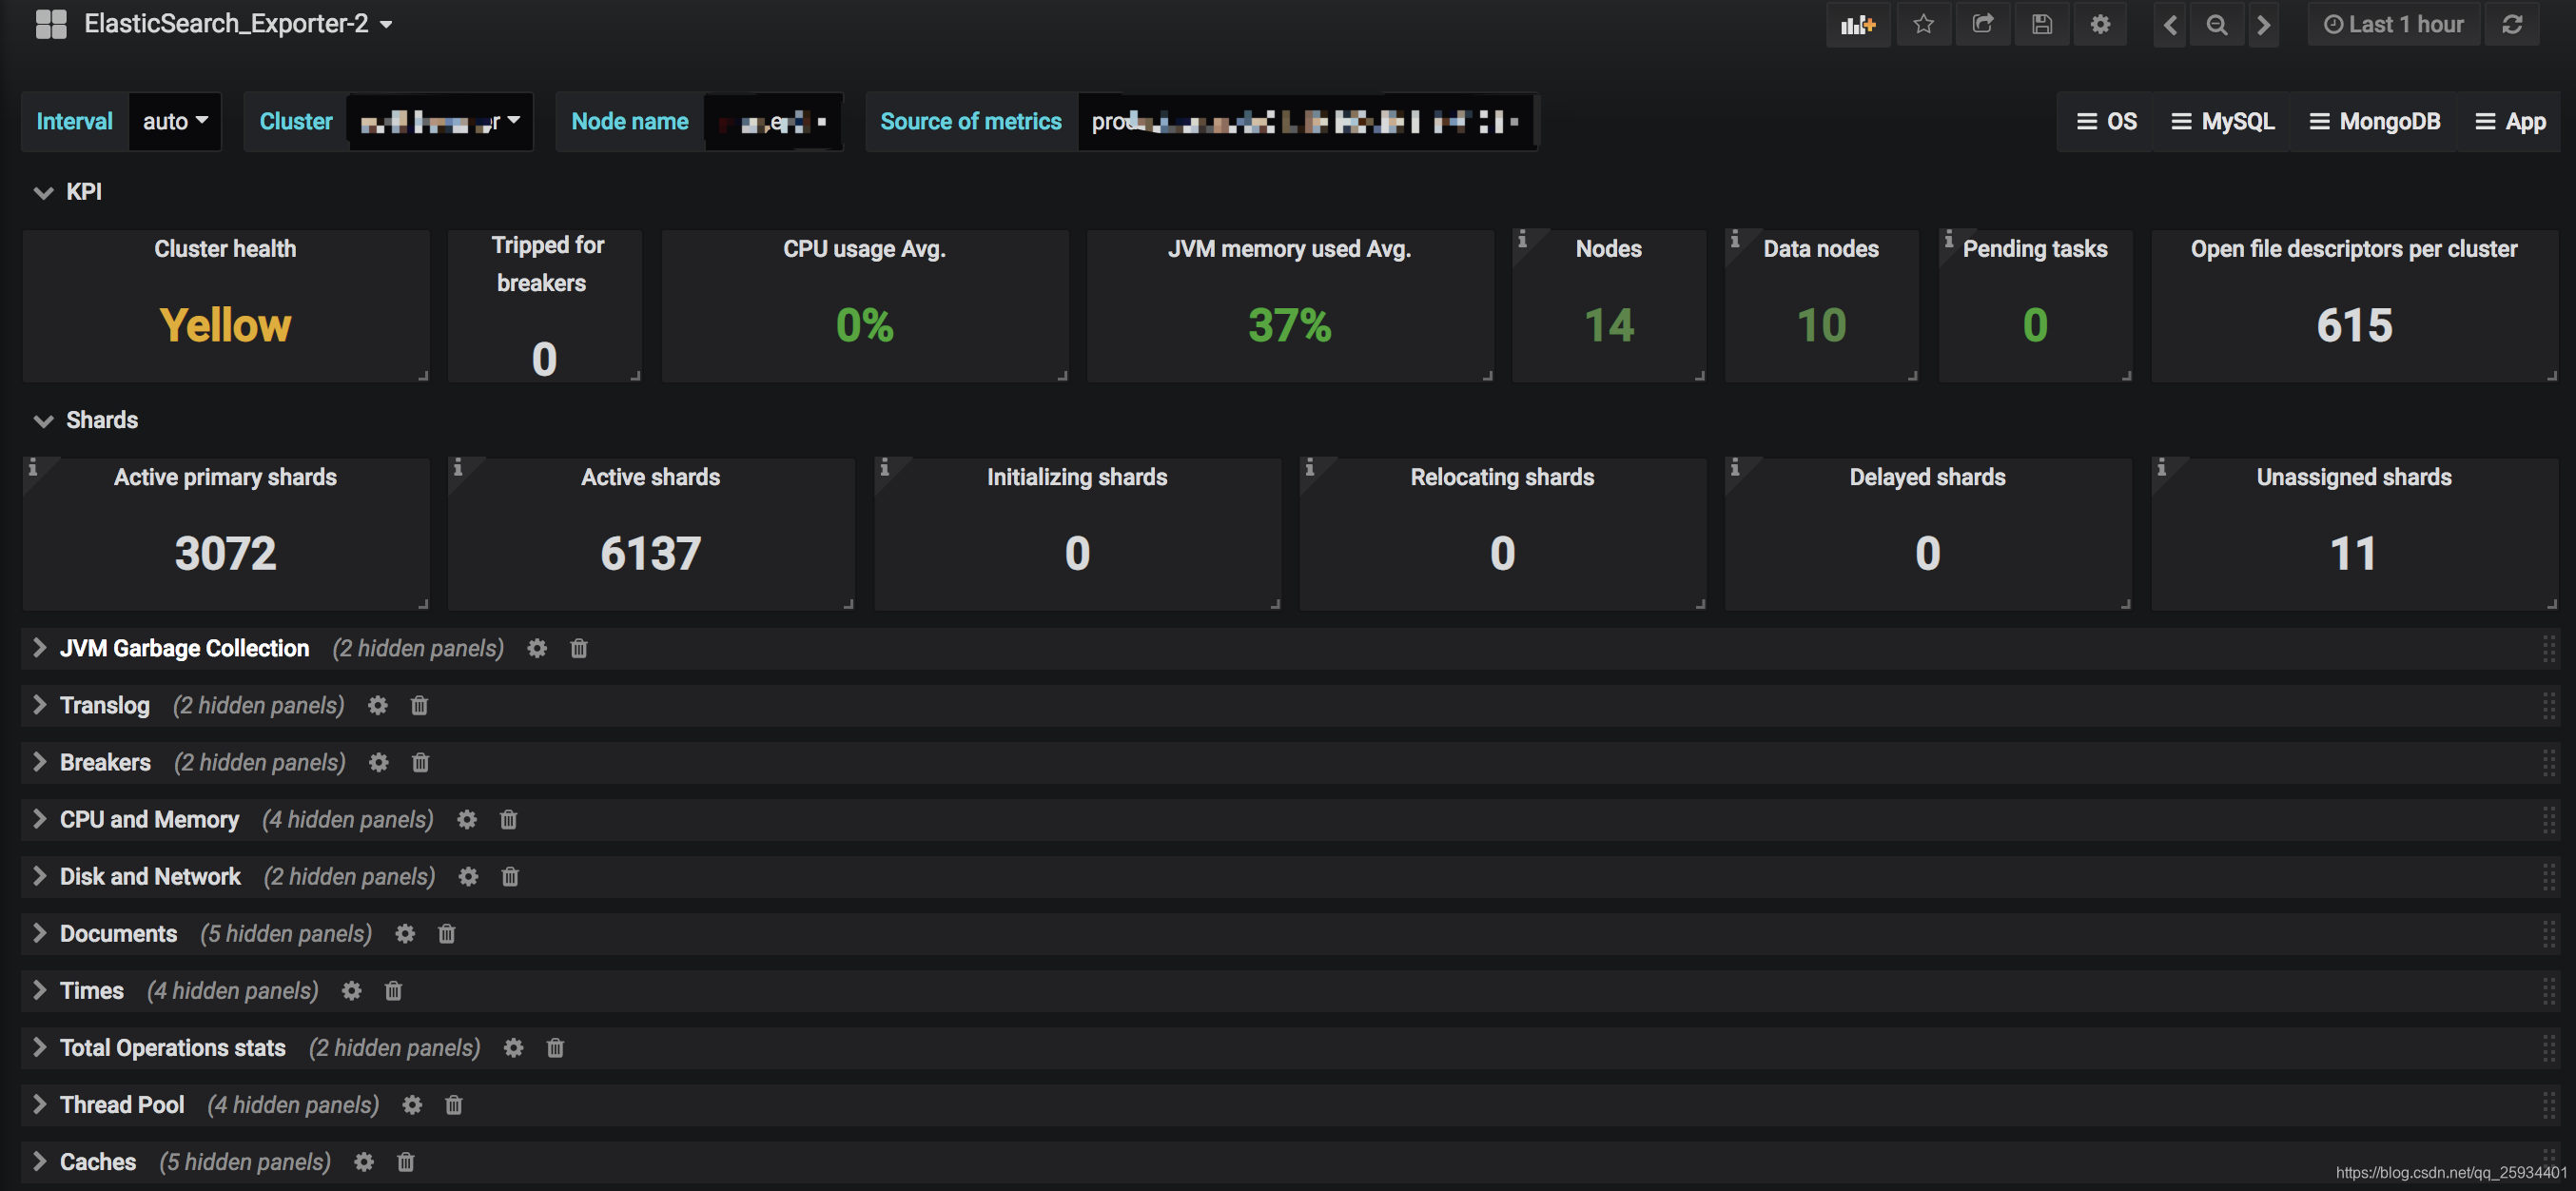
| ##索引请求 | |
| elasticsearch_indices_indexing_index_total | 索引的文件总数 |
| elasticsearch_indices_indexing_index_time_seconds_total | 索引文档总时间 |
| elasticsearch_indices_indexing_delete_total | 索引的文件删除总数 |
| elasticsearch_indices_indexing_delete_time_seconds_total | 索引的文件删除总时间 |
| elasticsearch_indices_refresh_total | 索引刷新总数 |
| elasticsearch_indices_refresh_time_seconds_total | 刷新指数的总时间 |
| elasticsearch_indices_flush_total | 索引刷新总数到磁盘 |
| elasticsearch_indices_flush_time_seconds | 将索引刷新到磁盘上的总时间 累计flush时间 |
| ##JVM内存和垃圾回收 | |
| elasticsearch_jvm_gc_collection_seconds_sum | GC run time in seconds垃圾回收时间 |
| elasticsearch_jvm_gc_collection_seconds_count | Count of JVM GC runs垃圾搜集数 |
| elasticsearch_jvm_memory_committed_bytes | JVM memory currently committed by area最大使用内存限制 |
| elasticsearch_jvm_memory_max_bytes | 配置的最大jvm值 |
| elasticsearch_jvm_memory_pool_max_bytes | JVM内存最大池数 |
| elasticsearch_jvm_memory_pool_peak_max_bytes | 最大的JVM内存峰值 |
| elasticsearch_jvm_memory_pool_peak_used_bytes | 池使用的JVM内存峰值 |
| elasticsearch_jvm_memory_pool_used_bytes | 目前使用的JVM内存池 |
| elasticsearch_jvm_memory_used_bytes | JVM memory currently used by area 内存使用量 |
| ##集群健康和节点可用性 | |
| elasticsearch_cluster_health_status | 集群状态,green( 所有的主分片和副本分片都正常运行)、yellow(所有的主分片都正常运行,但不是所有的副本分片都正常运行)red(有主分片没能正常运行)值为1的即为对应状态 |
| elasticsearch_cluster_health_number_of_data_nodes | node节点的数量 |
| elasticsearch_cluster_health_number_of_in_flight_fetch | 正在进行的碎片信息请求的数量 |
| elasticsearch_cluster_health_number_of_nodes | 集群内所有的节点 |
| elasticsearch_cluster_health_number_of_pending_tasks | 尚未执行的集群级别更改 |
| elasticsearch_cluster_health_initializing_shards | 正在初始化的分片数 |
| elasticsearch_cluster_health_unassigned_shards | 未分配分片数 |
| elasticsearch_cluster_health_active_primary_shards | 活跃的主分片总数 |
| elasticsearch_cluster_health_active_shards | 活跃的分片总数(包括复制分片) |
| elasticsearch_cluster_health_relocating_shards | 当前节点正在迁移到其他节点的分片数量,通常为0,集群中有节点新加入或者退出时该值会增加 |
| ##资源饱和度 | |
| elasticsearch_thread_pool_completed_count | 线程池操作完成(bulk、index、search、force_merge) |
| elasticsearch_thread_pool_active_count | 线程池线程活动(bulk、index、search、force_merge) |
| elasticsearch_thread_pool_largest_count | 线程池最大线程数(bulk、index、search、force_merge) |
| elasticsearch_thread_pool_queue_count | 线程池中的排队线程数(bulk、index、search、force_merge) |
| elasticsearch_thread_pool_rejected_count | 线程池的被拒绝线程数(bulk、index、search、force_merge) |
| elasticsearch_indices_fielddata_memory_size_bytes | fielddata缓存的大小(字节) |
| elasticsearch_indices_fielddata_evictions | 来自fielddata缓存的驱逐次数 |
| elasticsearch_indices_filter_cache_evictions | 来自过滤器缓存的驱逐次数(仅版本2.x) |
| elasticsearch_indices_filter_cache_memory_size_bytes | 过滤器高速缓存的大小(字节)(仅版本2.x) |
| elasticsearch_cluster_health_number_of_pending_tasks | 待处理任务数 |
| elasticsearch_indices_get_time_seconds | |
| elasticsearch_indices_get_missing_total | 丢失的文件的GET请求总数 |
| elasticsearch_indices_get_missing_time_seconds | 花费在文档丢失的GET请求上的总时间 |
| elasticsearch_indices_get_exists_time_seconds | |
| elasticsearch_indices_get_exists_total | |
| elasticsearch_indices_get_total | |
| #主机级别的系统和网络指标 | |
| elasticsearch_process_cpu_percent | Percent CPU used by process CPU使用率 |
| elasticsearch_filesystem_data_free_bytes | Free space on block device in bytes 磁盘可用空间 |
| elasticsearch_process_open_files_count | Open file descriptors ES进程打开的文件描述符 |
| elasticsearch_transport_rx_packets_total | Count of packets receivedES节点之间网络入流量 |
| elasticsearch_transport_tx_packets_total | Count of packets sentES节点之间网络出流量 |
预警rules
groups:
- name: elasticsearchStatsAlert
  rules:
  - alert: Elastic_Cluster_Health_RED
    expr: elasticsearch_cluster_health_status{color="red"}==1
    for: 1m
    labels:
      severity: critical
    annotations:
      summary: "Instance {{ $labels.instance }}: not all primary and replica shards are allocated in elasticsearch cluster {{ $labels.cluster }}"
      description: "Instance {{ $labels.instance }}: not all primary and replica shards are allocated in elasticsearch cluster {{ $labels.cluster }}."
  - alert: Elastic_Cluster_Health_Yellow
    expr: elasticsearch_cluster_health_status{color="yellow"}==1
    for: 1m
    labels:
      severity: critical
    annotations:
      summary: " Instance {{ $labels.instance }}: not all primary and replica shards are allocated in elasticsearch cluster {{ $labels.cluster }}"
      description: "Instance {{ $labels.instance }}: not all primary and replica shards are allocated in elasticsearch cluster {{ $labels.cluster }}."
  - alert: Elasticsearch_JVM_Heap_Too_High
    expr: elasticsearch_jvm_memory_used_bytes{area="heap"} / elasticsearch_jvm_memory_max_bytes{area="heap"} > 0.8
    for: 1m
    labels:
      severity: critical
    annotations:
      summary: "ElasticSearch node {{ $labels.instance }} heap usage is high "
      description: "The heap in {{ $labels.instance }} is over 80% for 15m."
  - alert: Elasticsearch_health_up
    expr: elasticsearch_cluster_health_up !=1
    for: 1m
    labels:
      severity: critical
    annotations:
      summary: " ElasticSearch node: {{ $labels.instance }} last scrape of the ElasticSearch cluster health failed"
      description: "ElasticSearch node: {{ $labels.instance }} last scrape of the ElasticSearch cluster health failed"
  - alert: Elasticsearch_Too_Few_Nodes_Running
    expr: elasticsearch_cluster_health_number_of_nodes < 12
    for: 1m
    labels:
      severity: critical
    annotations:
      summary: "There are only {{$value}} < 12 ElasticSearch nodes running "
      description: "lasticSearch running on less than 12 nodes(total 14)"
  - alert: Elasticsearch_Count_of_JVM_GC_Runs
    expr: rate(elasticsearch_jvm_gc_collection_seconds_count{}[5m])>5
    for: 1m
    labels:
      severity: critical
    annotations:
      summary: "ElasticSearch node {{ $labels.instance }}: Count of JVM GC runs > 5 per sec and has a value of {{ $value }} "
      description: "ElasticSearch node {{ $labels.instance }}: Count of JVM GC runs > 5 per sec and has a value of {{ $value }}"
  - alert: Elasticsearch_GC_Run_Time
    expr: rate(elasticsearch_jvm_gc_collection_seconds_sum[5m])>0.3
    for: 1m
    labels:
      severity: critical
    annotations:
      summary: " ElasticSearch node {{ $labels.instance }}: GC run time in seconds > 0.3 sec and has a value of {{ $value }}"
      description: "ElasticSearch node {{ $labels.instance }}: GC run time in seconds > 0.3 sec and has a value of {{ $value }}"
  - alert: Elasticsearch_json_parse_failures
    expr: elasticsearch_cluster_health_json_parse_failures>0
    for: 1m
    labels:
      severity: critical
    annotations:
      summary: " ElasticSearch node {{ $labels.instance }}: json parse failures > 0 and has a value of {{ $value }}"
      description: "ElasticSearch node {{ $labels.instance }}: json parse failures > 0 and has a value of {{ $value }}"
  - alert: Elasticsearch_breakers_tripped
    expr: rate(elasticsearch_breakers_tripped{}[5m])>0
    for: 1m
    labels:
      severity: critical
    annotations:
      summary: " ElasticSearch node {{ $labels.instance }}: breakers tripped > 0 and has a value of {{ $value }}"
      description: "ElasticSearch node {{ $labels.instance }}: breakers tripped > 0 and has a value of {{ $value }}"
  - alert: Elasticsearch_health_timed_out
    expr: elasticsearch_cluster_health_timed_out>0
    for: 1m
    labels:
      severity: critical
    annotations:
      summary: " ElasticSearch node {{ $labels.instance }}: Number of cluster health checks timed out > 0 and has a value of {{ $value }}"
      description: "ElasticSearch node {{ $labels.instance }}: Number of cluster health checks timed out > 0 and has a value of {{ $value }}"
prometheus 配置:
rule_files:
  - /usr/local/prometheus/rules/es*.rules
Grafana 画图
模版:链接:https://pan.baidu.com/s/1mAtVhko18gD4LxdSkuCGEg 密码:3mtd

网上学习资料一大堆,但如果学到的知识不成体系,遇到问题时只是浅尝辄止,不再深入研究,那么很难做到真正的技术提升。
一个人可以走的很快,但一群人才能走的更远!不论你是正从事IT行业的老鸟或是对IT行业感兴趣的新人,都欢迎加入我们的的圈子(技术交流、学习资源、职场吐槽、大厂内推、面试辅导),让我们一起学习成长!
术提升。**
一个人可以走的很快,但一群人才能走的更远!不论你是正从事IT行业的老鸟或是对IT行业感兴趣的新人,都欢迎加入我们的的圈子(技术交流、学习资源、职场吐槽、大厂内推、面试辅导),让我们一起学习成长!


 1508
1508

 被折叠的 条评论
为什么被折叠?
被折叠的 条评论
为什么被折叠?
 到【灌水乐园】发言


