


🎬 HoRain云小助手:个人主页
🔥 个人专栏: 《Linux 系列教程》《c语言教程》
⛺️生活的理想,就是为了理想的生活!
⛳️ 推荐
前些天发现了一个超棒的服务器购买网站,性价比超高,大内存超划算!忍不住分享一下给大家。点击跳转到网站。
专栏介绍
| 专栏名称 | 专栏介绍 |
| 本专栏主要撰写C干货内容和编程技巧,让大家从底层了解C,把更多的知识由抽象到简单通俗易懂。 | |
| 本专栏主要是注重从底层来给大家一步步剖析网络协议的奥秘,一起解密网络协议在运行中协议的基本运行机制! | |
| 全面深入解析 docker 容器,从基础到进阶,涵盖原理、操作、实践案例,助您精通 docker。 | |
| 本专栏主要撰写Linux干货内容,从基础到进阶,知识由抽象到简单通俗易懂,帮你从新手小白到扫地僧。 | |
| 本专栏着重撰写Python相关的干货内容与编程技巧,助力大家从底层去认识Python,将更多复杂的知识由抽象转化为简单易懂的内容。 | |
| 本专栏主要是发布一些考试和练习题库(涵盖软考、HCIE、HRCE、CCNA等) |
目录

折线图是排列在工作表的列或行中的数据可以绘制到折线图中。
折线图可以显示随时间(根据常用比例设置)而变化的连续数据,因此非常适用于显示在相等时间间隔下数据的趋势。
折线图 type 属性为 line ,type 描述了图表类型。
const config = {
type: 'line',
data: data,
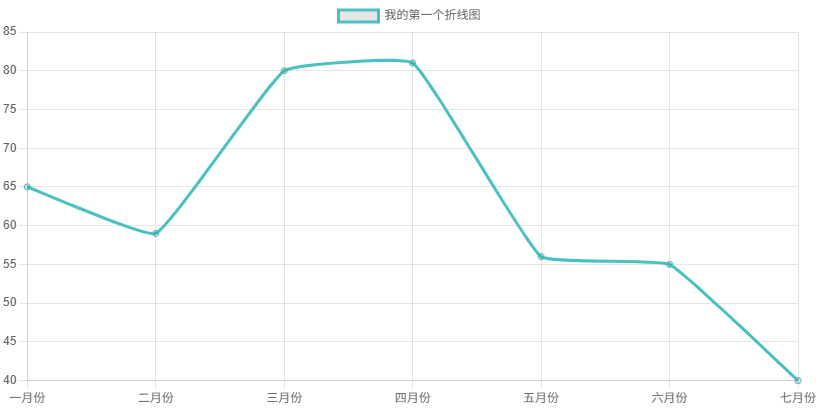
};接下来我们创建一个简单的折线图:
实例
const ctx = document.getElementById('myChart');
const labels = ['一月份', '二月份', '三月份','四月份', '五月份', '六月份', '七月份'];  // 设置 X 轴上对应的标签
const data = {
  labels: labels,
  datasets: [{
    label: '我的第一个折线图',
    data: [65, 59, 80, 81, 56, 55, 40],
    fill: false,
    borderColor: 'rgb(75, 192, 192)', // 设置线的颜色
    tension: 0.1
  }]
};
const config = {
  type: 'line', // 设置图表类型
  data: data,
};
const myChart = new Chart(ctx, config);
以上实例输出结果为:
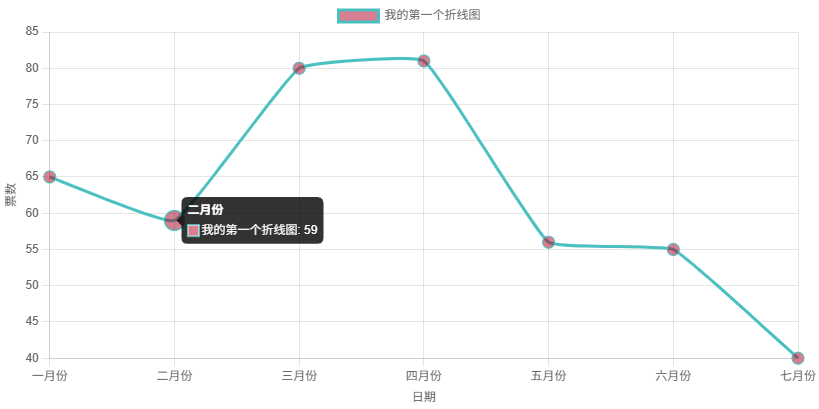
接下来我们丰富一下折线图,添加选项,设置如下:
实例
const ctx = document.getElementById('myChart');
const labels = ['一月份', '二月份', '三月份','四月份', '五月份', '六月份', '七月份'];  // 设置 X 轴上对应的标签
const data = {
  labels: labels,
  datasets: [{
    label: '我的第一个折线图',
    data: [65, 59, 80, 81, 56, 55, 40],
    fill: false,
    borderColor: 'rgb(75, 192, 192)', // 设置线的颜色
        backgroundColor: ['rgba(179, 0, 33, 0.5)'],// 设置点的填充色
        pointStyle: 'circle',     //设置点类型为圆点
    pointRadius: 6,    //设置圆点半径
    pointHoverRadius: 10, //设置鼠标移动上去后圆点半径
    tension: 0.1
  }]
};
const config = {
  type: 'line', // 设置图表类型
  data: data,
  options: {
    responsive: true,  // 设置图表为响应式

    interaction: {  // 设置每个点的交互
      intersect: false,
    },
    scales: {  // 设置 X 轴与 Y 轴
      x: {
        display: true,
        title: {
          display: true,
          text: '日期'
        }
      },
      y: {
        display: true,
        title: {
          display: true,
          text: '票数'
        }
      }
    }
  }
};
const myChart = new Chart(ctx, config);
以上实例输出结果为:
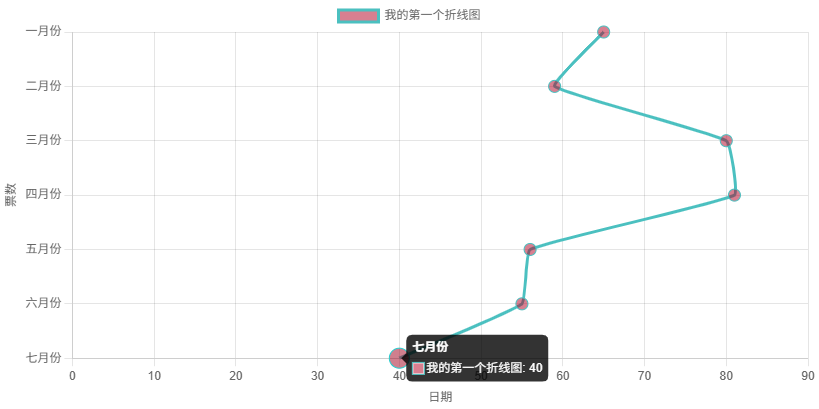
垂直折线图
垂直折线图是水平折线图的变体。
垂直折线图需要将选项对象中的 indexAxis 属性设置为 y,indexAxis 属性的默认值为 x。
实例
const ctx = document.getElementById('myChart');
const labels = ['一月份', '二月份', '三月份','四月份', '五月份', '六月份', '七月份'];  // 设置 X 轴上对应的标签
const data = {
  labels: labels,
  datasets: [{
    label: '我的第一个折线图',
    data: [65, 59, 80, 81, 56, 55, 40],
    fill: false,
    borderColor: 'rgb(75, 192, 192)', // 设置线的颜色
        backgroundColor: ['rgba(179, 0, 33, 0.5)'],// 设置点的填充色
        pointStyle: 'circle',     //设置点类型为圆点
    pointRadius: 6,    //设置圆点半径
    pointHoverRadius: 10, //设置鼠标移动上去后圆点半径
    tension: 0.1
  }]
};
const config = {
  type: 'line', // 设置图表类型
  data: data,
  options: {
    indexAxis: 'y', // 设置垂直折线图
    responsive: true,  // 设置图表为响应式

    interaction: {  // 设置每个点的交互
      intersect: false,
    },
    scales: {  // 设置 X 轴与 Y 轴
      x: {
                beginAtZero: true,// 设置 X 轴从 0 开始
        display: true,
        title: {
          display: true,
          text: '日期'
        }
      },
      y: {
        display: true,
        title: {
          display: true,
          text: '票数'
        }
      }
    }
  }
};
const myChart = new Chart(ctx, config);
以上实例输出结果为:
❤️❤️❤️本人水平有限,如有纰漏,欢迎各位大佬评论批评指正!😄😄😄
💘💘💘如果觉得这篇文对你有帮助的话,也请给个点赞、收藏下吧,非常感谢!👍 👍 👍
🔥🔥🔥Stay Hungry Stay Foolish 道阻且长,行则将至,让我们一起加油吧!🌙🌙🌙


 被折叠的 条评论
为什么被折叠?
被折叠的 条评论
为什么被折叠?
 到【灌水乐园】发言


