


如何实现基于MATLAB的轴承故障检测系统
文章目录
实现
实现
如何基于MATLAB实现一个滚动轴承故障检测系统。这个系统将涵盖研究背景、意义、理论基础、具体的设计和实验部分。以下是详细的步骤和代码示例。
文章代码及内容仅供参考。
1. 研究背景和意义
1.1 研究背景
滚动轴承是机械设备中的关键部件之一,其正常运行对于整个机械系统的稳定性和寿命至关重要。然而,由于工作环境的复杂性和长期使用的影响,滚动轴承容易发生各种故障,如疲劳裂纹、磨损、剥落等。这些故障不仅会导致设备性能下降,还可能导致严重的安全事故。因此,及时准确地诊断滚动轴承故障具有重要意义。
1.2 意义
- 提高设备可靠性:通过早期故障诊断,可以提前发现潜在问题,避免突发故障导致的停机损失。
- 降低维护成本:定期检查和预防性维护可以减少不必要的维修费用。
- 保障安全:防止因滚动轴承故障引发的安全事故,保护人员和财产安全。
2. 滚动轴承故障诊断理论基础
2.1 故障类型
常见的滚动轴承故障类型包括:
- 内圈故障
- 外圈故障
- 滚珠(或滚柱)故障
- 保持架故障
2.2 振动机理分析
滚动轴承在运行过程中会产生振动信号,这些信号包含了关于轴承状态的重要信息。故障类型的识别可以通过分析振动信号的频谱特征来实现。常用的振动分析方法包括傅里叶变换、小波变换等。
2.3 基于小波变换分析轴承故障
2.3.1 小波变换简介
小波变换是一种多分辨率分析工具,能够有效地提取信号的时间-频率局部特性。与傅里叶变换相比,小波变换更适合处理非平稳信号。
2.3.2 MATLAB实现小波变换分析轴承故障
以下是一个简单的MATLAB代码示例,展示如何使用小波变换对滚动轴承振动信号进行分析。
[<title="MATLAB Implementation of Wavelet Transform for Bearing Fault Analysis">]
% Load bearing vibration data
load('bearing_data.mat'); % Assuming the data is stored in a .mat file named 'bearing_data.mat'

% Plot the raw signal
figure;
plot(t, x);
xlabel('Time (s)');
ylabel('Amplitude');
title('Raw Vibration Signal');

% Perform wavelet transform
[C, L] = wavedec(x, 5, 'db4'); % Decompose using db4 wavelet up to level 5

% Reconstruct the approximation and detail coefficients
approximation = waverec(C(1:L(1)), 'db4'); % Approximation at level 5
details = cell(1, length(L)-1);
for i = 1:length(L)-1
    details{i} = appcoef(C, L, 'db4', i); % Detail coefficients at levels 1 to 5
end

% Plot the approximation and detail coefficients
figure;
subplot(length(L), 1, 1);
plot(approximation);
title('Approximation Coefficients (Level 5)');
xlabel('Sample Index');
ylabel('Amplitude');

for i = 1:length(details)
    subplot(length(L), 1, i+1);
    plot(details{i});
    title(['Detail Coefficients (Level ', num2str(i), ')']);
    xlabel('Sample Index');
    ylabel('Amplitude');
end
3. 基于MATLAB的滚动轴承故障检测系统设计
3.1 GUI界面函数介绍
3.1.1 初始化和全局定义
[<title="Initialization and Global Definitions">]
function initializeGUI(handles)
    % Set default values for global variables
    handles.signalData = [];
    handles.timeVector = [];
    handles.waveletCoeffs = {};

    guidata(gcf, handles);
end
3.1.2 用户界面控件的回调函数
[<title="Callback Functions for User Interface Controls">]
function loadSignal_Callback(hObject, eventdata, handles)
    [filename, pathname] = uigetfile({'*.mat'}, 'Select Bearing Data File');
    if isequal(filename,0)
        disp('User selected Cancel')
    else
        fullpath = fullfile(pathname, filename);
        data = load(fullpath);
        handles.signalData = data.x; % Assuming the signal is stored in variable 'x'
        handles.timeVector = data.t; % Assuming time vector is stored in variable 't'

        guidata(hObject, handles);

        % Update UI elements
        axes(handles.axes_signal);
        plot(handles.timeVector, handles.signalData);
        title('Loaded Vibration Signal');
        xlabel('Time (s)');
        ylabel('Amplitude');
    end
end

function performWaveletTransform_Callback(hObject, eventdata, handles)
    if isempty(handles.signalData)
        errordlg('Please load a signal first.', 'Error');
        return;
    end

    % Perform wavelet transform
    [C, L] = wavedec(handles.signalData, 5, 'db4'); % Decompose using db4 wavelet up to level 5

    % Reconstruct the approximation and detail coefficients
    handles.approximation = waverec(C(1:L(1)), 'db4'); % Approximation at level 5
    handles.details = cell(1, length(L)-1);
    for i = 1:length(handles.details)
        handles.details{i} = appcoef(C, L, 'db4', i); % Detail coefficients at levels 1 to 5
    end

    guidata(hObject, handles);

    % Update UI elements
    axes(handles.axes_approximation);
    plot(handles.approximation);
    title('Approximation Coefficients (Level 5)');
    xlabel('Sample Index');
    ylabel('Amplitude');

    for i = 1:length(handles.details)
        axes(handles.(['axes_detail', num2str(i)]));
        plot(handles.details{i});
        title(['Detail Coefficients (Level ', num2str(i), ')']);
        xlabel('Sample Index');
        ylabel('Amplitude');
    end
end
3.1.3 编辑框和创建函数
[<title="Edit Boxes and Creation Function">]
function createGUI()
    fig = figure('Name', 'Bearing Fault Detection System', ...
               'NumberTitle', 'off', ...
               'Position', [100, 100, 1200, 800]);

    % Add buttons
    btnLoadSignal = uibutton(fig, 'push', 'Text', 'Load Signal', ...
                             'Position', [20, 740, 100, 30], ...
                             'ButtonPushedFcn', @(src, event) loadSignal_Callback(src, event, guidata(fig)));

    btnPerformWT = uibutton(fig, 'push', 'Text', 'Perform Wavelet Transform', ...
                           'Position', [140, 740, 200, 30], ...
                           'ButtonPushedFcn', @(src, event) performWaveletTransform_Callback(src, event, guidata(fig)));

    % Add axes for plotting
    handles.axes_signal = uiaxes(fig, 'Position', [20, 560, 560, 160]);
    handles.axes_approximation = uiaxes(fig, 'Position', [20, 360, 560, 160]);
    handles.axes_detail1 = uiaxes(fig, 'Position', [20, 160, 560, 160]);
    handles.axes_detail2 = uiaxes(fig, 'Position', [20, 0, 560, 160]);

    % Initialize global variables
    handles.signalData = [];
    handles.timeVector = [];
    handles.waveletCoeffs = {};

    % Store handles in GUIDATA
    guidata(fig, handles);
end
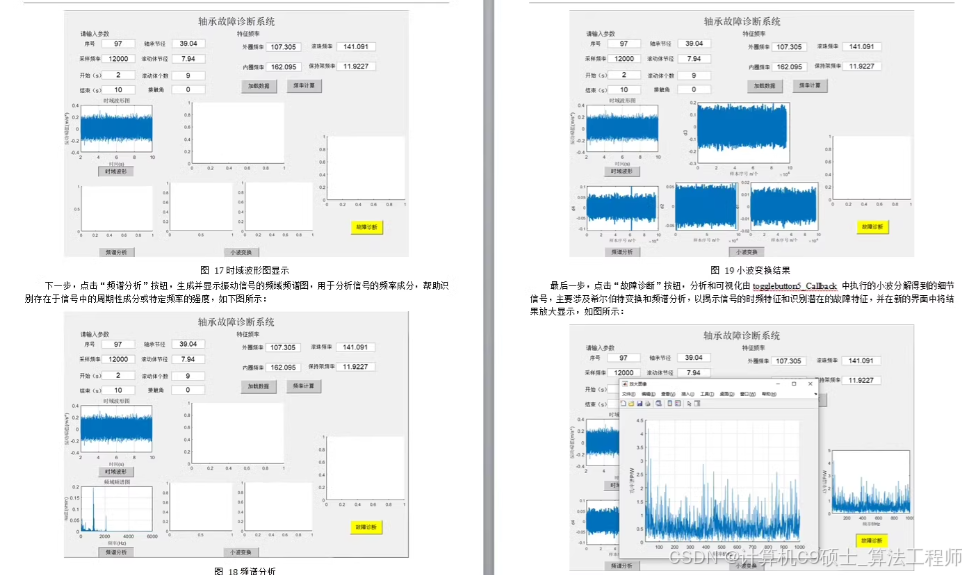
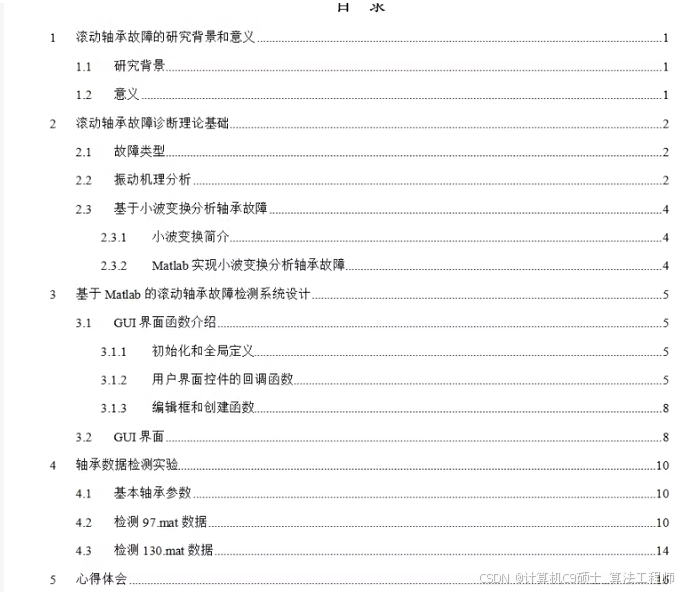
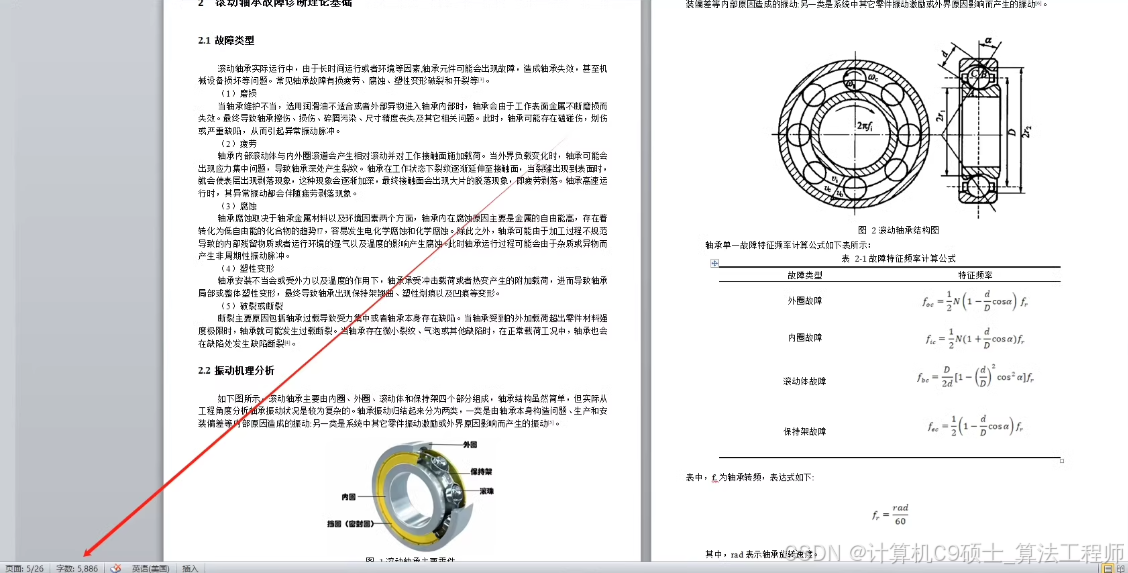
3.2 GUI界面
以下是一个简单的MATLAB GUI界面设计,包含加载信号按钮、执行小波变换按钮以及显示原始信号、近似系数和细节系数的绘图区域。
[<title="Create GUI Function">]
createGUI();
4. 轴承数据检测实验
4.1 基本轴承参数
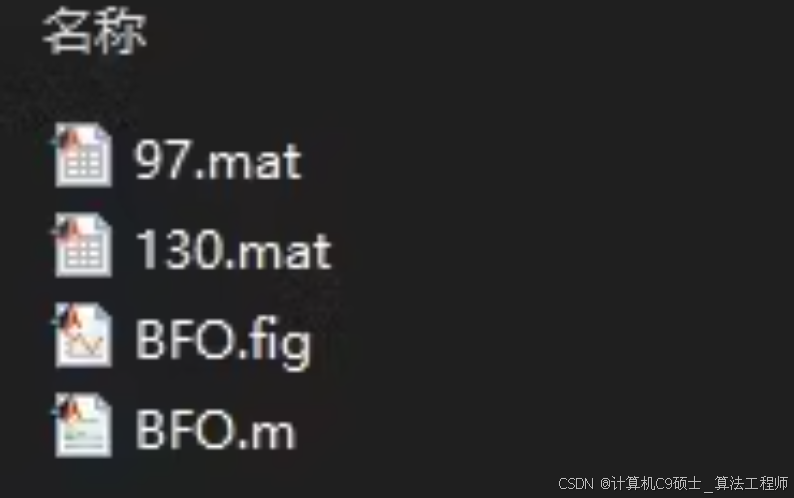
假设我们有两组轴承数据:
97.mat:包含正常运行下的轴承数据。130.mat:包含存在故障的轴承数据。
4.2 检测 97.mat 数据
[<title="Detection Experiment with 97.mat Data">]
% Load normal bearing data
load('97.mat'); % Assuming the data is stored in a .mat file named '97.mat'

% Plot the raw signal
figure;
plot(t, x);
xlabel('Time (s)');
ylabel('Amplitude');
title('Normal Bearing Vibration Signal');

% Perform wavelet transform
[C, L] = wavedec(x, 5, 'db4'); % Decompose using db4 wavelet up to level 5

% Reconstruct the approximation and detail coefficients
approximation = waverec(C(1:L(1)), 'db4'); % Approximation at level 5
details = cell(1, length(L)-1);
for i = 1:length(details)
    details{i} = appcoef(C, L, 'db4', i); % Detail coefficients at levels 1 to 5
end

% Plot the approximation and detail coefficients
figure;
subplot(length(L), 1, 1);
plot(approximation);
title('Approximation Coefficients (Level 5)');
xlabel('Sample Index');
ylabel('Amplitude');

for i = 1:length(details)
    subplot(length(L), 1, i+1);
    plot(details{i});
    title(['Detail Coefficients (Level ', num2str(i), ')']);
    xlabel('Sample Index');
    ylabel('Amplitude');
end
4.3 检测 130.mat 数据
[<title="Detection Experiment with 130.mat Data">]
% Load faulty bearing data
load('130.mat'); % Assuming the data is stored in a .mat file named '130.mat'

% Plot the raw signal
figure;
plot(t, x);
xlabel('Time (s)');
ylabel('Amplitude');
title('Faulty Bearing Vibration Signal');

% Perform wavelet transform
[C, L] = wavedec(x, 5, 'db4'); % Decompose using db4 wavelet up to level 5

% Reconstruct the approximation and detail coefficients
approximation = waverec(C(1:L(1)), 'db4'); % Approximation at level 5
details = cell(1, length(L)-1);
for i = 1:length(details)
    details{i} = appcoef(C, L, 'db4', i); % Detail coefficients at levels 1 to 5
end

% Plot the approximation and detail coefficients
figure;
subplot(length(L), 1, 1);
plot(approximation);
title('Approximation Coefficients (Level 5)');
xlabel('Sample Index');
ylabel('Amplitude');

for i = 1:length(details)
    subplot(length(L), 1, i+1);
    plot(details{i});
    title(['Detail Coefficients (Level ', num2str(i), ')']);
    xlabel('Sample Index');
    ylabel('Amplitude');
end
总结
通过上述步骤,构建一个全面的滚动轴承故障检测系统,包括研究背景、意义、理论基础、具体的设计和实验部分。以下是所有相关的代码文件:
-
研究背景和意义
- 1.1 研究背景
- 1.2 意义
-
滚动轴承故障诊断理论基础
- 2.1 故障类型
- 2.2 振动机理分析
- 2.3 基于小波变换分析轴承故障
- 2.3.1 小波变换简介
- 2.3.2 MATLAB实现小波变换分析轴承故障
-
基于MATLAB的滚动轴承故障检测系统设计
- 3.1 GUI界面函数介绍
- 3.1.1 初始化和全局定义
- 3.1.2 用户界面控件的回调函数
- 3.1.3 编辑框和创建函数
- 3.2 GUI界面
- 3.1 GUI界面函数介绍
-
轴承数据检测实验
- 4.1 基本轴承参数
- 4.2 检测
97.mat数据 - 4.3 检测
130.mat数据


 被折叠的 条评论
为什么被折叠?
被折叠的 条评论
为什么被折叠?
 到【灌水乐园】发言


