


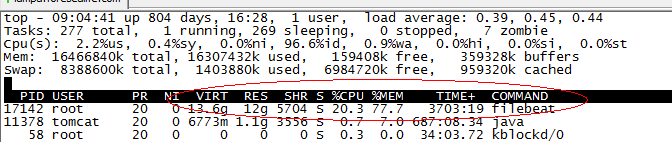
当filebeat运行了几个月之后,占用了超过10个G的内存
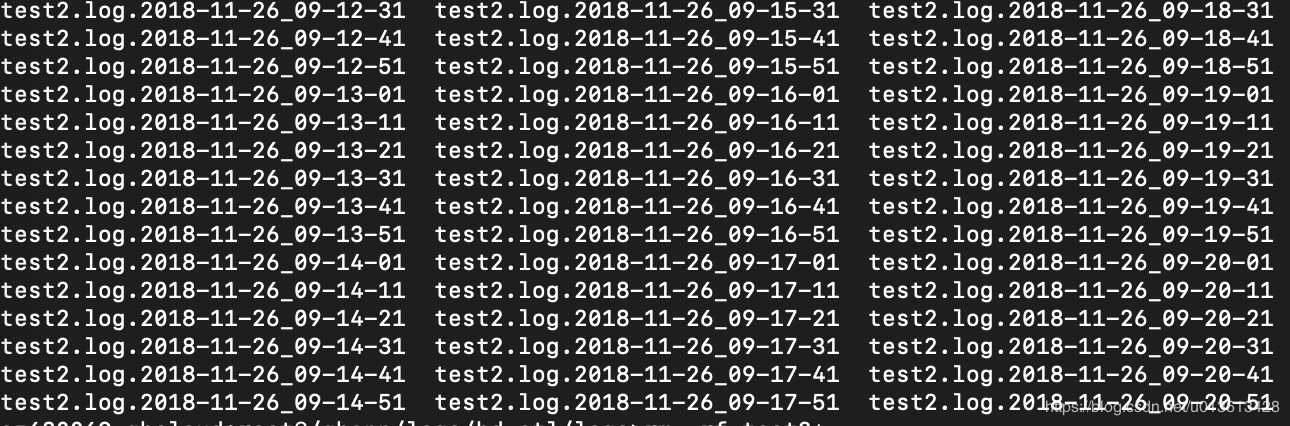
非常频繁的rotate日志
另一个可能是,filebeat只配置监控了一个文件,比如test2.log,但由于test2.log不停的rotate出新的文件,虽然没有使用通配符采集该目录下的所有文件,但因为linux系统是使用inode number来唯一标示文件的,rotate出来的新文件并没有改变其inode number,因此,时间上filebeat还是同时开启了对多个文件的监控。
另外,因为对文件进行rotate的时候,一般会限制rotate的个数,即到达一定数量时,新rotate一个文件,必然会删除一个旧的文件,文件删除之后,inode number是可以复用的,如果不巧,新rotate出来的文件被分配了一个之前已删掉文件的inode number,而此时filebeat还没有监测之前持有该inode number的文件已删除,则会抛出以下异常:
2018-11-21T18:06:55+08:00 ERR Harvester could not be started on truncated file: /qhapp/logs/bd-etl/logs/test2.log, Err: Error setting up harvester: Harvester setup failed. Unexpected file opening error: file info is not identical with opened file. Aborting harvesting and retrying file later again
而类似Harvester setup failed.的异常会导致内存泄漏
https://github.com/elastic/beats/issues/6797
因为multiline导致内存占用过多
multiline.pattern: '^[[:space:]]+|^Caused by:|^.+Exception:|^\d+\serror,比如这个配置,认为空格或者制表符开头的line是上一行的附加内容,需要作为多行模式,存储到同一个event当中。当你监控的文件刚巧在文件的每一行带有一个空格时,会错误的匹配多行,造成filebeat解析过后,单条event的行数达到了上千行,大小达到了10M,并且在这过程中使用的是正则表达式,每一条event的处理都会极大的消耗内存。因为大多数的filebeat output是需应答的,buffer这些event必然会大量的消耗内存。
模拟场景
这里不多说,简单来一段python的代码:
[loggers]
keys=root

[handlers]
keys=NormalHandler

[formatters]
keys=formatter

[logger_root]
level=DEBUG
handlers=NormalHandler

[handler_NormalHandler]
class=logging.handlers.TimedRotatingFileHandler
formatter=formatter
args=('./test2.log', 'S', 10, 200)

[formatter_formatter]
format=%(asctime)s %(filename)s[line:%(lineno)d] %(levelname)s %(message)s
以上,每隔10秒(‘S’, ‘M’ = 分钟,‘D’= 天)rotate一个文件,一共可以rotate 200个文件。 然后,随便找一段日志,不停的打,以下是330条/秒
import logging
from logging.config import fileConfig
import os
import time
CURRENT_FOLDER = os.path.dirname(os.path.realpath(__file__))

fileConfig(CURRENT_FOLDER + '/logging.ini')
logger = logging.getLogger()

while True:
    logger.debug("DEBUG 2018-11-26 09:31:35 com.sunyard.insurance.server.GetImage 43 - 资源请求:date=20181126&file_name=/imagedata/imv2/pool1/images/GXTB/2017/11/14/57/06b6bcdd31763b70b20f56c689e51f5e_1/06b6bcdd31763b70b20f56c689e51f5e_2.syd&file_encrypt=0&token=HUtGGG20GH4GAqq209R9tc9UGtAURR0b DEBUG 2018-11-26 09:31:40 com.sunyard.insurance.scheduler.job.DbEroorHandleJob 26 - [数据库操作异常处理JOB]处理异常文件,本机不运行,退出任务!")
    logger.debug("DEBUG 2018-11-26 09:31:35 com.sunyard.insurance.server.GetImage 43 - 资源请求:date=20181126&file_name=/imagedata/imv2/pool1/images/GXTB/2017/11/14/57/06b6bcdd31763b70b20f56c689e51f5e_1/06b6bcdd31763b70b20f56c689e51f5e_2.syd&file_encrypt=0&token=HUtGGG20GH4GAqq209R9tc9UGtAURR0b DEBUG 2018-11-26 09:31:40 com.sunyard.insurance.scheduler.job.DbEroorHandleJob 26 - [数据库操作异常处理JOB]处理异常文件,本机不运行,退出任务!")
    logger.debug("DEBUG 2018-11-26 09:31:35 com.sunyard.insurance.server.GetImage 43 - 资源请求:date=20181126&file_name=/imagedata/imv2/pool1/images/GXTB/2017/11/14/57/06b6bcdd31763b70b20f56c689e51f5e_1/06b6bcdd31763b70b20f56c689e51f5e_2.syd&file_encrypt=0&token=HUtGGG20GH4GAqq209R9tc9UGtAURR0b DEBUG 2018-11-26 09:31:40 com.sunyard.insurance.scheduler.job.DbEroorHandleJob 26 - [数据库操作异常处理JOB]处理异常文件,本机不运行,退出任务!")
    logger.debug("DEBUG 2018-11-26 09:31:35 com.sunyard.insurance.server.GetImage 43 - 资源请求:date=20181126&file_name=/imagedata/imv2/pool1/images/GXTB/2017/11/14/57/06b6bcdd31763b70b20f56c689e51f5e_1/06b6bcdd31763b70b20f56c689e51f5e_2.syd&file_encrypt=0&token=HUtGGG20GH4GAqq209R9tc9UGtAURR0b DEBUG 2018-11-26 09:31:40 com.sunyard.insurance.scheduler.job.DbEroorHandleJob 26 - [数据库操作异常处理JOB]处理异常文件,本机不运行,退出任务!")
    logger.debug("DEBUG 2018-11-26 09:31:35 com.sunyard.insurance.server.GetImage 43 - 资源请求:date=20181126&file_name=/imagedata/imv2/pool1/images/GXTB/2017/11/14/57/06b6bcdd31763b70b20f56c689e51f5e_1/06b6bcdd31763b70b20f56c689e51f5e_2.syd&file_encrypt=0&token=HUtGGG20GH4GAqq209R9tc9UGtAURR0b DEBUG 2018-11-26 09:31:40 com.sunyard.insurance.scheduler.job.DbEroorHandleJob 26 - [数据库操作异常处理JOB]处理异常文件,本机不运行,退出任务!")
    logger.debug("DEBUG 2018-11-26 09:31:35 com.sunyard.insurance.server.GetImage 43 - 资源请求:date=20181126&file_name=/imagedata/imv2/pool1/images/GXTB/2017/11/14/57/06b6bcdd31763b70b20f56c689e51f5e_1/06b6bcdd31763b70b20f56c689e51f5e_2.syd&file_encrypt=0&token=HUtGGG20GH4GAqq209R9tc9UGtAURR0b DEBUG 2018-11-26 09:31:40 com.sunyard.insurance.scheduler.job.DbEroorHandleJob 26 - [数据库操作异常处理JOB]处理异常文件,本机不运行,退出任务!")
    logger.debug("DEBUG 2018-11-26 09:31:35 com.sunyard.insurance.server.GetImage 43 - 资源请求:date=20181126&file_name=/imagedata/imv2/pool1/images/GXTB/2017/11/14/57/06b6bcdd31763b70b20f56c689e51f5e_1/06b6bcdd31763b70b20f56c689e51f5e_2.syd&file_encrypt=0&token=HUtGGG20GH4GAqq209R9tc9UGtAURR0b DEBUG 2018-11-26 09:31:40 com.sunyard.insurance.scheduler.job.DbEroorHandleJob 26 - [数据库操作异常处理JOB]处理异常文件,本机不运行,退出任务!")
    logger.debug("DEBUG 2018-11-26 09:31:35 com.sunyard.insurance.server.GetImage 43 - 资源请求:date=20181126&file_name=/imagedata/imv2/pool1/images/GXTB/2017/11/14/57/06b6bcdd31763b70b20f56c689e51f5e_1/06b6bcdd31763b70b20f56c689e51f5e_2.syd&file_encrypt=0&token=HUtGGG20GH4GAqq209R9tc9UGtAURR0b DEBUG 2018-11-26 09:31:40 com.sunyard.insurance.scheduler.job.DbEroorHandleJob 26 - [数据库操作异常处理JOB]处理异常文件,本机不运行,退出任务!")
    logger.debug("DEBUG 2018-11-26 09:31:35 com.sunyard.insurance.server.GetImage 43 - 资源请求:date=20181126&file_name=/imagedata/imv2/pool1/images/GXTB/2017/11/14/57/06b6bcdd31763b70b20f56c689e51f5e_1/06b6bcdd31763b70b20f56c689e51f5e_2.syd&file_encrypt=0&token=HUtGGG20GH4GAqq209R9tc9UGtAURR0b DEBUG 2018-11-26 09:31:40 com.sunyard.insurance.scheduler.job.DbEroorHandleJob 26 - [数据库操作异常处理JOB]处理异常文件,本机不运行,退出任务!")
    logger.debug("DEBUG 2018-11-26 09:31:35 com.sunyard.insurance.server.GetImage 43 - 资源请求:date=20181126&file_name=/imagedata/imv2/pool1/images/GXTB/2017/11/14/57/06b6bcdd31763b70b20f56c689e51f5e_1/06b6bcdd31763b70b20f56c689e51f5e_2.syd&file_encrypt=0&token=HUtGGG20GH4GAqq209R9tc9UGtAURR0b DEBUG 2018-11-26 09:31:40 com.sunyard.insurance.scheduler.job.DbEroorHandleJob 26 - [数据库操作异常处理JOB]处理异常文件,本机不运行,退出任务!!@#!@#!@#!@#!@#!@#!@#!@#!@#!@#!@#!#@!!!@##########################################################################################################################################################")
    time.sleep(0.03)
如何观察filebeat的内存
在6.3版本之前,我们是无法通过xpack的monitoring功能来观察beats套件的性能的。因此,这里讨论的是没有monitoring时,我们如何去检测filebeat的性能。当然,简单的方法是通过top,ps等操作系统的命令进行查看,但这些都是实时的,无法做趋势的观察,并且都是进程级别的,无法看到filebeat内部的真是情况。因此,这里介绍如何通过filebeat的日志和pprof这个工具来观察内存的使用情况
通过filebeat的日志
filebeat文件解读
其实filebeat的日志,已经包含了很多参数用于实时观测filebeat的资源使用情况,以下是filebeat的一个日志片段(这里的日志片段是6.0版本的,6.3版本之后,整个日志格式变了,从kv格式变成了json对象格式,xpack可以直接通过日志进行filebeat的monitoring):
2018-11-02T17:40:01+08:00 INFO Non-zero metrics in the last 30s: beat.memstats.gc_next=623475680 beat.memstats.memory_alloc=391032232 beat.memstats.memory_total=155885103371024 filebeat.events.active=-402 filebeat.events.added=13279 filebeat.events.done=13681 filebeat.harvester.closed=1 filebeat.harvester.open_files=7 filebeat.harvester.running=7 filebeat.harvester.started=2 libbeat.config.module.running=0 libbeat.output.events.acked=13677 libbeat.output.events.batches=28 libbeat.output.events.total=13677 libbeat.outputs.kafka.bytes_read=12112 libbeat.outputs.kafka.bytes_write=1043381 libbeat.pipeline.clients=1 libbeat.pipeline.events.active=0 libbeat.pipeline.events.filtered=4 libbeat.pipeline.events.published=13275 libbeat.pipeline.events.total=13279 libbeat.pipeline.queue.acked=13677 registrar.states.cleanup=1 registrar.states.current=8 registrar.states.update=13681 registrar.writes=28
里面的参数主要分成三个部分:
beat.*,包含memstats.gc_next,memstats.memory_alloc,memstats.memory_total,这个是所有beat组件都有的指标,是filebeat继承来的,主要是内存相关的,我们这里特别关注memstats.memory_alloc,alloc的越多,占用内存越大filebeat.*,这部分是filebeat特有的指标,通过event相关的指标,我们知道吞吐,通过harvester,我们知道正在监控多少个文件,未消费event堆积的越多,havester创建的越多,消耗内存越大libbeat.*,也是beats组件通用的指标,包含outputs和pipeline等信息。这里要主要当outputs发生阻塞的时候,会直接影响queue里面event的消费,造成内存堆积registrar,filebeat将监控文件的状态放在registry文件里面,当监控文件非常多的时候,比如10万个,而且没有合理的设置close_inactive参数,这个文件能达到100M,载入内存后,直接占用内存
filebeat日志解析
当然,我们不可能直接去读这个日志,既然我们使用ELK,肯定是用ELK进行解读。因为是kv格式,很方便,用logstash的kv plugin:
filter {
  kv {}
}
kv无法指定properties的type,所以,我们需要稍微指定了一下索引的模版:
PUT _template/template_1
{
  "index_patterns": ["filebeat*"],
  "settings": {
    "number_of_shards": 1
  },
  "mappings": {
    "doc": {
      "_source": {
        "enabled": false
      },
      "dynamic_templates": [
        {
          "longs_as_strings": {
            "match_mapping_type": "string",
            "path_match":   "*beat.*",
            "path_unmatch": "*.*name",
            "mapping": {
              "type": "long"
            }
          }
        }
      ]
    }
  }
}
上面的模版,将kv解析出的properties都mapping到long类型,但注意"path_match": "*beat.*"无法match到registrar的指标,读者可以自己写一个更完善的mapping。 这样,我们就可以通过kibana可视化组件,清楚的看到内存泄漏的过程
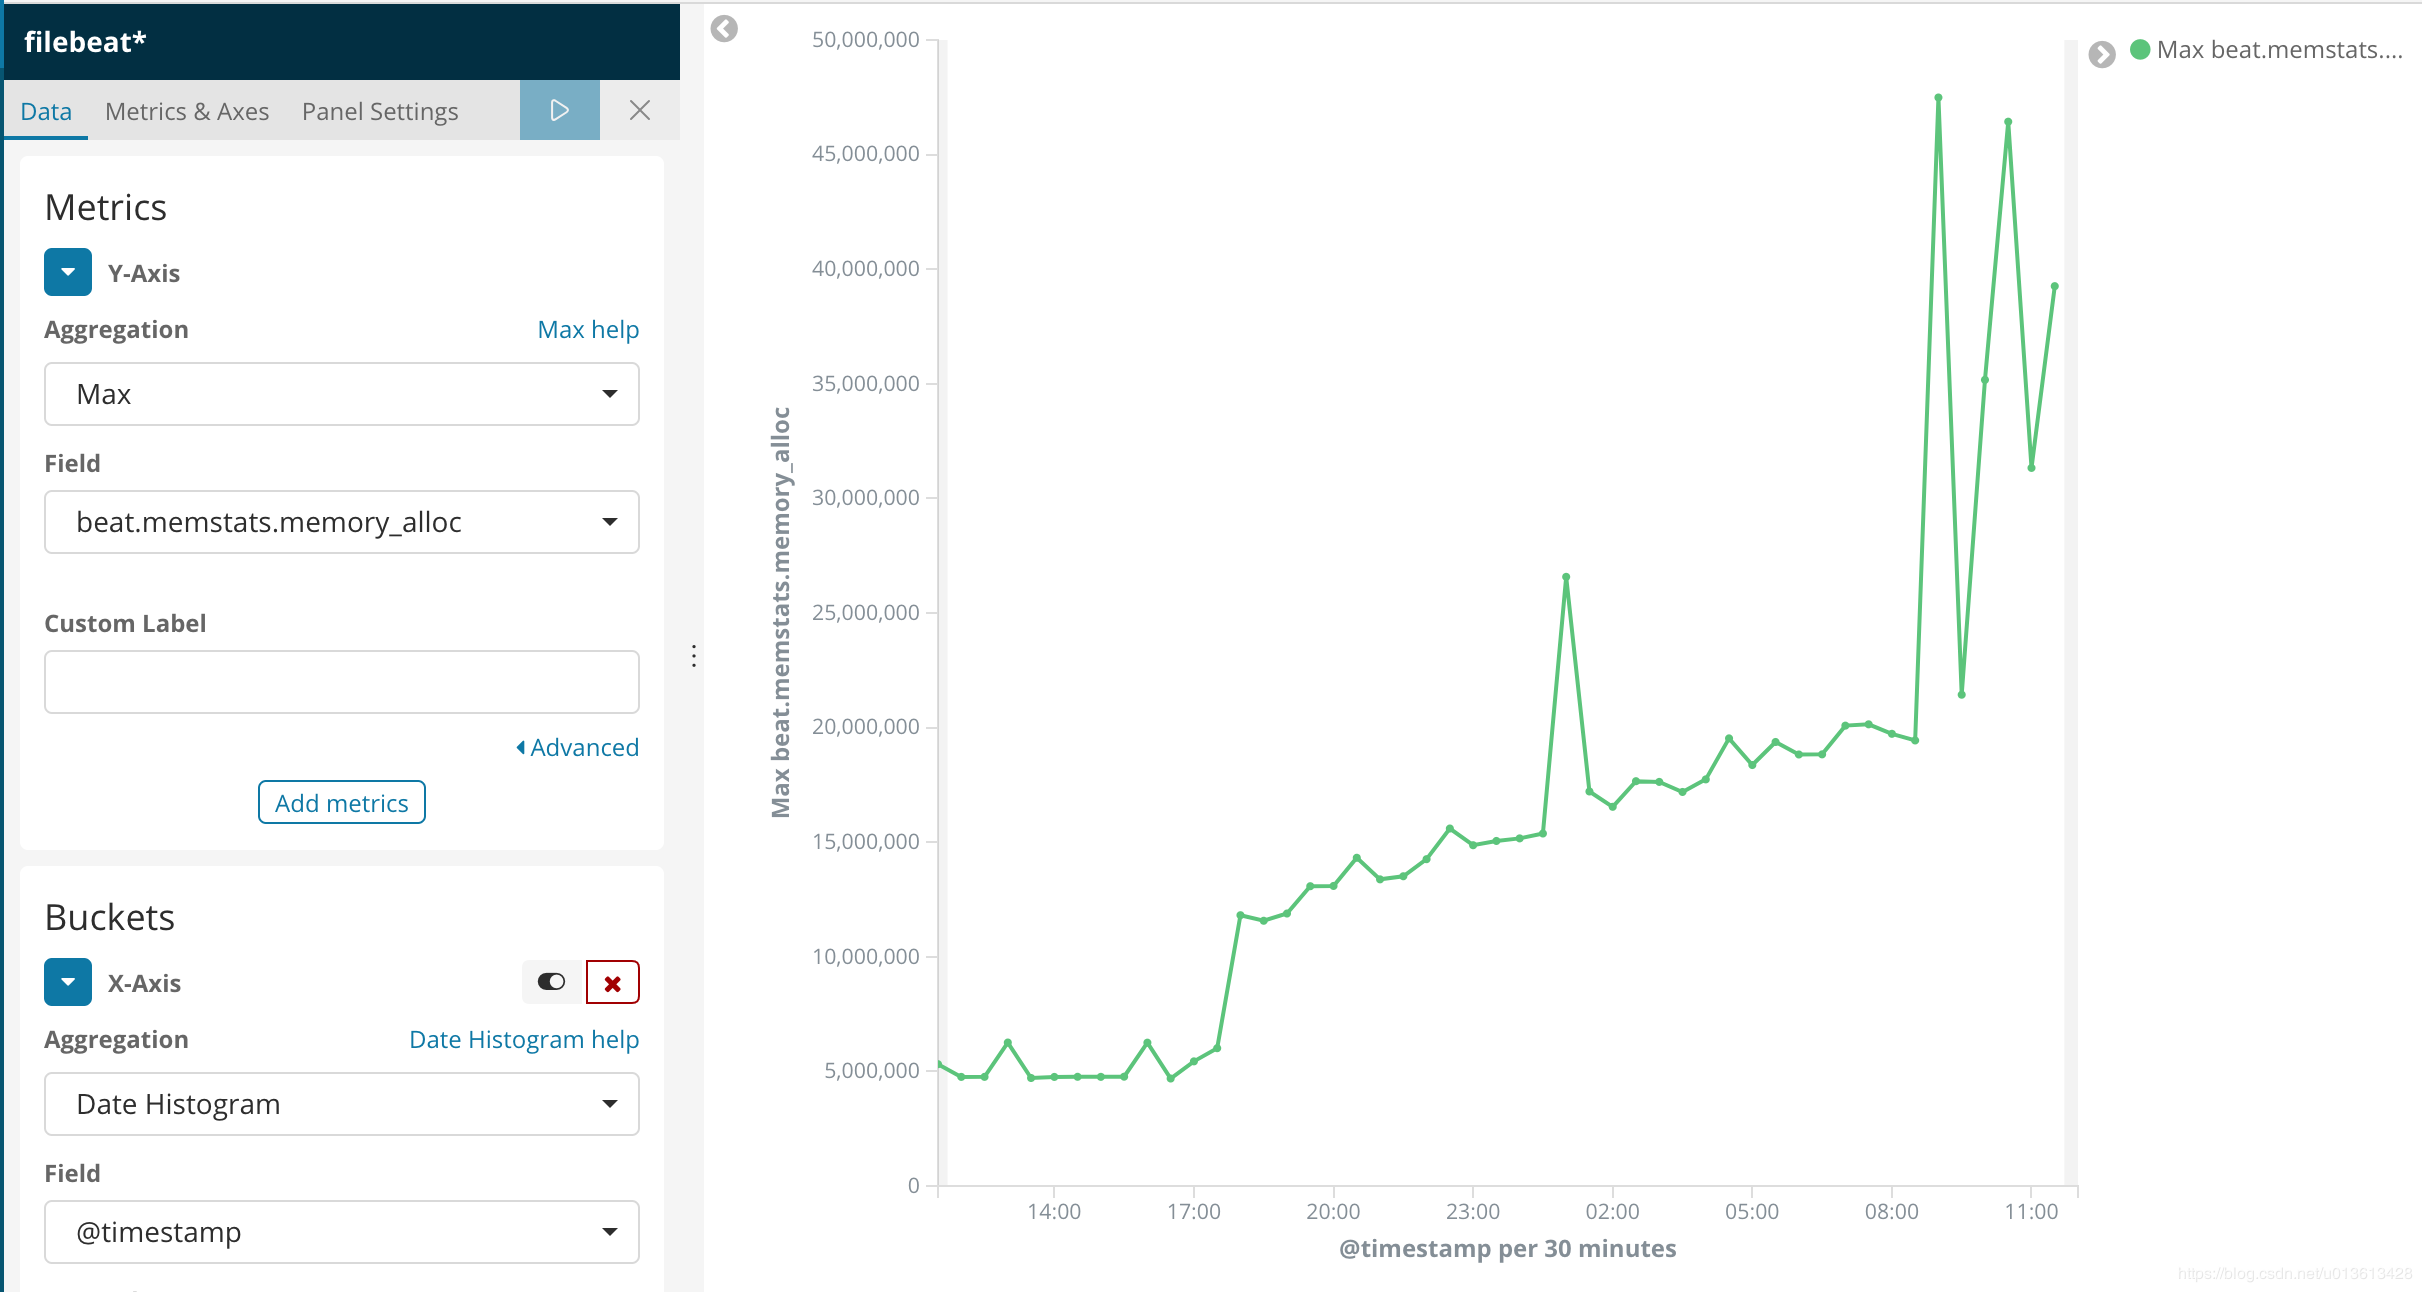
以及资源的使用情况:
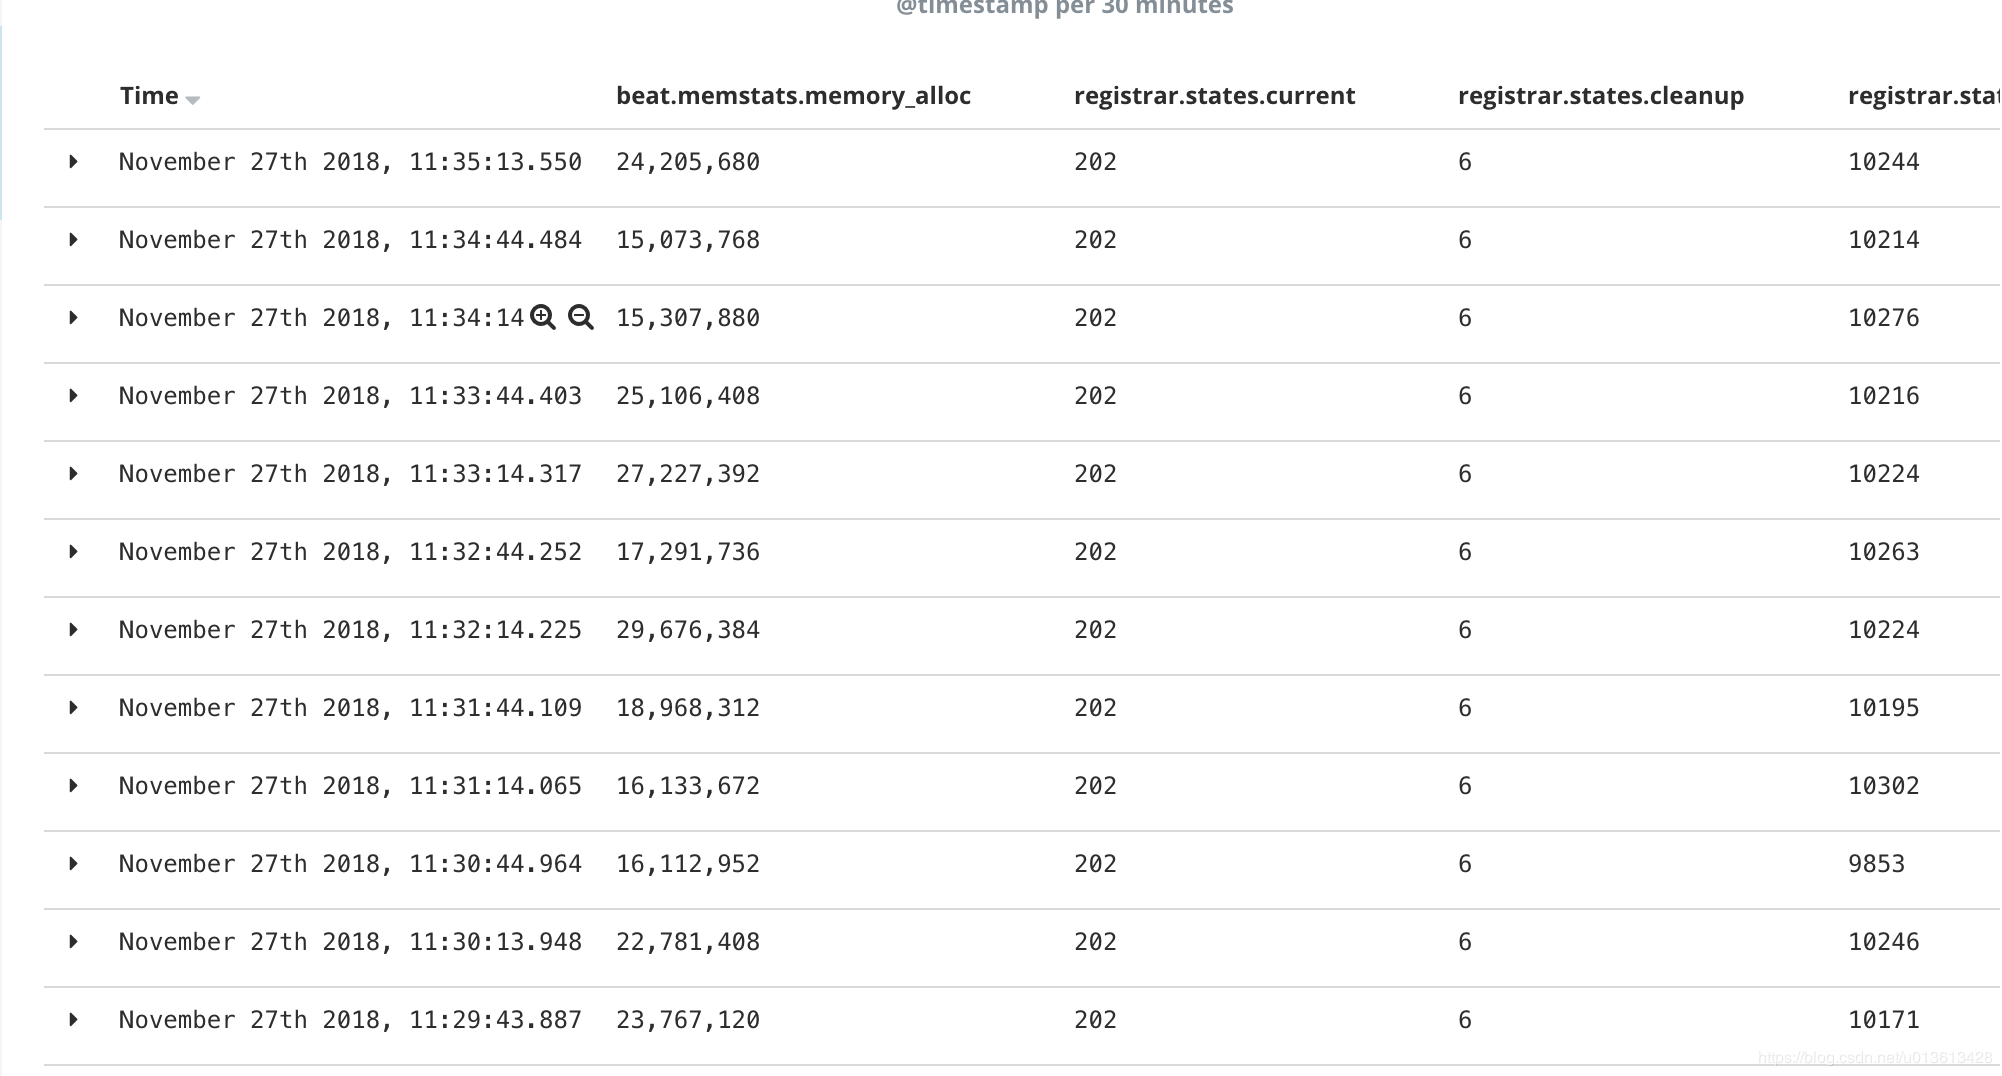
将信息可视化之后,我们可以明显的发现,内存的突变和ERR是同时发生的
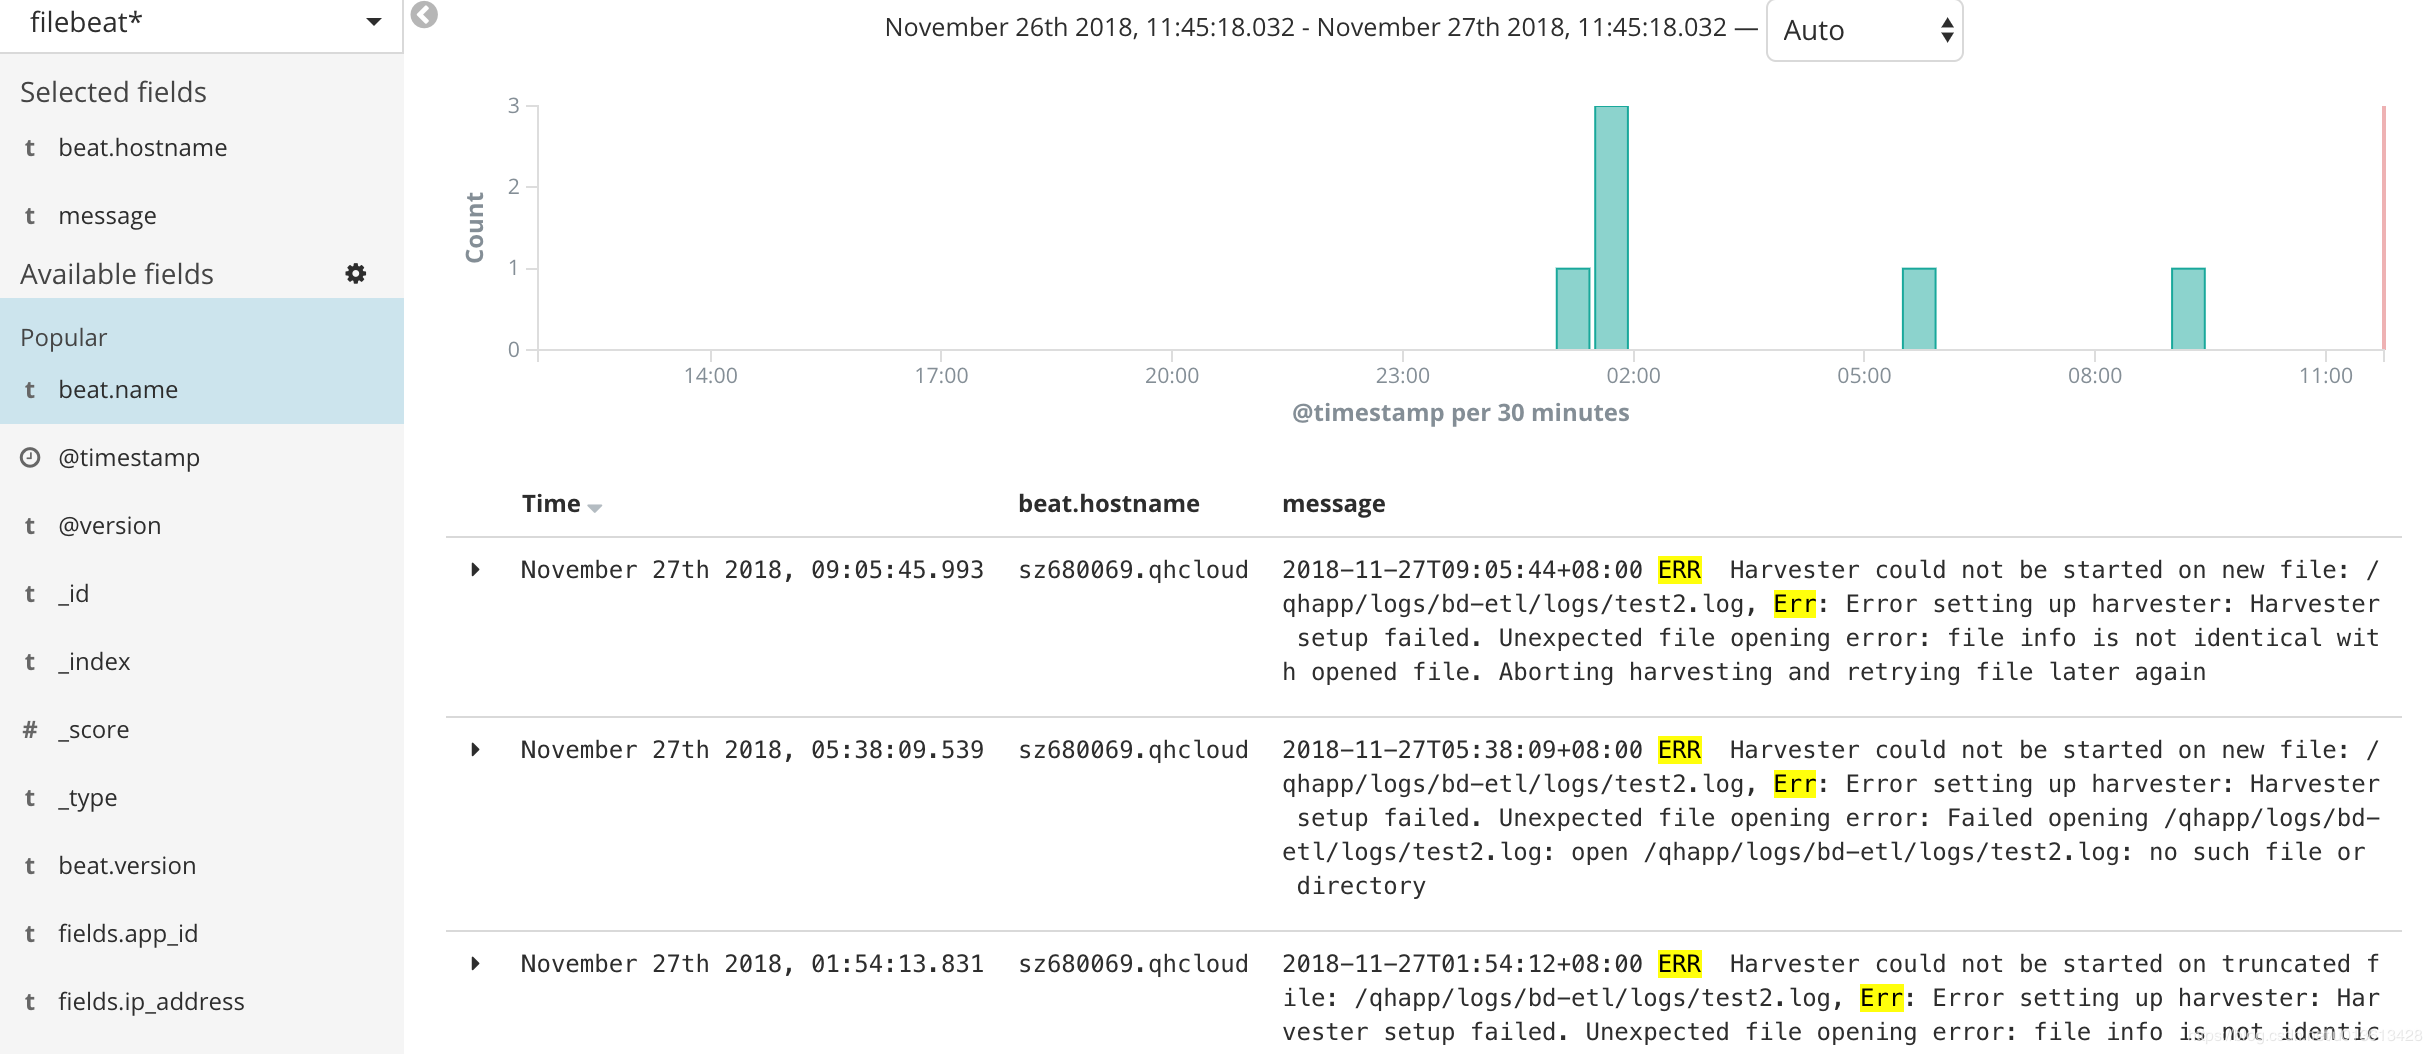
即以下error: 2018-11-27T09:05:44+08:00 ERR Harvester could not be started on new file: /qhapp/logs/bd-etl/logs/test2.log, Err: Error setting up harvester: Harvester setup failed. Unexpected file opening error: file info is not identical with opened file. Aborting harvesting and retrying file later again
会导致filebeat突然申请了额外的内存。具体请查看issue
通过pprof
众所周知,filebeat是用go语言实现的,而go语言本身的基础库里面就包含pprof这个功能极其强大的性能分析工具,只是这个工具是用于debug的,在正常模式下,filebeat是不会启动这个选贤的,并且很遗憾,在官方文档里面根本没有提及我们可以使用pprof来观测filebeat。我们接下来可以通过6.3上修复的一个内存泄漏的issue,来学习怎么使用pprof进行分析
启动pprof监测
首先,需要让filebeat在启动的时候运行pprof,具体的做法是在启动是加上参数-httpprof localhost:6060,即/usr/share/filebeat/bin/filebeat -c /etc/filebeat/filebeat.yml -path.home /usr/share/filebeat -path.config /etc/filebeat -path.data /var/lib/filebeat -path.logs /var/log/filebeat -httpprof localhost:6060。这里只绑定了localhost,无法通过远程访问,如果想远程访问,应该使用0.0.0.0。 这时,你就可以通过curl http://localhost:6060/debug/pprof/heap > profile.txt等命令,获取filebeat的实时堆栈信息了。
远程连接
当然,你也可以通过在你的本地电脑上安装go,然后通过go tool远程连接pprof。 因为我们是需要研究内存的问题,所以以下连接访问的是/heap子路径 go tool pprof http://10.60.x.x:6060/debug/pprof/heap
top 命令
连接之后,你可以通过top命令,查看消耗内存最多的几个实例:
33159.58kB of 33159.58kB total (  100%)
Dropped 308 nodes (cum <= 165.80kB)
Showing top 10 nodes out of 51 (cum >= 512.04kB)
      flat  flat%   sum%        cum   cum%
19975.92kB 60.24% 60.24% 19975.92kB 60.24%  runtime.malg
 7680.66kB 23.16% 83.40%  7680.66kB 23.16%  github.com/elastic/beats/filebeat/channel.SubOutlet
 2048.19kB  6.18% 89.58%  2048.19kB  6.18%  github.com/elastic/beats/filebeat/prospector/log.NewHarvester
 1357.91kB  4.10% 93.68%  1357.91kB  4.10%  runtime.allgadd
 1024.08kB  3.09% 96.76%  1024.08kB  3.09%  runtime.acquireSudog
  544.67kB  1.64% 98.41%   544.67kB  1.64%  github.com/elastic/beats/libbeat/publisher/queue/memqueue.NewBroker
  528.17kB  1.59%   100%   528.17kB  1.59%  regexp.(*bitState).reset
         0     0%   100%   528.17kB  1.59%  github.com/elastic/beats/filebeat/beater.(*Filebeat).Run
         0     0%   100%   512.04kB  1.54%  github.com/elastic/beats/filebeat/channel.CloseOnSignal.func1
         0     0%   100%   512.04kB  1.54%  github.com/elastic/beats/filebeat/channel.SubOutlet.func1
查看堆栈调用图
输入web命令,会生产堆栈调用关系的svg图,在这个svg图中,你可以结合top命令一起查看,在top中,我们已经知道github.com/elastic/beats/filebeat/channel.SubOutlet占用了很多的内存,在图中,展现的是调用关系栈,你可以看到这个类是怎么被实例化的,并且在整个堆中,内存是怎么分布的。最直观的是,实例所处的长方形面积越大,代表占用的内存越多。:
既有适合小白学习的零基础资料,也有适合3年以上经验的小伙伴深入学习提升的进阶课程,涵盖了95%以上软件测试知识点,真正体系化!
的是调用关系栈,你可以看到这个类是怎么被实例化的,并且在整个堆中,内存是怎么分布的。最直观的是,实例所处的长方形面积越大,代表占用的内存越多。:
[外链图片转存中…(img-MTpd1kK7-1726060740862)]
[外链图片转存中…(img-2VjlKY5v-1726060740862)]
[外链图片转存中…(img-TvpZimwN-1726060740863)]
既有适合小白学习的零基础资料,也有适合3年以上经验的小伙伴深入学习提升的进阶课程,涵盖了95%以上软件测试知识点,真正体系化!


 1万+
1万+

 被折叠的 条评论
为什么被折叠?
被折叠的 条评论
为什么被折叠?
 到【灌水乐园】发言


