


<!DOCTYPE html>
<html lang="zh-CN">
<head>
<meta charset="UTF-8">
<meta name="viewport" content="width=device-width, initial-scale=1.0">
<title>交互式数据看板</title>
<script src="https://cdn.jsdelivr.net/npm/chart.js"></script>
<script src="https://cdn.jsdelivr.net/npm/echarts@5.4.3/dist/echarts.min.js"></script>
<style>
body {
font-family: 'Arial', sans-serif;
margin: 0;
padding: 20px;
background-color: #f5f7fa;
color: #333;
}
.header {
text-align: center;
margin-bottom: 30px;
padding: 15px;
background: linear-gradient(135deg, #6B73FF 0%, #000DFF 100%);
color: white;
border-radius: 8px;
box-shadow: 0 4px 12px rgba(0, 0, 0, 0.1);
}
.dashboard {
display: grid;
grid-template-columns: repeat(auto-fit, minmax(500px, 1fr));
gap: 25px;
margin-bottom: 30px;
}
.card {
background: white;
border-radius: 10px;
padding: 20px;
box-shadow: 0 6px 15px rgba(0, 0, 0, 0.08);
transition: transform 0.3s, box-shadow 0.3s;
}
.card:hover {
transform: translateY(-5px);
box-shadow: 0 12px 20px rgba(0, 0, 0, 0.12);
cursor: pointer;
}
.card h2 {
margin-top: 0;
color: #2c3e50;
border-bottom: 2px solid #eee;
padding-bottom: 10px;
}
.chart-container {
height: 300px;
margin-top: 15px;
}
.table-container {
overflow-x: auto;
}
table {
width: 100%;
border-collapse: collapse;
margin-top: 15px;
}
th, td {
padding: 12px 15px;
text-align: left;
border-bottom: 1px solid #ddd;
}
th {
background-color: #f8f9fa;
font-weight: 600;
}
tr:hover {
background-color: #f5f5f5;
}
.drill-down {
color: #3498db;
text-decoration: none;
font-weight: 600;
}
.drill-down:hover {
text-decoration: underline;
}
.filters {
display: flex;
gap: 15px;
margin-bottom: 25px;
flex-wrap: wrap;
}
select, button {
padding: 10px 15px;
border-radius: 6px;
border: 1px solid #ddd;
background-color: white;
font-size: 14px;
}
button {
background-color: #3498db;
color: white;
border: none;
cursor: pointer;
transition: background-color 0.3s;
}
button:hover {
background-color: #2980b9;
}
</style>
</head>
<body>
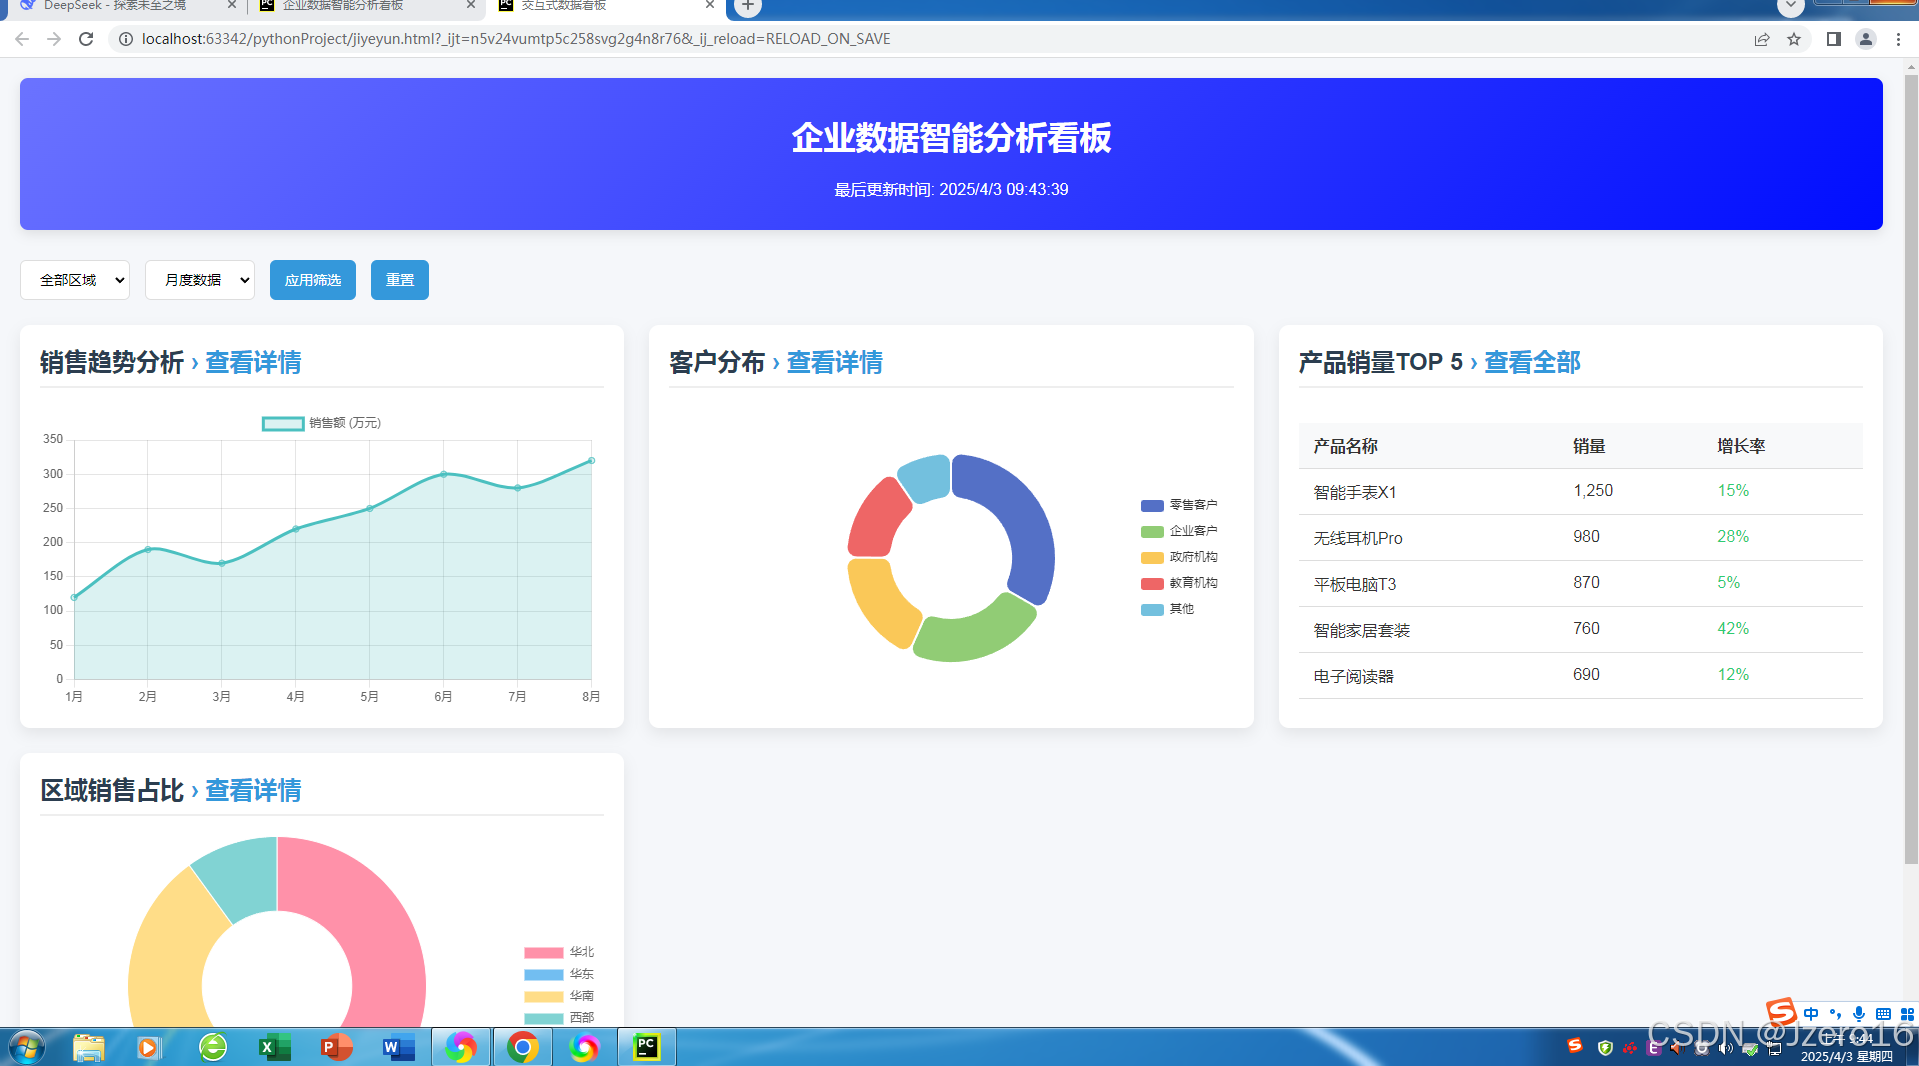
<div class="header">
<h1>企业数据智能分析看板</h1>
<p>最后更新时间: <span id="update-time"></span></p>
</div>
<div class="filters">
<select id="region-filter">
<option value="all">全部区域</option>
<option value="north">华北</option>
<option value="east">华东</option>
<option value="south">华南</option>
<option value="west">西部</option>
</select>
<select id="time-filter">
<option value="monthly">月度数据</option>
<option value="quarterly">季度数据</option>
<option value="yearly">年度数据</option>
</select>
<button οnclick="applyFilters()">应用筛选</button>
<button οnclick="resetFilters()">重置</button>
</div>
<div class="dashboard">
<!-- 销售趋势图 -->
<div class="card" οnclick="navigateTo('sales-detail.html')">
<h2>销售趋势分析 <span class="drill-down">› 查看详情</span></h2>
<div class="chart-container">
<canvas id="salesTrendChart"></canvas>
</div>
</div>
<!-- 客户分布图 -->
<div class="card" οnclick="navigateTo('customer-analysis.html')">
<h2>客户分布 <span class="drill-down">› 查看详情</span></h2>
<div class="chart-container" id="customerDistributionChart"></div>
</div>
<!-- 产品销量表 -->
<div class="card" οnclick="navigateTo('product-performance.html')">
<h2>产品销量TOP 5 <span class="drill-down">› 查看全部</span></h2>
<div class="table-container">
<table id="productTable">
<thead>
<tr>
<th>产品名称</th>
<th>销量</th>
<th>增长率</th>
</tr>
</thead>
<tbody>
<!-- 数据将通过JavaScript动态填充 -->
</tbody>
</table>
</div>
</div>
<!-- 区域销售占比 -->
<div class="card" οnclick="navigateTo('regional-sales.html')">
<h2>区域销售占比 <span class="drill-down">› 查看详情</span></h2>
<div class="chart-container">
<canvas id="regionPieChart"></canvas>
</div>
</div>
</div>
<script>
// 设置更新时间
document.getElementById('update-time').textContent = new Date().toLocaleString();
// 导航函数
function navigateTo(page) {
// 在实际应用中,这里会跳转到对应页面
// 为了演示,我们只显示一个提示
alert('在实际应用中,将跳转到: ' + page + '\n\n这里可以传递参数如: region=' + document.getElementById('region-filter').value);
// 实际跳转代码应该是:
// window.location.href = page + '?region=' + document.getElementById('region-filter').value;
}
// 筛选函数
function applyFilters() {
const region = document.getElementById('region-filter').value;
const timeRange = document.getElementById('time-filter').value;
alert(`应用筛选条件:\n区域: ${region}\n时间范围: ${timeRange}`);
// 实际应用中这里会重新加载数据
updateCharts(region, timeRange);
}
function resetFilters() {
document.getElementById('region-filter').value = 'all';
document.getElementById('time-filter').value = 'monthly';
updateCharts('all', 'monthly');
}
// 初始化图表
document.addEventListener('DOMContentLoaded', function() {
// 销售趋势图 (Chart.js)
const salesCtx = document.getElementById('salesTrendChart').getContext('2d');
const salesChart = new Chart(salesCtx, {
type: 'line',
data: {
labels: ['1月', '2月', '3月', '4月', '5月', '6月', '7月', '8月'],
datasets: [{
label: '销售额 (万元)',
data: [120, 190, 170, 220, 250, 300, 280, 320],
borderColor: 'rgba(75, 192, 192, 1)',
backgroundColor: 'rgba(75, 192, 192, 0.2)',
tension: 0.3,
fill: true
}]
},
options: {
responsive: true,
maintainAspectRatio: false,
plugins: {
tooltip: {
mode: 'index',
intersect: false
}
},
scales: {
y: {
beginAtZero: true
}
}
}
});
// 区域饼图 (Chart.js)
const regionCtx = document.getElementById('regionPieChart').getContext('2d');
const regionChart = new Chart(regionCtx, {
type: 'doughnut',
data: {
labels: ['华北', '华东', '华南', '西部'],
datasets: [{
data: [35, 30, 25, 10],
backgroundColor: [
'rgba(255, 99, 132, 0.7)',
'rgba(54, 162, 235, 0.7)',
'rgba(255, 206, 86, 0.7)',
'rgba(75, 192, 192, 0.7)'
],
borderWidth: 1
}]
},
options: {
responsive: true,
maintainAspectRatio: false,
plugins: {
legend: {
position: 'right'
}
}
}
});
// 客户分布图 (ECharts)
const customerChart = echarts.init(document.getElementById('customerDistributionChart'));
customerChart.setOption({
tooltip: {
trigger: 'item',
formatter: '{a} <br/>{b}: {c} ({d}%)'
},
legend: {
orient: 'vertical',
right: 10,
top: 'center',
data: ['零售客户', '企业客户', '政府机构', '教育机构', '其他']
},
series: [
{
name: '客户类型分布',
type: 'pie',
radius: ['40%', '70%'],
avoidLabelOverlap: false,
itemStyle: {
borderRadius: 10,
borderColor: '#fff',
borderWidth: 2
},
label: {
show: false,
position: 'center'
},
emphasis: {
label: {
show: true,
fontSize: '18',
fontWeight: 'bold'
}
},
labelLine: {
show: false
},
data: [
{ value: 1048, name: '零售客户' },
{ value: 735, name: '企业客户' },
{ value: 580, name: '政府机构' },
{ value: 484, name: '教育机构' },
{ value: 300, name: '其他' }
]
}
]
});
// 产品表格数据
const productData = [
{ name: '智能手表X1', sales: 1250, growth: '15%' },
{ name: '无线耳机Pro', sales: 980, growth: '28%' },
{ name: '平板电脑T3', sales: 870, growth: '5%' },
{ name: '智能家居套装', sales: 760, growth: '42%' },
{ name: '电子阅读器', sales: 690, growth: '12%' }
];
const tableBody = document.querySelector('#productTable tbody');
productData.forEach(product => {
const row = document.createElement('tr');
row.innerHTML = `
<td>${product.name}</td>
<td>${product.sales.toLocaleString()}</td>
<td style="color: ${product.growth.includes('-') ? '#e74c3c' : '#2ecc71'}">${product.growth}</td>
`;
tableBody.appendChild(row);
});
// 窗口大小变化时重新调整图表大小
window.addEventListener('resize', function() {
salesChart.resize();
regionChart.resize();
customerChart.resize();
});
});
// 更新图表数据函数 (模拟)
function updateCharts(region, timeRange) {
console.log(`更新图表数据,区域: ${region}, 时间范围: ${timeRange}`);
// 实际应用中这里会从API获取新数据并更新图表
}
</script>
</body>
</html>


 被折叠的 条评论
为什么被折叠?
被折叠的 条评论
为什么被折叠?
 到【灌水乐园】发言


