#导入模块
import numpy as np
import cartopy
import matplotlib.pyplot as plt
import cartopy.crs as ccrs
from cartopy.feature import ShapelyFeature
from cartopy.io.shapereader import Reader
from cartopy.feature import NaturalEarthFeature,COLORS
from matplotlib.cm import get_cmap
from matplotlib.colors import from_levels_and_colors
import matplotlib.ticker as mticker
from matplotlib.animation import FuncAnimation
from IPython.display import HTML
from netCDF4 import Dataset
from xarray import DataArray
from wrf import getvar, interplevel, vertcross, vinterp, ALL_TIMES, CoordPair, xy_to_ll,\
ll_to_xy, to_np, get_cartopy, latlon_coords, cartopy_xlim, cartopy_ylim
import os
import warnings
warnings.filterwarnings('ignore')
#读取文件(利用循环遍历文件夹内所有nc文件)
wrf_dir = "/H/w_test/"
wrf_file = ["wrfout_d01_2020-03-01_00.nc",
"wrfout_d01_2021-03-01_00.nc",
"wrfout_d01_2022-03-01_00.nc"]
wrf_files = [os.path.abspath(os.path.join(wrf_dir,f)) for f in wrf_file]
for f in wrf_files:
if not os.path.exists(f):
raise ValueError("{} does not exist."
"check for typos or incorrect directory.".format(f))
#读取文件夹内单一文件
def single_wrf_file():
global wrf_files
return wrf_files[0]
#读取文件夹内所有文件
def multiple_wrf_files():
global wrf_files
return wrf_files
#本案例只读取第一个nc文件
file_path = single_wrf_file()
wrf_f = Dataset(file_path)
print(file_path)
#print(wrf_f)
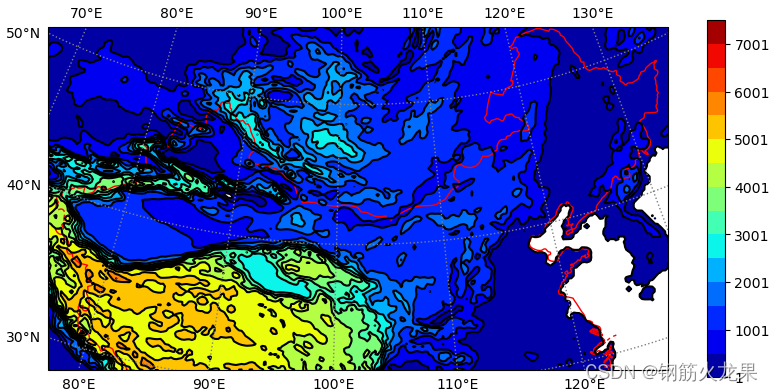
#获取文件中的地形变量
terrain = getvar(wrf_f, "ter", timeidx = 0)
cart_proj = get_cartopy(terrain)
#获取变量的经纬度坐标,并设置投影。
lats, lons = latlon_coords(terrain)
extent = [70, 140, 10,60] #限定绘图范围
cart_proj = get_cartopy(terrain) #创建投影,对应数据集中terrain的投影
#叠加中国地图
china = "/china-boundary/china-boundary.shp"
fig = plt.figure(figsize=(10,8))
geo_axes = plt.axes(projection=cart_proj)
#states = NaturalEarthFeature(category='cultural', scale='50m', facecolor='none',name='admin_1_states_provinces')
cmap = cartopy.feature.ShapelyFeature(Reader(china).geometries(), crs=ccrs.PlateCarree(), edgecolor="r", facecolor="none")
geo_axes.add_feature(cmap, linewidth=1)
#geo_axes.add_feature(states, linewidth=0.9)
#geo_axes.coastlines("50m", linewidth = 0.8)
levels = np.arange(1, 8000, 500)
plt.contour(to_np(lons), to_np(lats), to_np(terrain),
levels=levels, colors="black", transform = ccrs.PlateCarree())
plt.contourf(to_np(lons), to_np(lats),
to_np(terrain), levels=levels,
transform=ccrs.PlateCarree(),
cmap=get_cmap("jet"))
#plt.rcParams["font.sans-serif"]=["SimHei"]
#添加刻度信息
gl = geo_axes.gridlines(draw_labels = True, linestyle=":", crs=ccrs.PlateCarree(), linewidth=1, color="grey", x_inline=False, y_inline=False)
#gl.top_labels = False #关闭上部经纬度标签
gl.right_labels = False
#gl.xlabels_bottom = True
#gl.xformatter = LONGITUDE_FORMATTER #使横坐标转化为经纬度格式
#gl.yformatter = LATITUDE_FORMATTER
gl.xlocator = mticker.FixedLocator(np.arange(70,140,10))
gl.ylocator = mticker.FixedLocator(np.arange(10,60,10))
gl.xlabel_style ={"size":10, "color":"black"} #修改经纬度坐标网格字体大小
gl.ylabel_style ={"size":10, "color":"black"} #修改经纬度坐标网格字体大小
gl.rotate_labels = False
#添加colorbar
plt.colorbar(ax=geo_axes, shrink=0.58)
plt.show()
#保存图片
#plt.savefig("../wrf-domain.jpg", dpi = 600)


 3000
3000


 被折叠的 条评论
为什么被折叠?
被折叠的 条评论
为什么被折叠?
 到【灌水乐园】发言


