


推荐使用ipython的pylab模式,如果要在ipython notebook中嵌入图片,则还需要指定pylab=inline。
ipython --pylab ##ipython的pylab模式
ipython notebook --pylab=inline ##notebook的inline模式
import pandas as pd
基本画图命令
Pandas通过整合matplotlib的相关功能实现了基于DataFrame的一些 作图功能。下面的数据是每年美国男女出生数据:
url = 'http://s3.amazonaws.com/assets.datacamp.com/course/dasi/present.txt'
present = pd.read_table(url, sep=' ')
present.shape(63, 3)present.columnsIndex([u'year', u'boys', u'girls'], dtype='object')可以看到这个数据集共有63条记录,共有三个字段:Year,boys,girls。为了简化计算将year作为索引。
present_year = present.set_index('year')plot是画图的最主要方法,Series和DataFrame都有plot方法。
可以这样看一下男生出生比例的趋势图:
present_year['boys'].plot()
plt.legend(loc='best')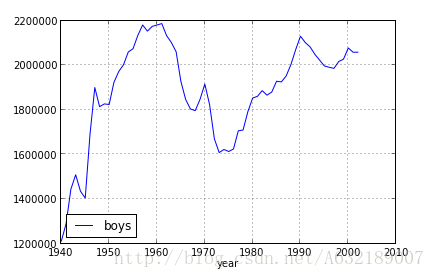
这是Series上的plot方法,通过DataFrame的plot方法,你可以将男生和女生出生数量的趋势图画在一起。
present_year.plot()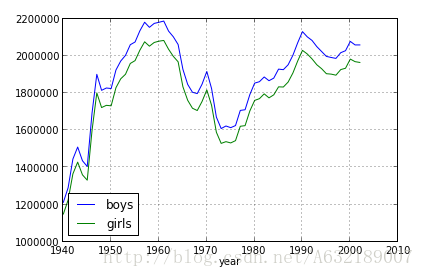
present_year.girls.plot(color='g')
present_year.boys.plot(color='b')
plt.legend(loc='best')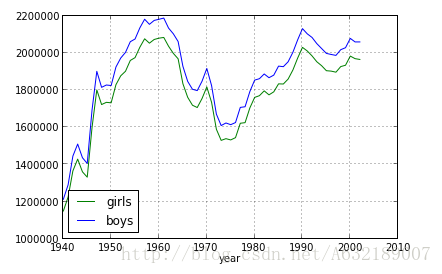
可以看到DataFrame提供plot方法与在多个Series调用多次plot方法的效果是一致。
present_year[:10].plot(kind='bar')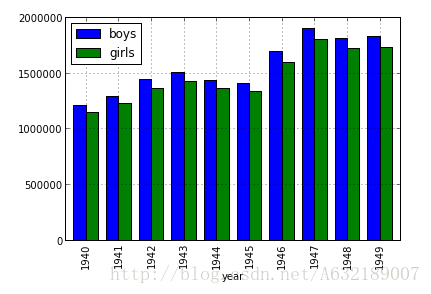
plot默认生成是曲线图,你可以通过kind参数生成其他的图形,可选的值为:line, bar, barh, kde, density, scatter。


 3万+
3万+

 被折叠的 条评论
为什么被折叠?
被折叠的 条评论
为什么被折叠?
 到【灌水乐园】发言


