


JfreeChart设计原则:
图形和显示图像所需数据的清晰分离
a clear separation between the data and its presentation ( controlled by the plot and renderer) .
JFreeChart制图主要由4部分组成
1:JFreeChart类
2:Plot绘制区类
3: Renderer单个图形绘制者
4:Dataset数据持有者。 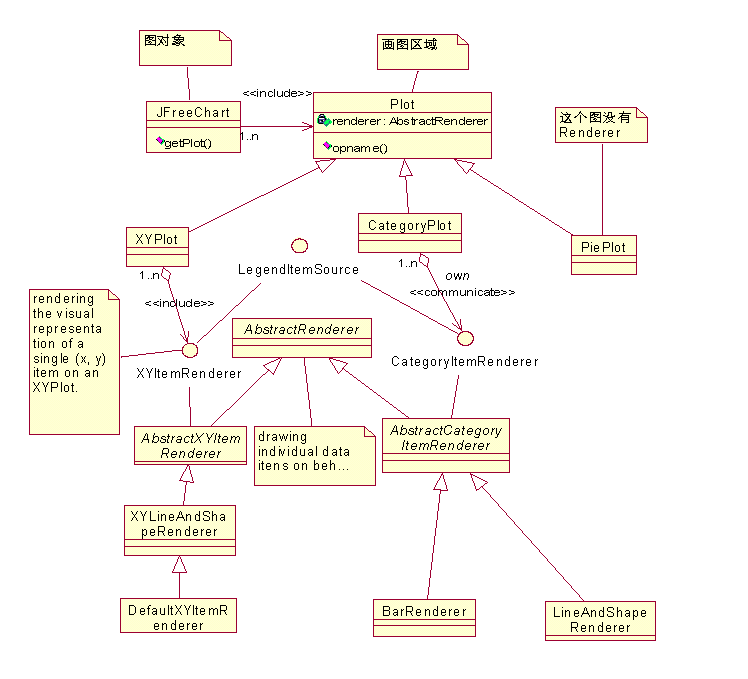
主要类介绍
JFreeChart 表示绘制的整个图形,拥有1…n个plot,通常是一个Plot表示图形的绘
制区域,主要有3种:
Plot
PiePlot: PiePlot3D, 饼形绘制区域。没有渲染器。数据集使用PieDataset, 添加数据
后,通过ChartFactory来创建相应的图形,图形的属性都是通过Plot的设置的。
CategoryPlot: 一个通用的使用CategoryDataset和CategoryItemRenderer的绘制区。
A general plotting class that uses data from a CategoryDataset and renders each data item using a CategoryItemRenderer.
在CategoryPlot上绘制的图形
Bar chart: DefaultCategoryDataset, 实现的数据集。 Bar chart has two axes, one that dipplays categories from the dataset( a CategoryAxis) and another that provides the numerical scale against which the data values are plotted( a NumberAxis).
Line chart: 1: 基于CategoryDataset在CategoryPlot上绘制,使用LineAndShapeRanderer渲染器 2:基于XYDataset在XYPlot上绘制
Time Series Chart:
a time series chart is really just a line chart using data obtained via the XYDataset interface, the difference is that the x-values are displayed as dates on the domain axis.
XYPlot, a general class for plotting data in the form of (x,y) pairs, this plot can use data from any class that implements the XYDataset interfacr, make use of an XYItemRender to draw each point on the point on the plot.
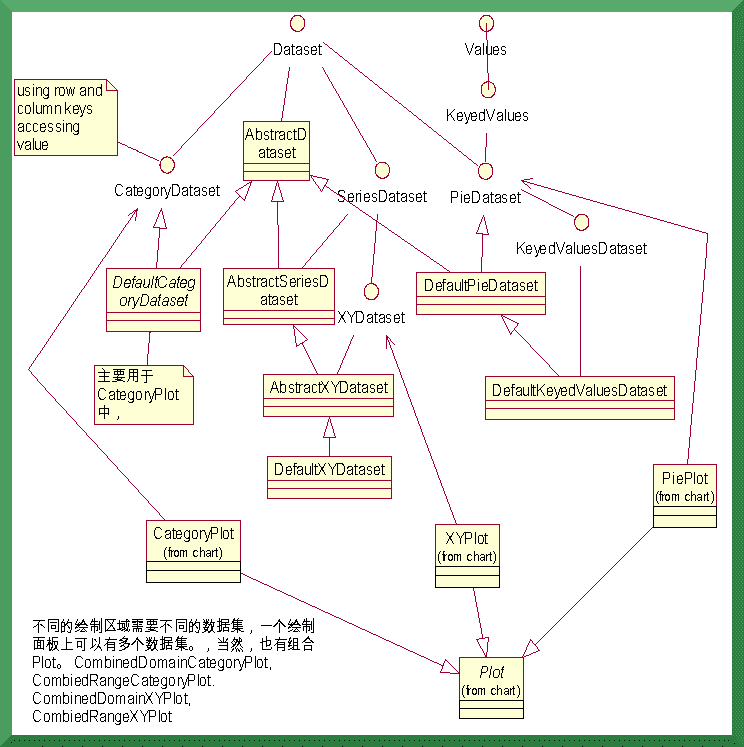
Dataset介绍:
CategoryDataset, 表格式的数据集, each column heading is a category, and each row in
the table is series. each row heading is a series name( or series name). common to create bar chart. 主要实现是类DefaultCategoryDataset类。主要函数是
add(Number value, rowKey, columnKey).
PieDataset, 饼式数据集。a collection of value where each value is associated with a key .
create PieChart. 主要实现是DefaultPieDataset.添加数据的方法是 setValue(Comparable key, Number value)
XYDataset, a collection of data in the form of (x, y) values.主要被XYPlot使用,扩展的
接口有IntervalXYDataset, OHLCDataset, XYZDataset, TableXYDataset.
Renderer, 渲染器。
这个类做真正的绘制。
drawing individual data items on behalf of a plot. Renderers offer a lot of scope
for changing the appearance of your charts, either by changing the attributes of an existing renderer, or by implementing a completely new renderer.
CategoryItemRenderer 表格式数据中当个数据的渲染器
XYItemRenderer 单个点的渲染器
PiePlot没有渲染器。
PieChart使用过程:
//创建数据集对象,用来保存显示的数据
DefaultPieDataset dataset = new DefaultPieDataset();
dataset.setValue("1", 20.0);
dataset.setValue("2", 30);
//获取整个图形对象
JFreeChart chart = ChartFactory.createPieChart("", dataset, false,false,false);
//在chart中设置图像的全局属性,例如标题,背景色
//从chart可以获得Plot对象,此时要使用向下转换。在plot上可以设置画布的属性,例如标签字体
PiePlot plot = (PiePlot) chart.getPlot( );
//从plot中获取单个图像的渲染器,单个图像的属性在这个设置
LineAndShapeRender renderer = (LineAndShapeRenderer) plot.getRenderer();
//把图像转换成图片显示出来
ChartFrame frame = new ChartFrame("", chart);
frame.show(true);
AbstractRenderer中的lookupSeriesPaint(int serials)获取serials的涂料
Row代表series,Column代表categoryKey 


 256
256

 被折叠的 条评论
为什么被折叠?
被折叠的 条评论
为什么被折叠?
 到【灌水乐园】发言


