


 文章介绍了Prometheus的两种规则类型:RecordingRules用于预计算和存储指标,提高查询效率;AlertingRules用于设置告警,当满足特定条件时发送通知。配置包括规则文件、评估间隔、告警等待时间和标签等。Alertmanager作为Prometheus生态系统的一部分,负责处理告警通知和调度。
Prometheus支持两种类型的规则:recording rules和alerting rules
规则文件也是yaml格式的
例如创建了test-rule.yml文件之后,在prometheus.yml中指定文件地址即可。
rule_files:
  - "test-rule.yml"
Prometheus server会按照配置中的evaluation_interval定时执行规则文件。下面分别介绍这两种规则
record rules
场景: 以Prometheus自带的指标prometheus_http_requests_total举例,看板上想要统计每个状态码对应的请求数量,则需要在每次查询的时候使用expr进行计算:
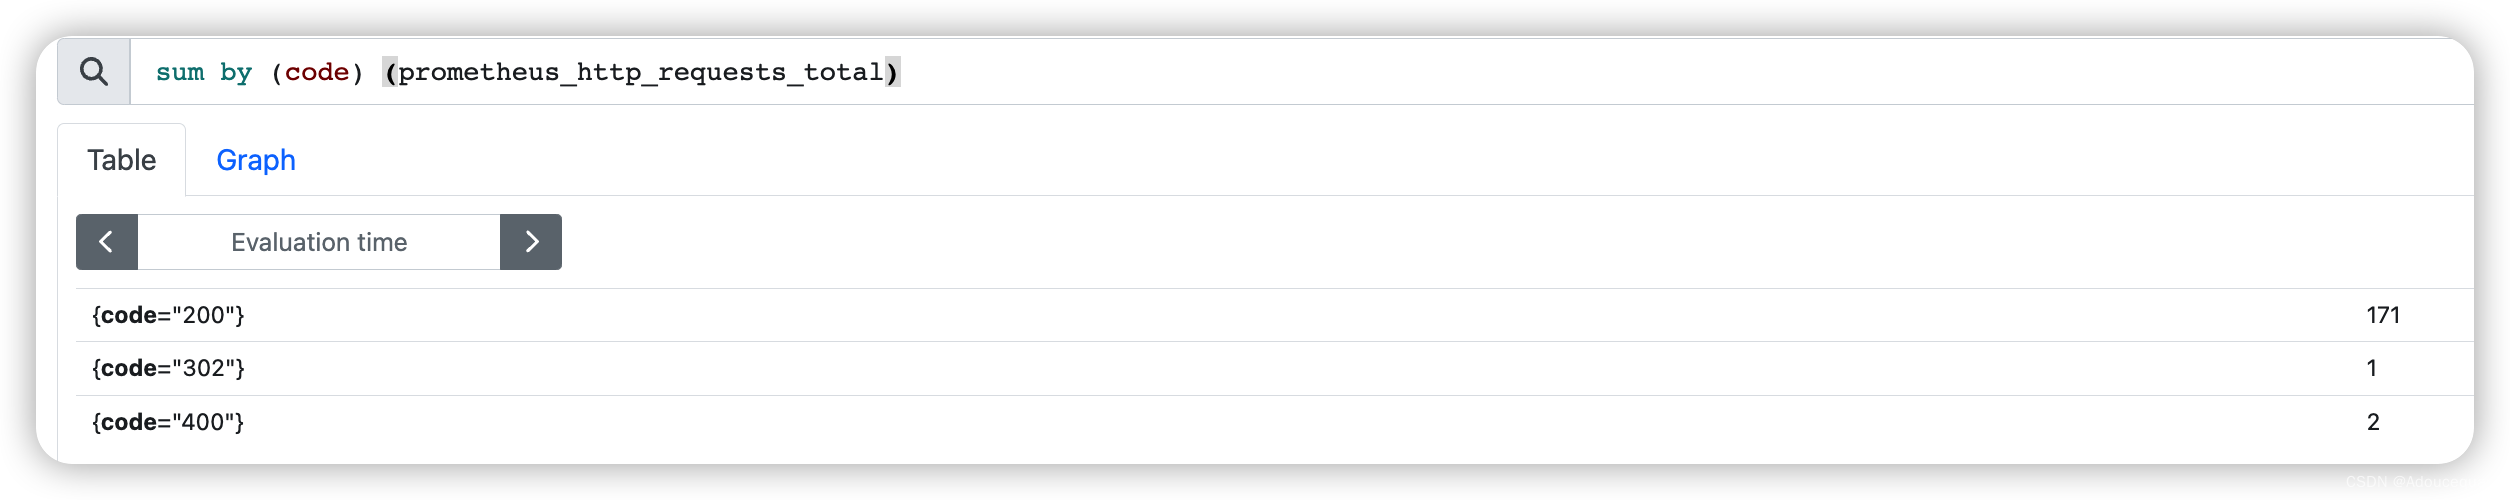
假如数据量很大,且看板上有很多类似的表达式计算,可能响应就会比较慢。
解决办法:
在采集到数据之后,通过record中配置的计算规则进行计算,将计算结果形成新的metric并进行存储,这样就不需要在每次查询的时候再进行计算。
配置如下:
groups:
	# group名称,在文件要唯一
	- name: example
	# 多久执行一次规则,如果不配置默认去global的evaluation_interval
	interval: 15
	# 总共执行多少次,默认0不限制
	limit: 0
	rules:
		# 指标名称
		- record: metricName
		# 针对采集到的metric进行表达式计算
		expr: sum by (code) (prometheus_http_requests_total)
		# 在metricName追加的lable,也可覆盖已有的lable
		labels:
			labelName: labelValue
alerting rules
告警在线上业务中起着重要作用,告警能够及时的通知开发人员线上业务出现了问题,协助开发人员快速定位解决问题。
Prometheus 的alerting rules可通过简单的配置达到业务告警的目的。其配置格式如下:
groups:
	# group名称,在文件要唯一
	- name: example
	# 多久执行一次规则,如果不配置默认去global的evaluation_interval
	interval: 15
	# 总共执行多少次,默认0不限制
	limit: 0
	rules:
		# 指标名称
		- alert: alertName
		# 针对采集到的metric进行表达式计算
		expr: sum by (code) (prometheus_http_requests_total)
		# 评估等待时间,可选参数。用于表示只有当触发条件持续一段时间后才发送告警。在等待期间新产生告警的状态为pending。
		for: 1m
		# 在metricName追加的lable,也可覆盖已有的lable
		labels:
			labelName: labelValue
		# 告警的附加信息,可以使用模板
		annotations:
			summery:
			description:
模板
$ labels值保存了alert实例的所有lable的key/value, $ value保存了alert实例通过expr计算之后的值(告警值), $externalLabels保存了配置的外部的label
# To insert a firing element's label values:
{{ $labels.<labelname> }}
# To insert the numeric expression value of the firing element:
{{ $value }}
样例:
groups:
- name: example
  rules:

  # Alert for any instance that is unreachable for >5 minutes.
  - alert: InstanceDown
    expr: up == 0
    for: 5m
    labels:
      severity: page
    annotations:
      summary: "Instance {{ $labels.instance }} down"
      description: "{{ $labels.instance }} of job {{ $labels.job }} has been down for more than 5 minutes."

  # Alert for any instance that has a median request latency >1s.
  - alert: APIHighRequestLatency
    expr: api_http_request_latencies_second{quantile="0.5"} > 1
    for: 10m
    annotations:
      summary: "High request latency on {{ $labels.instance }}"
      description: "{{ $labels.instance }} has a median request latency above 1s (current value: {{ $value }}s)"
发送告警通知
Prometheus 的警报规则只能用作发现问题出在哪,但并不能及时的通知到业务人员,其不是一个成熟的告警通知解决方案。 所以需要在简单的告警定义的层级之上,添加摘要、告警通知、告警频率限制、告警沉默这些功能。
在 Prometheus 的生态系统中,Alertmanager 承担了这个角色。 因此,Prometheus 可以定期将有关告警状态的信息发送到 Alertmanager 实例,然后由该实例负责调度正确的通知。
Prometheus 可以配置为通过其集成的服务发现功能,自动发现可用的 Alertmanager 实例。


 3409
3409

 被折叠的 条评论
为什么被折叠?
被折叠的 条评论
为什么被折叠?
 到【灌水乐园】发言


