


一般来说核心页面都需要进行压测,特别是秒杀页面,从而知道网站的承受能力,方便暴露一些问题,更好的把控网站。压测工具有很多种,最简单、方便的可以使用ApacheBench,也就是我们熟悉的ab工具,不过只能做一些简单的压测效果。
如果在windows下面压测,安装apache后,bin目录下会有个“ab.exe”;linux下则需要另行安装,拿centos举例可以执行“yum install httpd-tools”进行安装。安装完成后执行“ab”命令就可以看到提示了。
压测命令:ab -kc 10 -n 100 https://www.daixiaorui.com/
参数说明:
k:使用长连接(http keep-alive)。
c:并发数。
n:请求数。
压测结果如下:
| 1 2 3 4 5 6 7 8 9 10 11 12 13 14 15 16 17 18 19 20 21 22 23 24 25 26 27 28 29 30 31 32 33 34 35 36 37 38 39 40 41 42 43 44 45 46 |
|
我们主要看这一项:Requests per second: 35.65 [#/sec] (mean)。意思是一秒钟处理的请求数,即代潇瑞博客一秒钟能接受35.65个请求。
不过压测结果还依赖于网络带宽、当前负载等情况的影响。就拿我的网站来说,在远程压测才4.37个请求,因为服务器只有1MB的带宽,即128kb/s左右。
一句话解释并行和并发的概念和异同。
并发:时间段内有很多的线程或进程在执行,但何时间点上都只有一个在执行,多个线程或进程争抢时间片轮流执行。不是一个时间点的,是一个时间段内的概念,比如一秒钟能处理多少请求,请求数越多表示并发量越大。
并行:时间段和时间点上都有多个线程或进程在执行。就好比下图一样的关系:
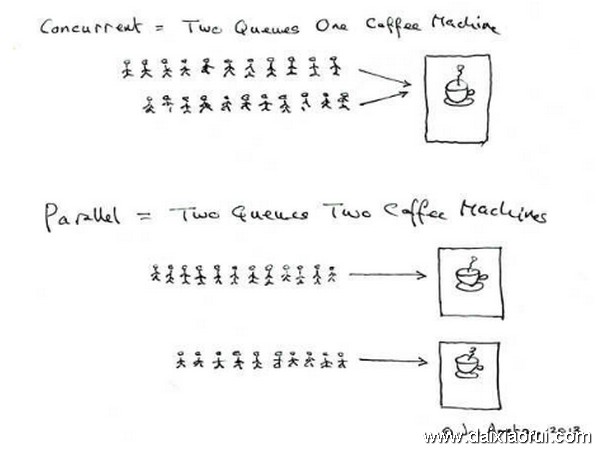
咖啡机表示CPU,并发就是两个队列交替使用一台咖啡机,并行是两个队列同时使用两台咖啡机。
关于上面标红文字“时间点”的解释:
cpu并不能同时处理多件任务(拿一个核心来说),我们平时用电脑的时候,既能下载、又能同时听歌、还能同时浏览网页,是因为CPU在处理的程中,会把时间分成很多片段(纳秒或微秒级别),然后让程序轮流的执行,因为片段非常小,肉眼分辨不出来,所以让我们感觉电脑是在同时处理请求的。
文章出自:https://www.daixiaorui.com/read/254.html
ab -n 1000 -c 100 -w http://localhost/index.php >>c:\1.html
上面的测试用例表示100并发的情况下,共测试访问index.php脚本1000次,并将测试结果保存到c:\1.html文件中。
ab -n 全部请求数 -c 并发数 测试url
例:ab -n 1000 -c 50 http://www.newdev.gztest.com/
Server Software: Microsoft-IIS/7.0
Server Hostname: www.newdev.gztest.com
Server Port: 80
Document Path:
Document Length: 82522 bytes #请求文档大小
Concurrency Level: 50 #并发数
Time taken for tests: 92.76140 seconds #全部请求完成耗时
Complete requests: 10000 #全部请求数
Failed requests: 1974 #失败的请求
(Connect: 0, Length: 1974, Exceptions: 0)
Write errors: 0
Total transferred: 827019400 bytes #总传输大小
HTML transferred: 825219400 bytes //整个场景中的HTML内容传输量
Requests per second: 108.61 [#/sec] (mean) #每秒请求数(平均)//大家最关心的指标之一,相当于 LR 中的每秒事务数,后面括号中的 mean 表示这是一个平均值
Time per request: 460.381 [ms] (mean) #每次并发请求时间(所有并发) //大家最关心的指标之二,相当于 LR 中的平均事务响应时间,后面括号中的 mean 表示这是一个平均值
Time per request: 9.208 [ms] (mean, across all concurrent requests) #每一请求时间(并发平均) //每个请求实际运行时间的平均值
Transfer rate: 8771.39 [Kbytes/sec] received #传输速率//平均每秒网络上的流量,可以帮助排除是否存在网络流量过大导致响应时间延长的问题
Percentage of the requests served within a certain time (ms)
50% 2680
66% 2806
75% 2889
80% 2996
90% 11064
95% 20161
98% 21092
99% 21417
100% 21483 (longest request)
//整个场景中所有请求的响应情况。在场景中每个请求都有一个响应时间,其中50%的用户响应时间小于2680毫秒,60% 的用户响应时间小于2806毫秒,最大的响应时间小于21417毫秒
由于对于并发请求,cpu实际上并不是同时处理的,而是按照每个请求获得的时间片逐个轮转处理的,所以基本上第一个Time per request时间约等于第二个Time per request时间乘以并发请求数。
Connection Times (ms) #连接时间
min mean[+/-sd] median max
Connect(#连接): 0 0 2.1 0 46
Processing(#处理): 31 458 94.7 438 1078
Waiting(#等待): 15 437 87.5 422 938
Total: 31 458 94.7 438 1078
其它参数:
-n requests 全部请求数
-c concurrency 并发数
-t timelimit 最传等待回应时间
-p postfile POST数据文件
-T content-type POST Content-type
-v verbosity How much troubleshooting info to print
-w Print out results in HTML tables
-i Use HEAD instead of GET
-x attributes String to insert as table attributes
-y attributes String to insert as tr attributes
-z attributes String to insert as td or th attributes
-C attribute 加入cookie, eg. 'Apache=1234. (repeatable)
-H attribute 加入http头, eg. 'Accept-Encoding: gzip'
Inserted after all normal header lines. (repeatable)
-A attribute http验证,分隔传递用户名及密码
-P attribute Add Basic Proxy Authentication, the attributes
are a colon separated username and password.
-X proxy:port 代理服务器
-V 查看ab版本
-k Use HTTP KeepAlive feature
-d Do not show percentiles served table.
-S Do not show confidence estimators and warnings.
-g filename Output collected data to gnuplot format file.
-e filename Output CSV file with percentages served
-h Display usage information (this message)


 137
137

 被折叠的 条评论
为什么被折叠?
被折叠的 条评论
为什么被折叠?
 到【灌水乐园】发言


