


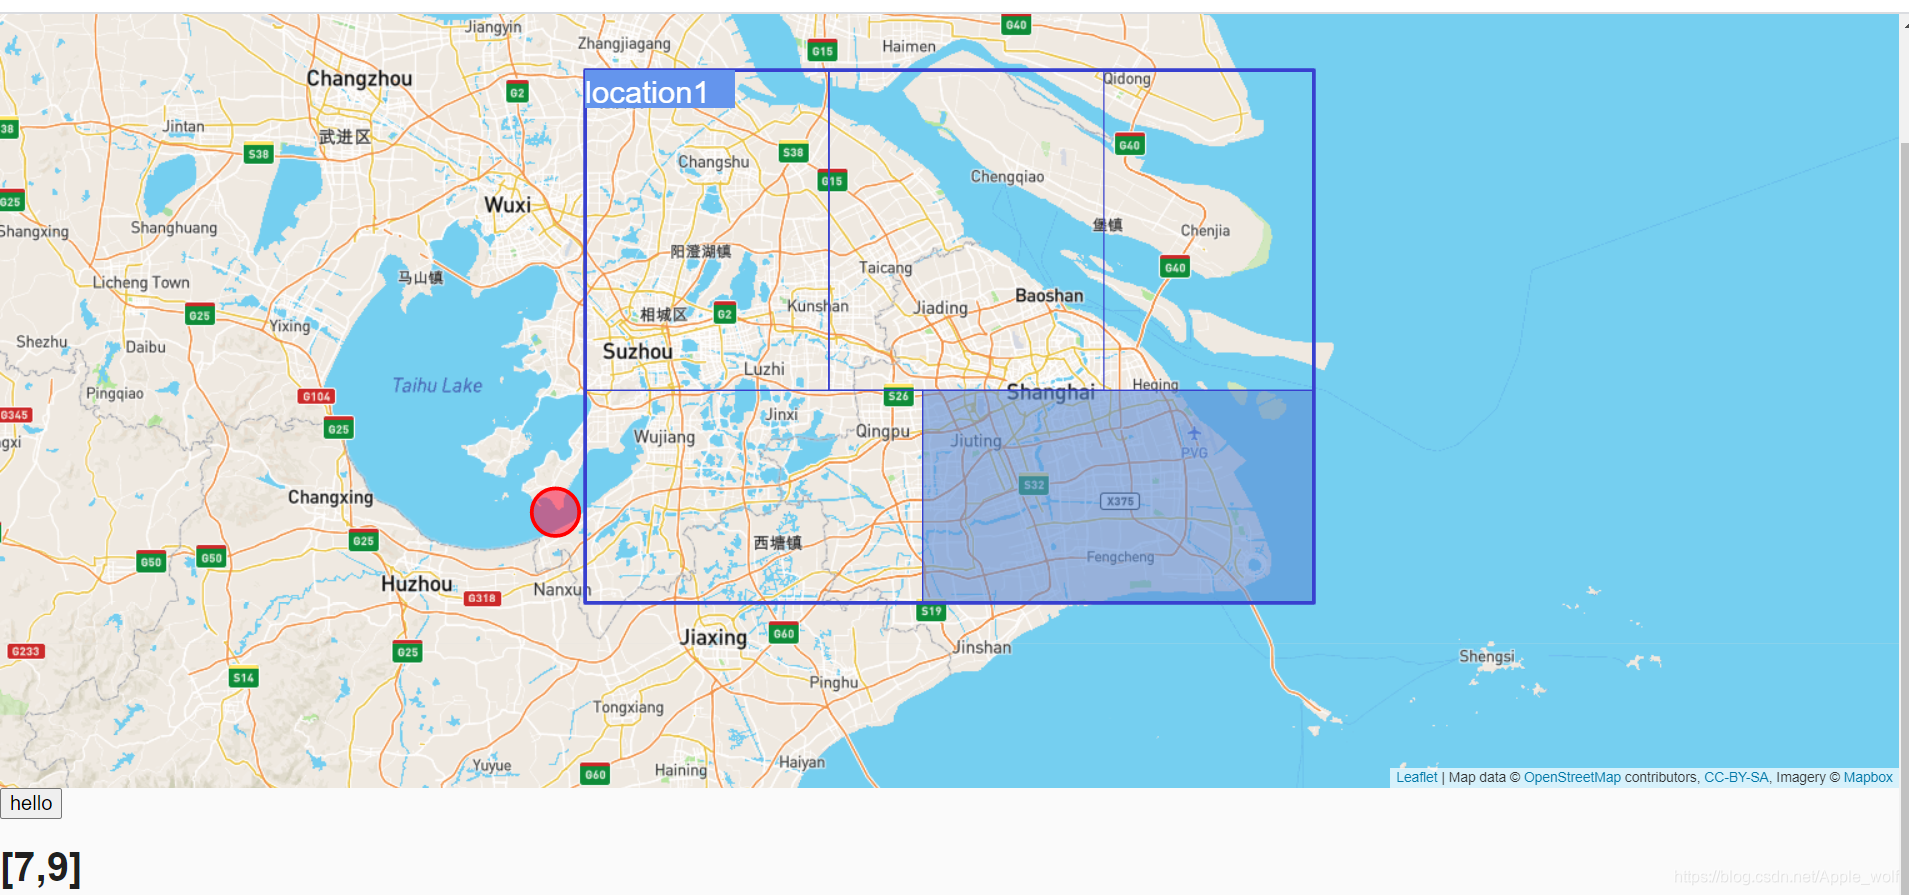
需求:在angularJS的页面中使用OSM添加相应的元素,画线,画圈,画矩形以及网格。
效果:废话不多说,先看效果。如果不是你需要的效果,那么就不要再往下翻浪费时间了。
详细描述:
talk is cheap, show me code
<html ng-app="myApp">
<head>
    <link href="https://fonts.googleapis.com/icon?family=Material+Icons" rel="stylesheet">
    <link rel="stylesheet" href="https://ajax.googleapis.com/ajax/libs/angular_material/1.1.12/angular-material.min.css">
    <link rel="stylesheet" href="https://unpkg.com/leaflet@1.5.1/dist/leaflet.css"
          integrity="sha512-xwE/Az9zrjBIphAcBb3F6JVqxf46+CDLwfLMHloNu6KEQCAWi6HcDUbeOfBIptF7tcCzusKFjFw2yuvEpDL9wQ=="
          crossorigin=""/>

    <script src="https://unpkg.com/leaflet@1.5.1/dist/leaflet.js"
            integrity="sha512-GffPMF3RvMeYyc1LWMHtK8EbPv0iNZ8/oTtHPx9/cc2ILxQ+u905qIwdpULaqDkyBKgOaB57QTMg7ztg8Jm2Og=="
            crossorigin=""></script>
    <style>
        #mapid {
            height: 100%;
            width: 100%;

        }
        .my-div-icon{
            font-size:25px;
            background:#6495ED;
            width:120px;
            height: 30px;
            color:white;
        }
    </style>
</head>
    <meta charset="utf-8">
    <meta http-equiv="X-UA-Compatible" content="IE=edge">
    <title>My AngularJS App</title>
    <meta name="description" content="">
    <meta name="viewport" content="width=device-width, initial-scale=1">
    <link rel="stylesheet" href="../app.css">
    <link href="../lib/angular-material/angular-material.css" rel="stylesheet">
</head>

<body ng-cloak ng-controller="myController">

<div id="mapid" >
</div>
<div id="my-div-icon" class="my-div-icon" ng-if="false">

</div>
<div>
    <button ng-click="ff()">hello</button>
</div>
<div ng-if="response[0].failedGrids.length > 0">
    <h1>{{response[0].failedGrids}}</h1>
</div>
<script>
</script>


<script src="https://cdn.bootcss.com/angular.js/1.7.8/angular.js"></script>
<script src="https://cdn.bootcss.com/angular.js/1.7.8/angular-animate.js"></script>
<script src="https://cdn.bootcss.com/angular.js/1.7.8/angular-aria.js"></script>
<script src="https://cdn.bootcss.com/angular-material/1.1.17/angular-material.js"></script>src="https://cdn.bootcdn.net/ajax/libs/jquery/3.5.1/jquery.min.js"></script>
<script src="../app.js"></script>
<script src="../view12-map/view12.js"></script>

</body>
</html>
JS
'use strict';
var myApp = angular.module('myApp', ['ngMaterial', 'ngAria', 'ngMessages']);
myApp.controller('myController', function ($scope, $compile,$timeout) {
$scope.user = "UU";
$scope.response = [{
"locationId": "location1",
"topLat": 31.828153,
"bottomLat": 30.828153,
"leftLon": 120.466008,
"rightLon": 122.066008,
"grids": [{
"gridId": 1,
"locationId": "location1",
"topLat": 31.828153,
"bottomLat": 31.228153,
"leftLon": 120.466008,
"rightLon": 121.0008,
"status": "success"
}, {
"gridId": 2,
"locationId": "location1",
"topLat":31.828153,
"bottomLat": 31.228153,
"leftLon": 121.0008,
"rightLon":121.606,
"status": "success"
}, {
"gridId": 3,
"locationId": "location1",
"topLat": 31.828153,
"bottomLat": 31.228153,
"leftLon": 121.0008,
"rightLon": 122.066008,
"status": "success"
}, {
"gridId": 4,
"locationId": "location1",
"topLat": 31.228153,
"bottomLat": 30.828153,
"leftLon": 120.466008,
"rightLon": 121.206,
"status": "success"
}, {
"gridId": 5,
"locationId": "location1",
"topLat": 31.228153,
"bottomLat": 30.828153,
"leftLon": 121.206,
"rightLon": 122.066008,
"status": "failed"
}],
"failedGrids": [7,9]
}];
$timeout(function(){
var myMap = L.map('mapid').setView([$scope.response[0].topLat,$scope.response[0].leftLon], 11);
$scope.myMap = myMap;
L.tileLayer('https://api.mapbox.com/styles/v1/{id}/tiles/{z}/{x}/{y}?access_token={accessToken}', {
attribution: 'Map data © <a href="https://www.openstreetmap.org/">OpenStreetMap</a> contributors, <a href="https://creativecommons.org/licenses/by-sa/2.0/">CC-BY-SA</a>, Imagery © <a href="https://www.mapbox.com/">Mapbox</a>',
maxZoom: 18,
id: 'mapbox/streets-v11',
tileSize: 512,
zoomOffset: -1,
accessToken: '自己申请的accessTocken'
}).addTo(myMap);
},400);
$scope.ff = function () {
var myIcon;
angular.forEach($scope.response, function (res) {
var grids = res.grids;
angular.forEach(grids, function (g) {
if (g.status == "success"){
var l2 = L.polyline([
[g.topLat,g.leftLon],
[g.topLat, g.rightLon],
[g.bottomLat, g.rightLon],
[g.bottomLat, g.leftLon],
[g.topLat,g.leftLon]
],{color:'#3840CF', weight: 1}).addTo($scope.myMap);
}else if (g.status == "failed"){
var ll = L.polygon([
[g.topLat,g.leftLon],
[g.topLat, g.rightLon],
[g.bottomLat, g.rightLon],
[g.bottomLat, g.leftLon],
[g.topLat,g.leftLon]
],{color:'#3840CF', weight: 1,fillColor:'#5b8cd6',fillOpacity:0.6,}).addTo($scope.myMap);
}
});
console.log(res.locationId);
var line = L.polyline([
[res.topLat,res.leftLon],
[res.topLat, res.rightLon],
[res.bottomLat,res.rightLon],
[res.bottomLat, res.leftLon],
[res.topLat,res.leftLon]
],{color:'#3840CF',fillColor:'#3840CF', weight:3}).addTo($scope.myMap);
myMap.fitBounds(line.getBounds());
myIcon = L.divIcon({
html: res.locationId,
className: 'my-div-icon',
iconSize:{width: 20, height: 40},
});
var marker = L.marker([res.topLat, res.leftLon], {icon: myIcon,title: "Localtion Name: " + res.locationId + "\n Last Synchronization Status: " + res.status + "\n Failed Grids: [" + res.failedGrids.join(',') + "]"}).addTo($scope.myMap);
var circle = L.circle([31, 120.4], {
color: 'red',
fillColor: '#f03',
fillOpacity: 0.5,
radius: 5000
}).addTo($scope.myMap);
});
};
});
##注意:
如果在加载地图的时候,不是使用$timeout()方法的话,会很容易造成地图只显示在屏幕左上角的一点点部分,如图:
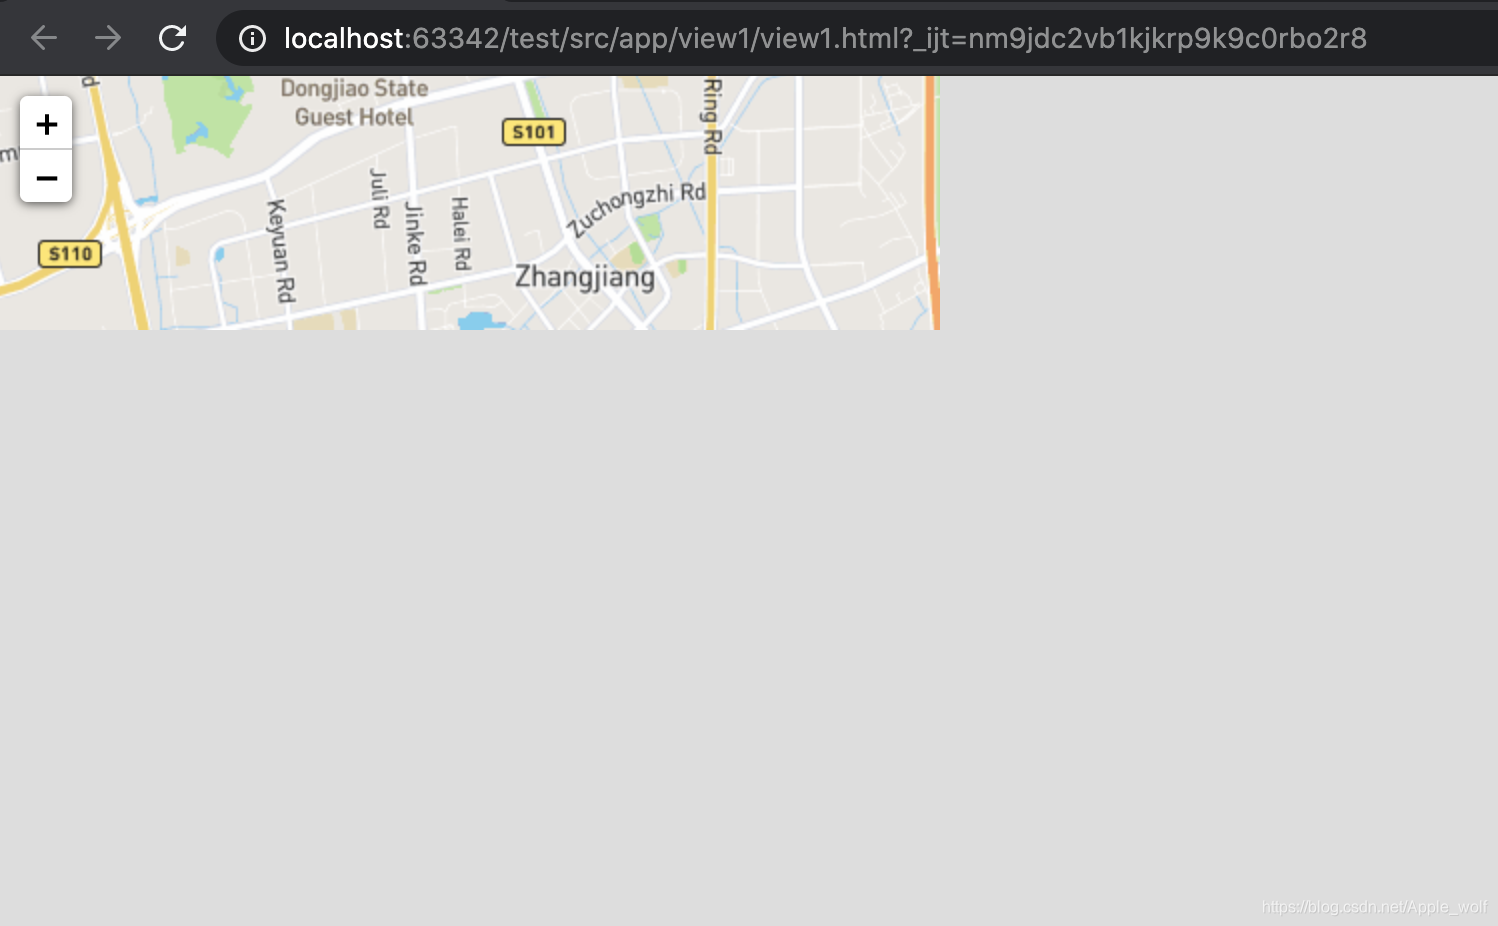
这是由于在放置地图的div在没有渲染完成就已经开始加载地图了,而加载地图又是根据所在的div的中心点为地图的中心点,然后加载地图。由于此时的div未加载完成,因此其中心点是(0,0)的地方,也就是屏幕左上角,所以地图是残缺的,像锯齿一样的形状。
解决这个问题有三个方法:
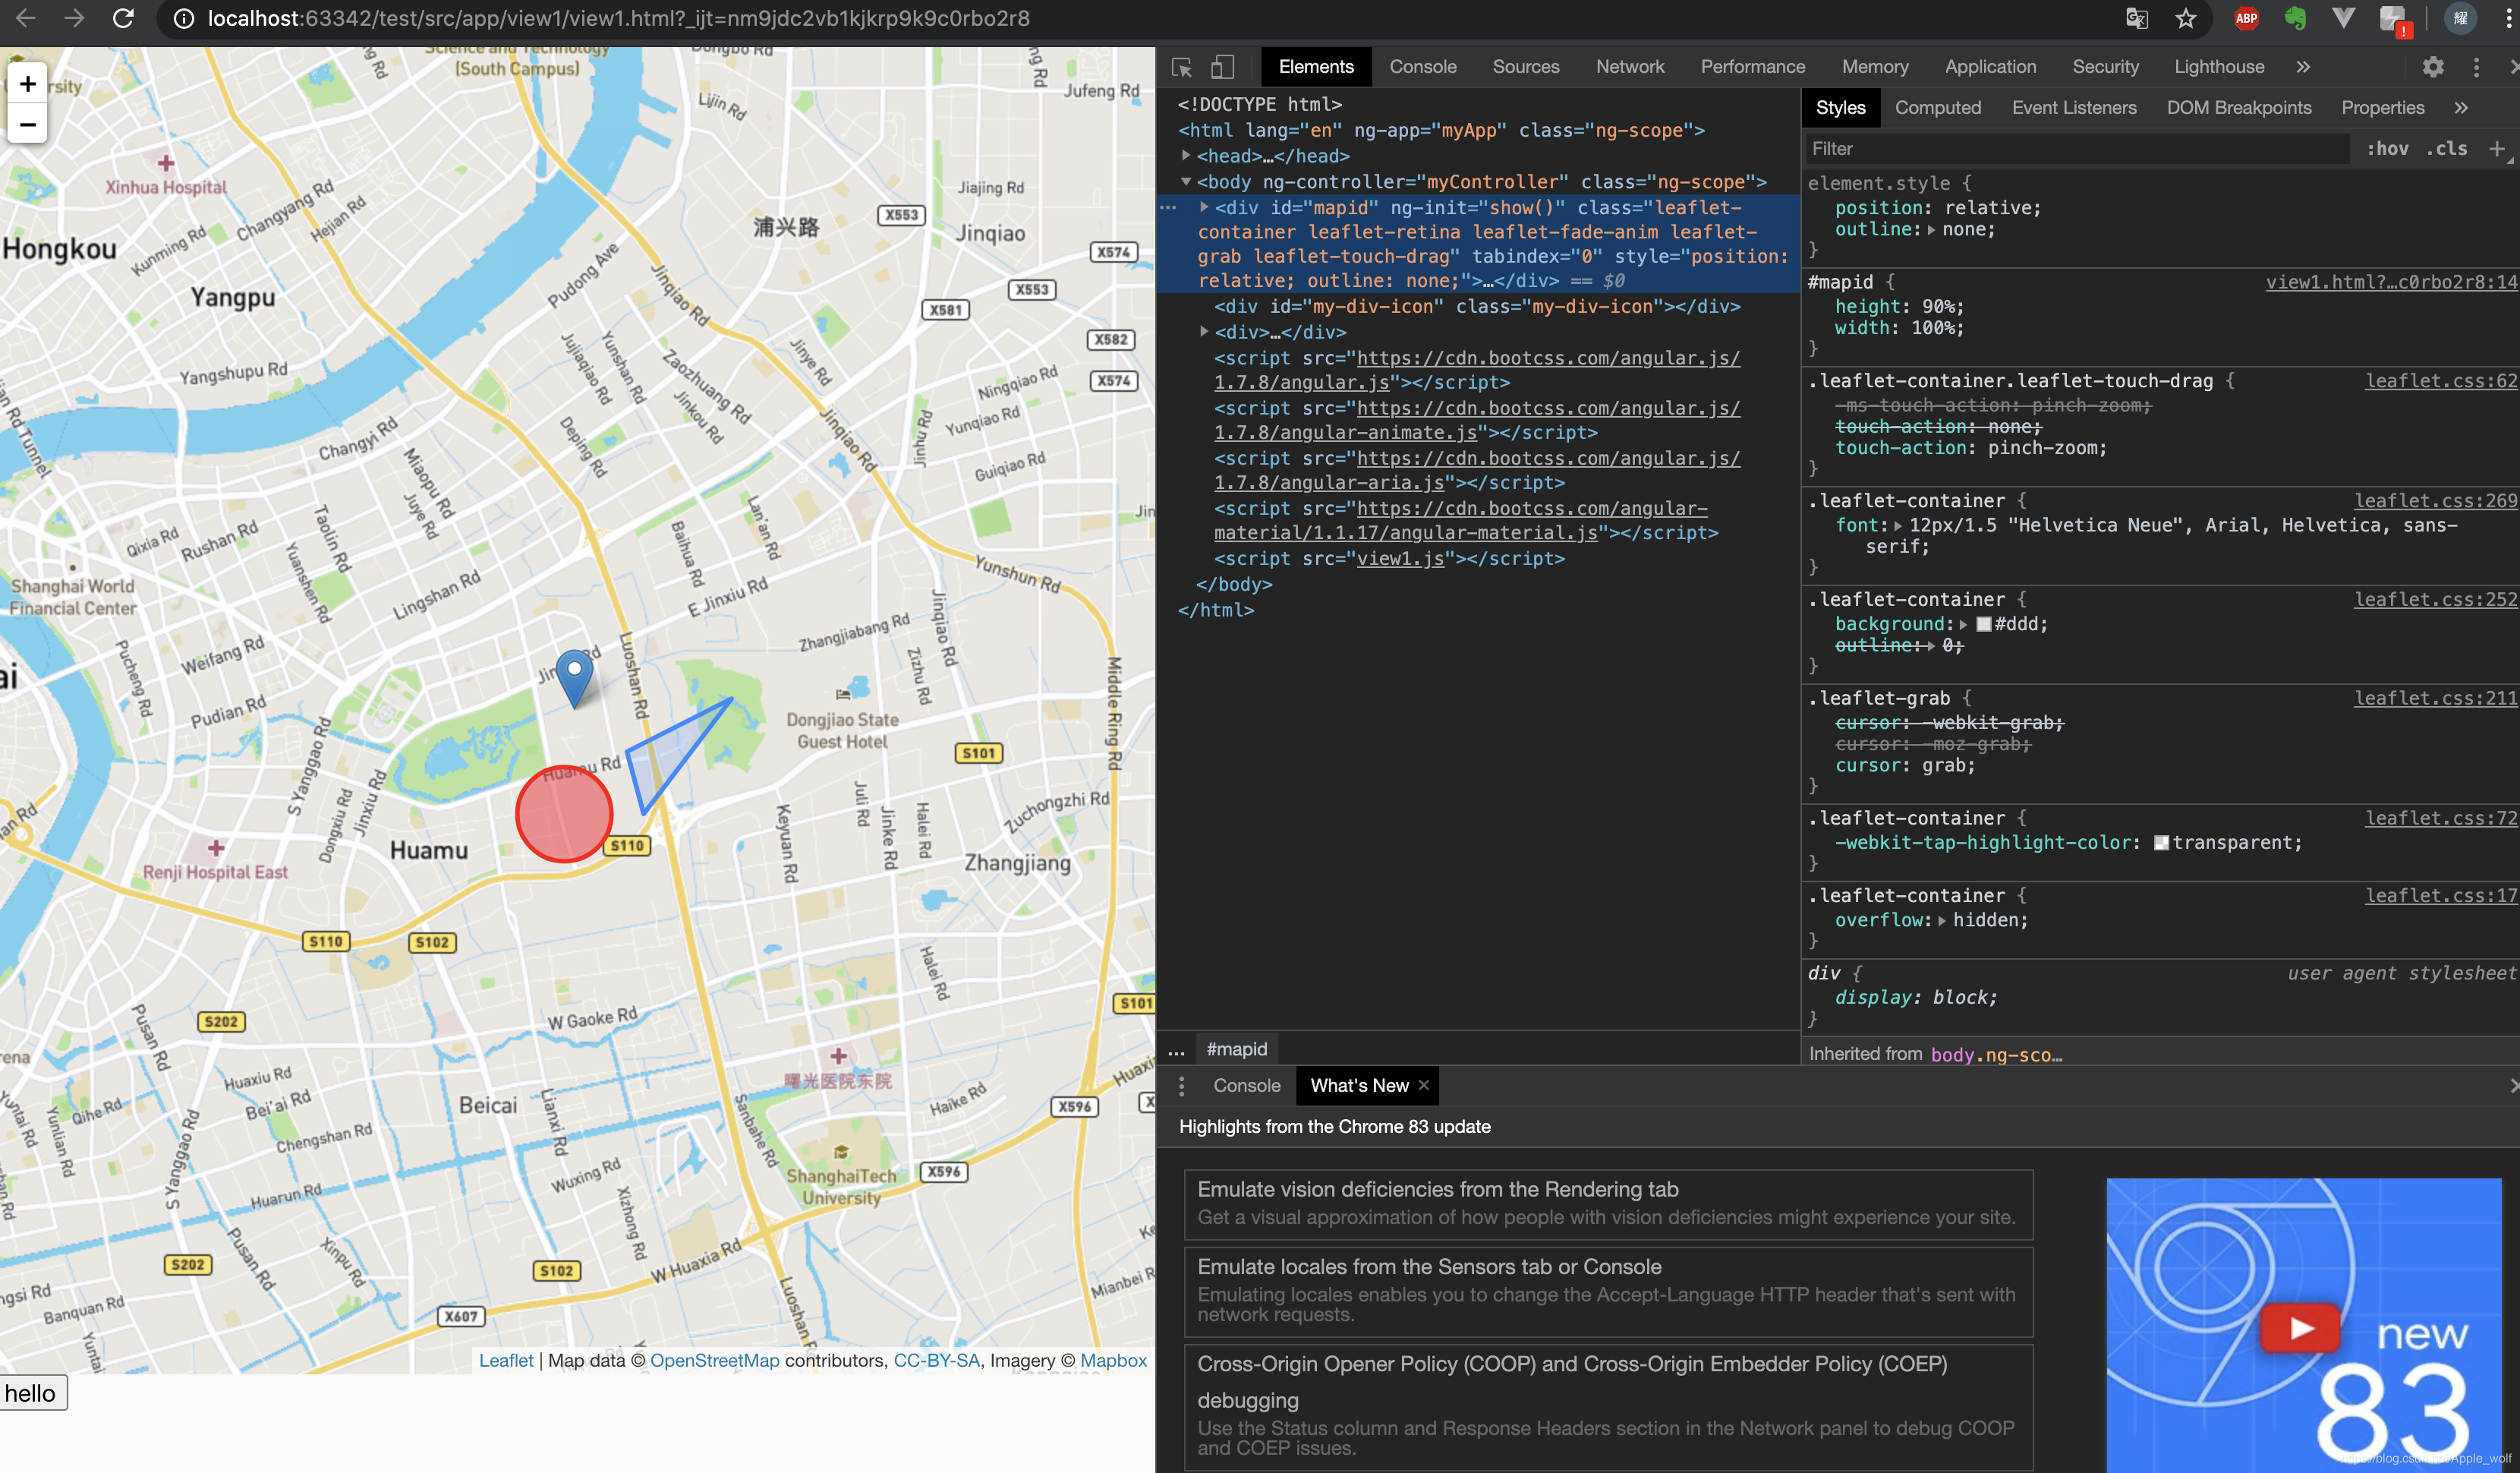
- 1、按F12进入调试,此时地图会自动调整。
- 2、调用map.invalidateSize(true)方法。
当div的大小发生变化时,每次都调用一下该方法。
$scope.show = function() {
	myMap.invalidateSize(true);
}
- 3、使用$timeout()方法
这个正是上面例子中使用的方法,在400ms之后再加载地图,此时的div已经加载完成了,就不会出现地图缺失的问题了。


 700
700


 被折叠的 条评论
为什么被折叠?
被折叠的 条评论
为什么被折叠?
 到【灌水乐园】发言


