


1.node-exporter部署
node exporter是Prometheus的收集数据的组件,用于收集linux内核暴露的硬件和操作系统指标,如:CPU、内存、磁盘等信息,用Go编写,不存在任何第三方依赖,所以只需要下载解压即可运行。收集当前机器的系统数据除node_exporter外,官方还提供consul、memcached、haproxy、mysqld等exporter
1.1下载安装
在需要监控的所有节点主机上进行安装
wget https://github.com/prometheus/node_exporter/releases/download/v1.6.1/node_exporter-1.6.1.linux-amd64.tar.gz

tar -zxf node_exporter-1.6.1.linux-amd64.tar.gz
mv node_exporter-1.6.1.linux-amd64 /usr/local/node_exporter

# 编写快速启动文件
vim /etc/systemd/system/node_exporter.service
[Unit]
Description=Prometheus Node Exporter
After=network.target
[Service]
Type=simple
ExecStart=/usr/local/node_exporter/bin/node_exporter
Restart=on-failure
[Install]
WantedBy=multi-user.target


systemctl daemon-reload
systemctl start node_exporter.service
systemctl status node_exporter.service1.2Prometheus 采集 Node 数据
[root@prometheus ~]#vim /usr/local/prometheus/conf/prometheus.yml
[root@prometheus ~]#grep -Ev '^ *#|^$' /usr/local/prometheus/conf/prometheus.yml
global:
 scrape_interval: 15s # Set the scrape interval to every 15 seconds. Default is
every 1 minute.
 evaluation_interval: 15s # Evaluate rules every 15 seconds. The default is
every 1 minute.
alerting:
 alertmanagers:
    - static_configs:
        - targets:
rule_files:
scrape_configs:
  - job_name: "prometheus"
    static_configs:
      - targets: ["localhost:9090"]
  - job_name: '123'   #添加以下行,指定监控的node exporter节点
    static_configs:
    - targets: ['192.168.255.123:9100']

#属性解析:
#新增一个job_name 和 static_configs的属性
#targets 就是前面基本概念中提到的instance,格式就是"ip:port"

#检查语法
[root@prometheus ~]#promtool check config
/usr/local/prometheus/conf/prometheus.yml

#重启prometheus服务: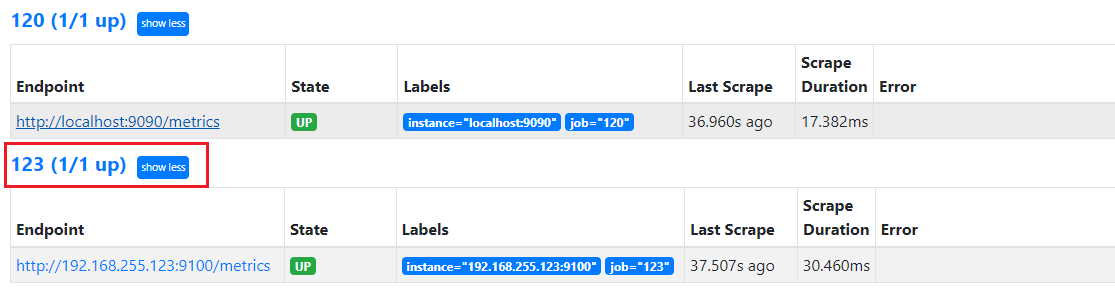
[root@prometheus ~]#systemctl restart prometheus1.3Prometheus 验证 Node 节点状态
2.blackbox-exporter部署
在prometheus部署机上安装
blackbox-exporter是Prometheus官方提供的一个黑盒监控解决方案,可以通过HTTP、HTTPS、DNS、ICMP、TCP和gRPC方式对目标实例进行检测。可用于以下使用场景:
- HTTP/HTTPS:URL/API可用性检测
- ICMP:主机存活检测
- TCP:端口存活检测
- DNS:域名解析
黑盒监控和白盒监控:
- 黑盒监控,关注的是实时状态,一般都是正在发生的事件,比如网站访问不了、磁盘无法写入数据等。即黑盒监控的重点是能对正在发生的故障进行告警。常见的黑盒监控包括HTTP探针、TCP探针等用于检测站点或者服务的可访问性,以及访问效率等。
- 白盒监控,关注的是原因,也就是系统内部的一些运行指标数据,例如nginx响应时长、存储I/O负载等
2.1下载安装blackbox-exporter
[root@120 ~]# wget https://github.com/prometheus/blackbox_exporter/releases/download/v0.24.0/blackbox_exporter-0.24.0.linux-amd64.tar.gz

[root@120 ~]# tar -zxf blackbox_exporter-0.24.0.linux-amd64.tar.gz
[root@120 ~]# mv blackbox_exporter-0.24.0.linux-amd64 /usr/local/blackbox_exporter

[root@120 ~]# cat blackbox.yml
modules:
  tcp_connect:
    prober: tcp


#服务添加到系统配置
[root@120 ~]#vim /usr/lib/systemd/system/blackbox.service
#配置如下
[Unit]
Description=blackbox_exporter
After=network.target

[Service]
User=root
Type=simple
ExecStart=/apps/app/blackbox_exporter-0.24.0/blackbox_exporter --config.file=/apps/app/blackbox_exporter-0.24.0/blackbox.yml
Restart=on-failure

[Install]
WantedBy=multi-user.target

#服务自启动
[root@120 ~]# systemctl enable blackbox.service

#启动服务
[root@120 ~]# systemctl start blackbox.service
blackbox-exporter的配置文件使用默认的即(/usr/local/blackbox_exporter/blackbox.yml),文件里定义了进行目标检测时要使用的模块和模块参数。至于要检测哪些目标是定义在Prometheus 的Job配置中。
2.3Prometheus 实现端口监控
修改Prometheus配置,添加Job,内容如下:
- job_name: '端口监控'
metrics_path: /probe
params:
module: [tcp_connect] # blackbox_exporter 的模块
static_configs:
- targets: ['192.168.255.123:3306']
labels: # 自定义的一些字段,方便后续处理
instance: 'mysql'
group: 'web'
relabel_configs:
- source_labels: [__address__]
target_label: __param_target
- target_label: __address__
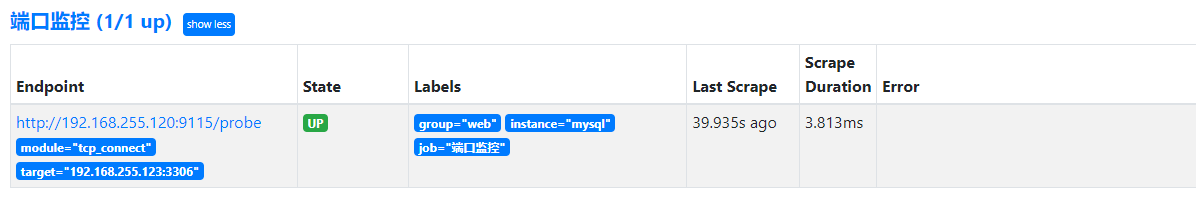
replacement: 192.168.255.120:9115测试效果:
可以看到prometheus中已经检测到blackbox_exporter
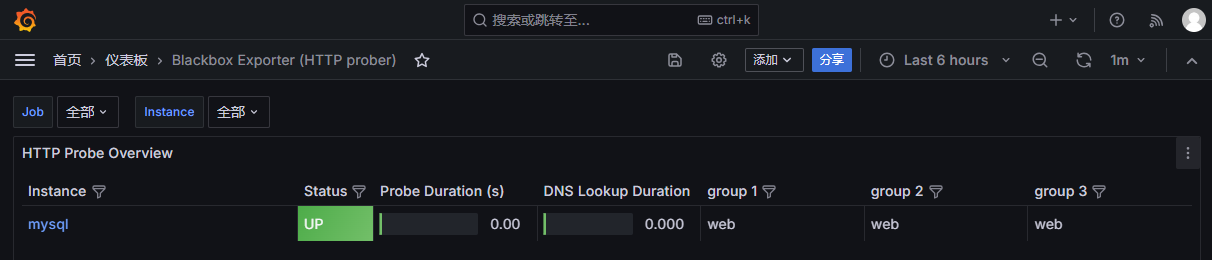
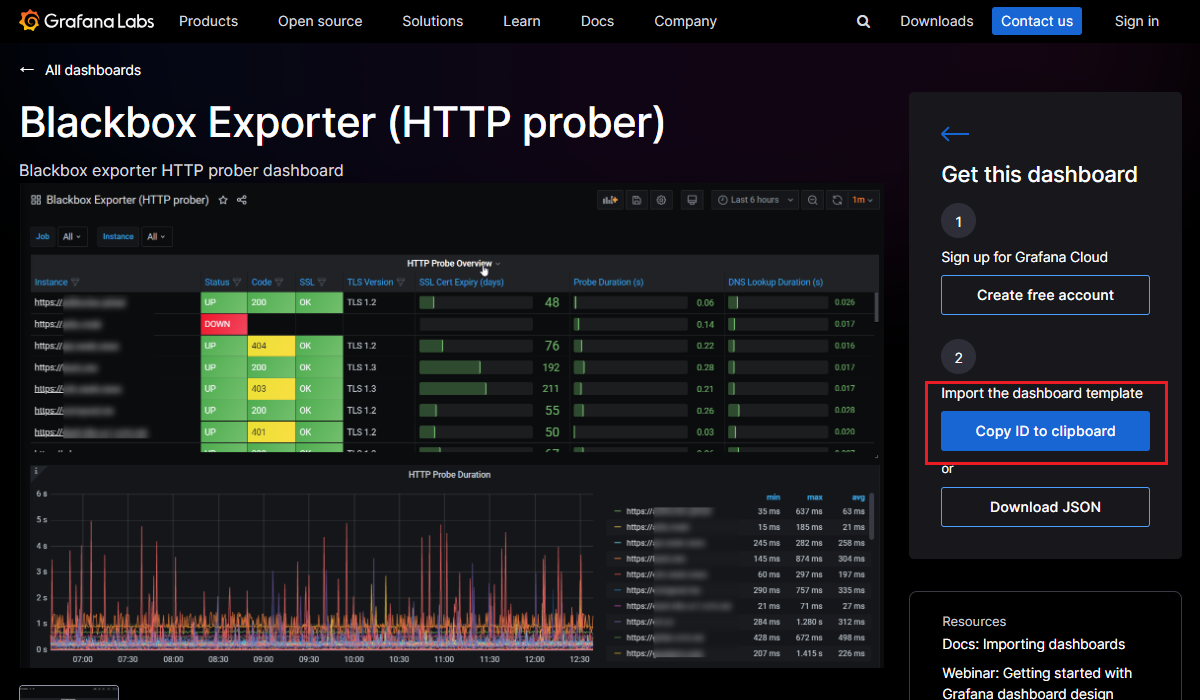
对应的来到granfa中,导入blackbox_exporter的模板,可以看到mysql状态为up。
2.4Prometheus 实现url监控
修改Prometheus配置,添加Job,内容如下:
  - job_name: http-status
    metrics_path: /probe	#指定指标接口
    params:	#指定查询参数,在Prometheus向target发送Get请求获取指标数据时,会传递到url上
      module: [http_2xx]
    static_configs:
    - targets:
      - http://www.baidu.com
      - http://www.jd.com
      labels:	#自定义标签,附加在target上
        group: web
    relabel_configs:
    #将标签__address__的值赋值给__param_target标签,以__param开头的标签也会作为查询参数传递Prometheus的Get请求,作用和上面的params配置类似
    - source_labels: [__address__]
      target_label: __param_target
    #将标签__param_target的值赋值给instance标签
    - source_labels: [__param_target]
      target_label: instance
    #将标签__address__的值修改给balckbox-expoter的地址
    - target_label: __address__
      replacement: 192.168.255.120:9115
   #以 http://www.baidu.com为例,最后其对应target的地址就是http://192.168.255.120:9115/probe?module=http_2xx&target=http://www.baidu.com
2.5Prometheus 实现ICMP监控
  - job_name: icmp-status
    metrics_path: /probe
    params:
      module: [icmp]
    static_configs:
    - targets:
      - 192.168.255.123
      - 192.168.255.124
      labels:
        group: icmp
    relabel_configs:
    - source_labels: [__address__]
      target_label: __param_target
    - source_labels: [__param_target]
      target_label: instance
    - target_label: __address__
      replacement: 192.168.255.120:9115
3.grafana数据展示
Grafana是一个开源的度量分析与可视化套件,它基于go语言开发。经常被用作基础设施的时间序列数
据和应用程序分析的可视化,应用场景非常多。尤其是Grafana最具特色的就是各种各样漂亮的可视化界面,在Grafana提供了各种定制好的,可以直接 给各种软件直接使用的展示界面模板, 默认监听于TCP协议的3000端口,支持集成其他认证服务,且能够通过/metrics输出内建指标。
可以在https://grafana.com/dashboards/ 页面查询到我们想要的各种dashboard模板。
3.1grafana部署
#安装软件
[root@grafana ~]#wget https://dl.grafana.com/oss/release/grafana-11.1.4-1.x86_64.rpm
[root@grafana ~]#yum -y localinstall grafana-11.1.4-1.x86_64.rpm


#启动服务
[root@grafana ~]#systemctl enable --now grafana-server
[root@grafana ~]#systemctl status   grafana-server.service

#查看状态
[root@grafana ~]#netstat -anpt | grep 3000
tcp6      0      0 :::3000         :::*       LISTEN      27630/grafana
3.2配置prometheus数据源
登录:http://部署机器ip:3000/
首次登录时,默认用户名为admin,密码为admin。请务必在登录后修改默认密码以确保安全。
3.2.1 修改默认系统语言
为了便于学习,我们可以先修改grafana系统语言为中文
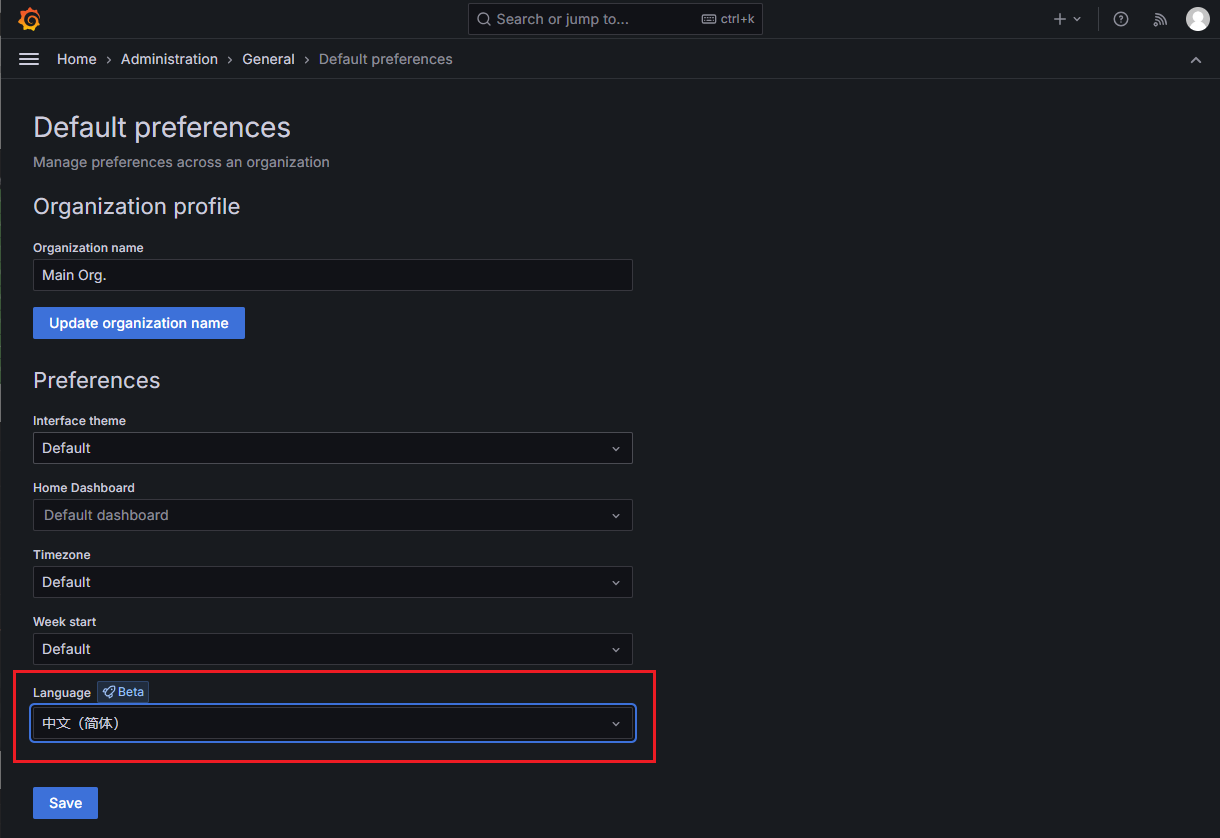
点击save即可
3.2.2配置数据源
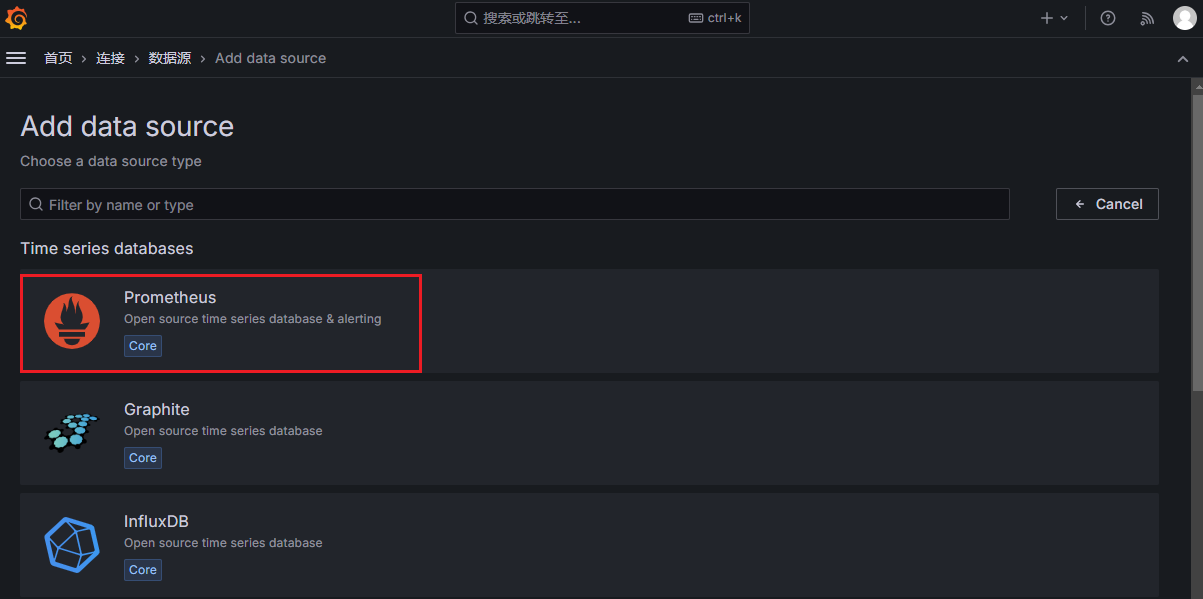
点击“首页-连接-数据源-添加新数据源”

选择“Prometheus”
#注意:这里默认地址无法使用,将Prometheus的地址(192.138.255.120:9090或者localhost:9090)输入进去
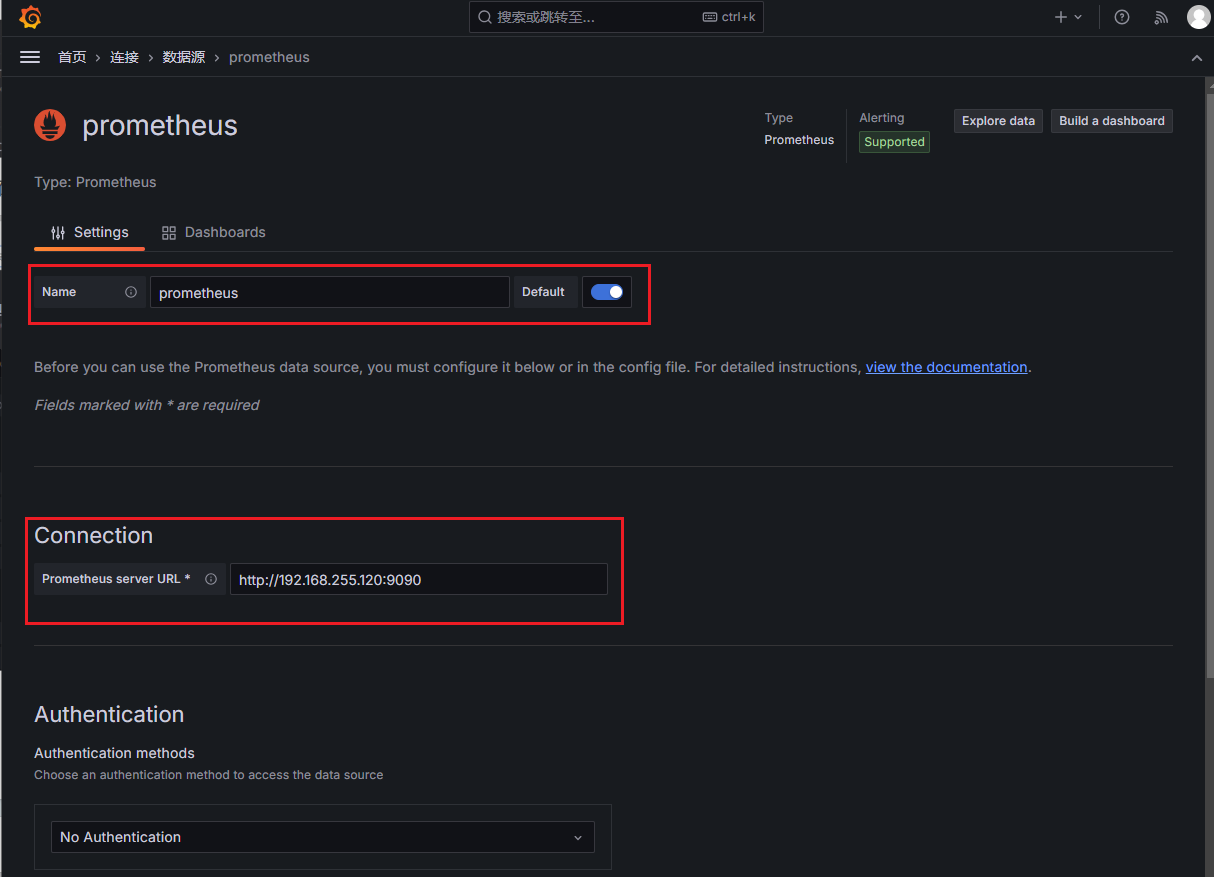
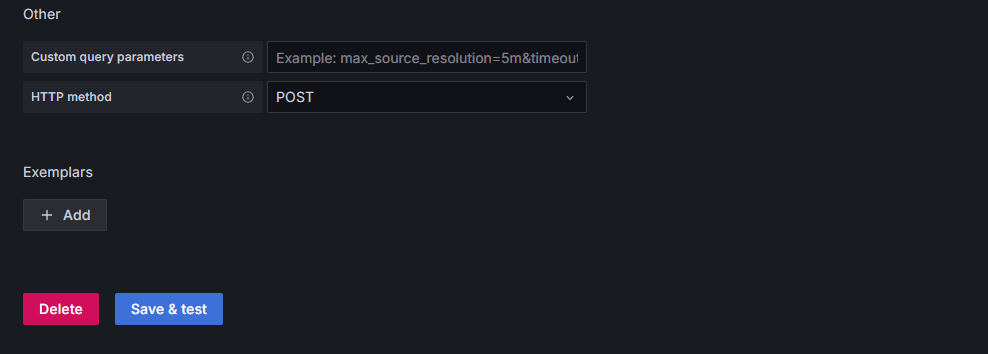
其它信息不用设置,点击最下面的"Save & Test" 查看效果

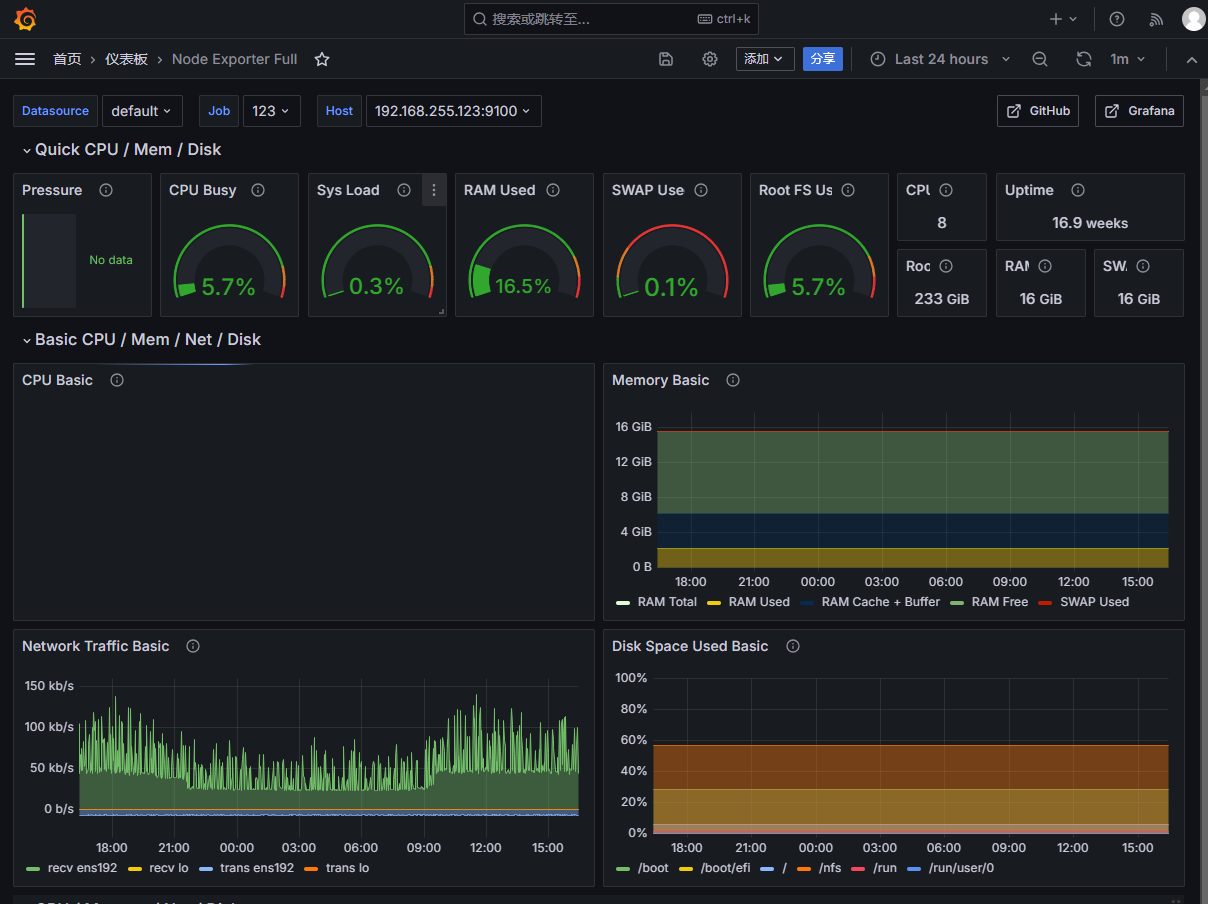
3.2.3导入模板展示数据
登录官网查找模板 Grafana dashboards | Grafana Labs
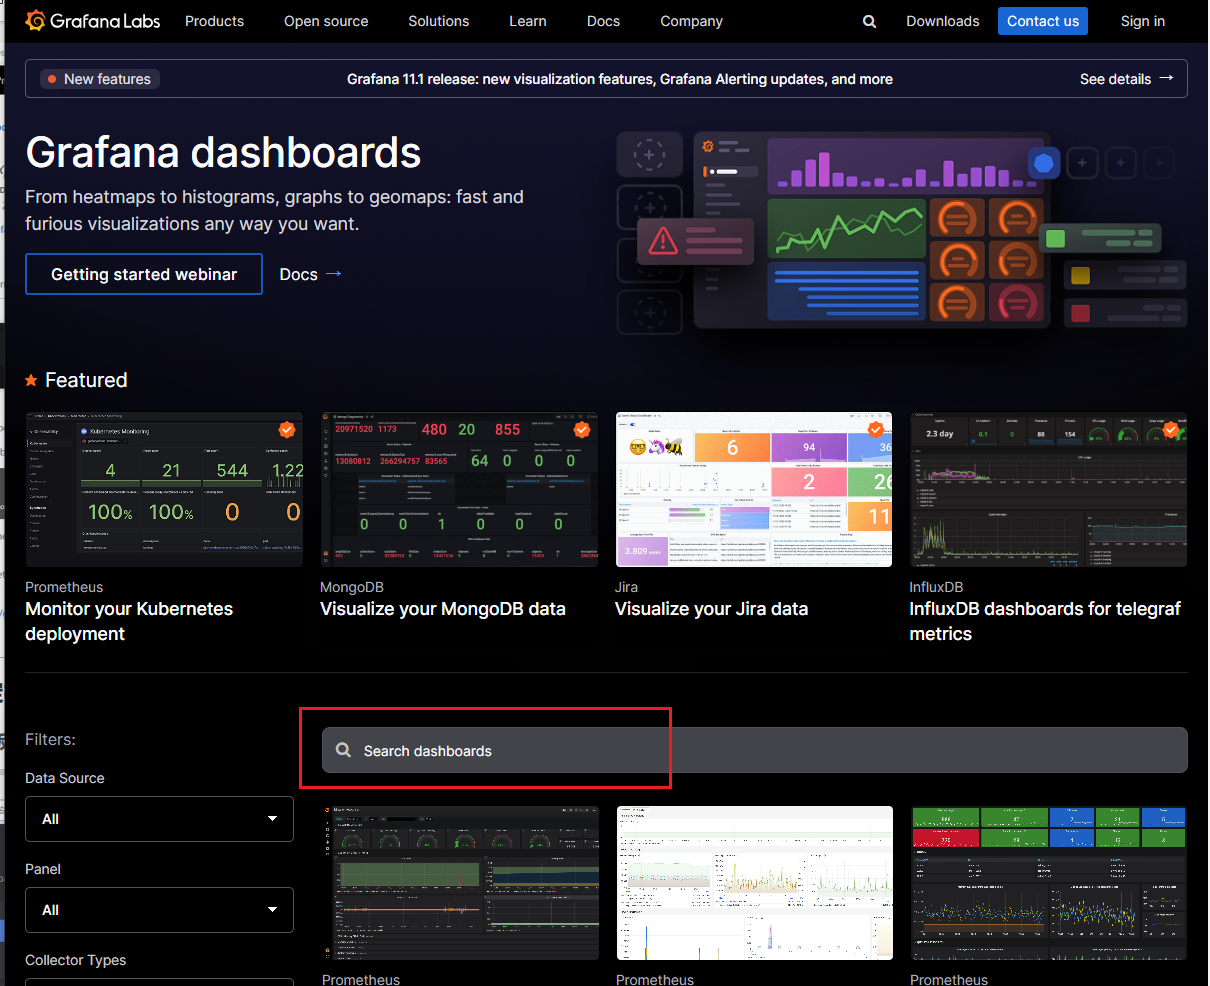
复制模板ID
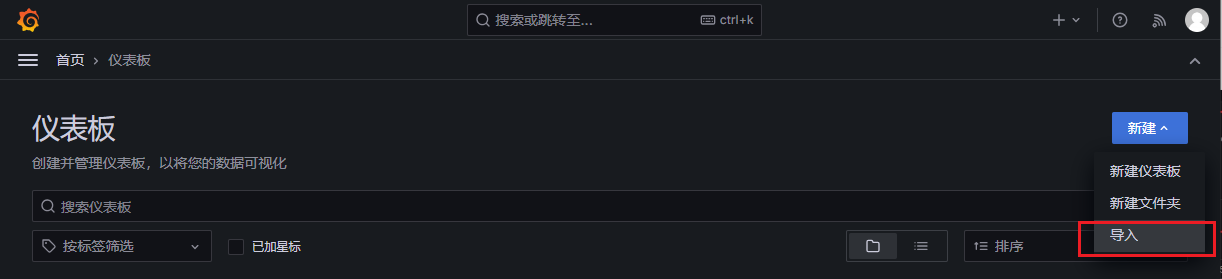
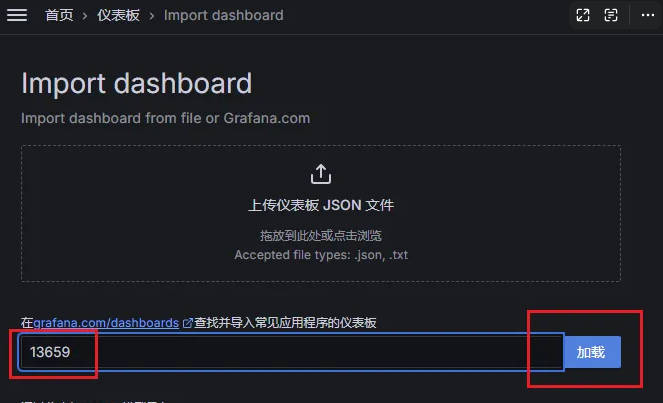
导入到仪表盘
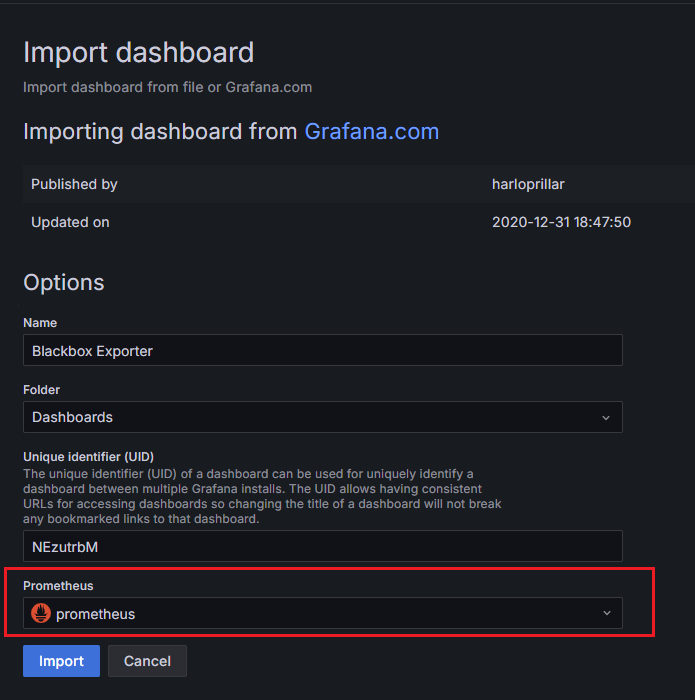
选择数据源
查看效果
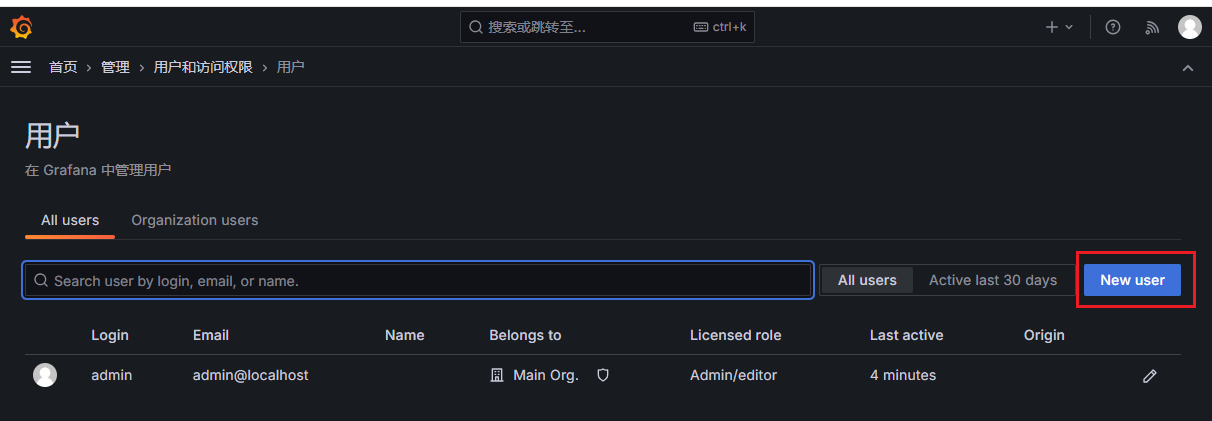
3.3用户管理
默认情况下,Prometheus没有内置的用户认证或授权机制。它主要依赖于网络层面的安全措施,比如防火墙规则、VPN、或使用安全的网络环境(例如Kubernetes集群内部网络)来限制访问。Grafana默认情况下是有用户登录验证的。它提供了用户账户管理、登录认证、密码策略、组织和角色的访问控制等功能。所以一般prometheus有着特定的访问限制,我们需要通过grafana进行访问或对外公布。
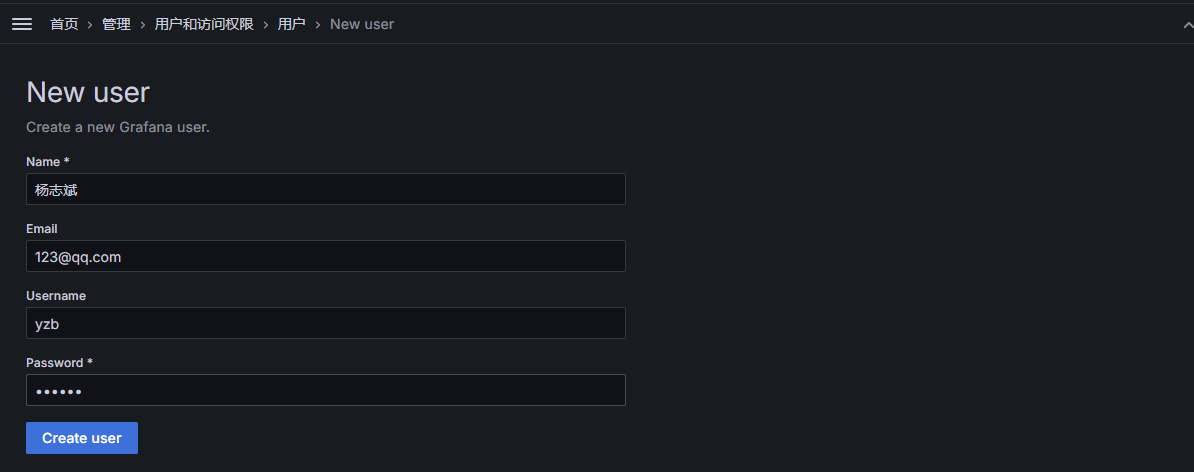
创建用户
设置密码
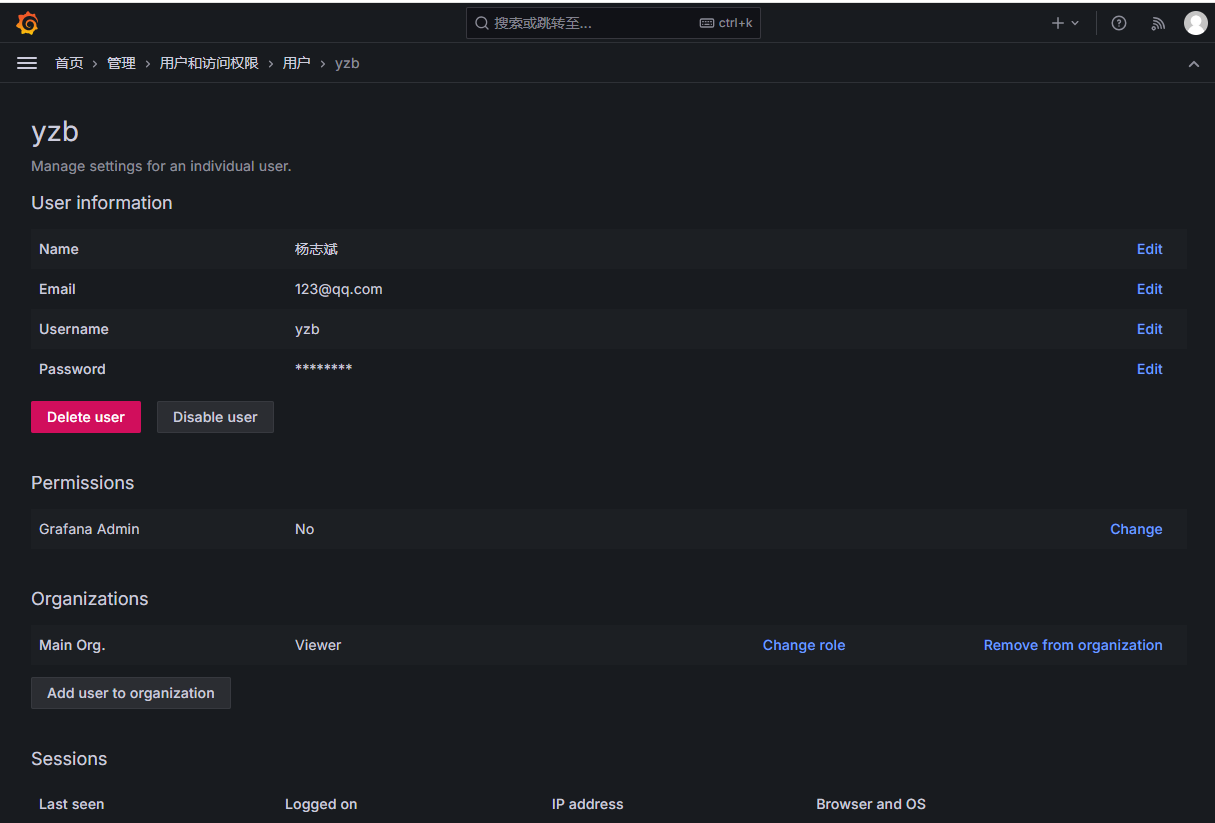
分配权限,可以授予admin权限
4.Pushgateway 采集自定义数据
虽然有很多的Exporter提供了丰富的数据,但生产环境中仍需要采集用户自定义的数据,可以利用Pushgateway实现 。Pushgateway 是另⼀种采⽤客户端主动推送数据的⽅式,也可以获取监控数据的prometheus 插件 。与exporter 不同, Exporter 是被动采集数据 ,它是可以单独运⾏在 任何节点上的插件(并不⼀定要在被监控客户端)、⽤户⾃定义的脚本或程序将需要监控的数据推送给 Pushgateway ,然后prometheus server再向pushgateway拉取数据 。
Pushgateway 缺点
- Pushgateway 会形成⼀个单点瓶颈,假如好多个应用同时发送给⼀个pushgateway的进程,如果这 个进程没了,那么监控数据也就无法获取了。
- Pushgateway 并不能对发送过来的数据进⾏更智能的判断,假如脚本中间采集出问题,那么有问题的 数据 pushgateway⼀样照单全收发送给prometheus。
4.1安装 Pushgateway
[root@prometheus ~]#wget
https://github.com/prometheus/pushgateway/releases/download/v1.4.3/pushgateway-
1.4.3.linux-amd64.tar.gz
[root@prometheus ~]#tar xf pushgateway-1.4.3.linux-amd64.tar.gz -C /usr/local/
[root@prometheus ~]#ln -s pushgateway-1.4.3.linux-amd64/ pushgateway
[root@prometheus ~]#mkdir /usr/local/pushgateway/bin
[root@prometheus ~]#mv /usr/local/pushgateway/pushgateway  /usr/local/pushgateway/bin
[root@prometheus ~]#ln -s /usr/local/pushgateway/bin/pushgateway /usr/local/bin/4.2配置 Prometheus 收集 Pushgateway 数据
[root@prometheus ~]#vim /usr/local/prometheus/conf/prometheus.yml
  - job_name: "pushgateway"
   static_configs:
     - targets:
- "10.0.0.100:9091"4.3配置客户端发送数据给 Pushgateway
#下面为发送一次数据,如果想周期性发送,可以通过cron或脚本循环实现
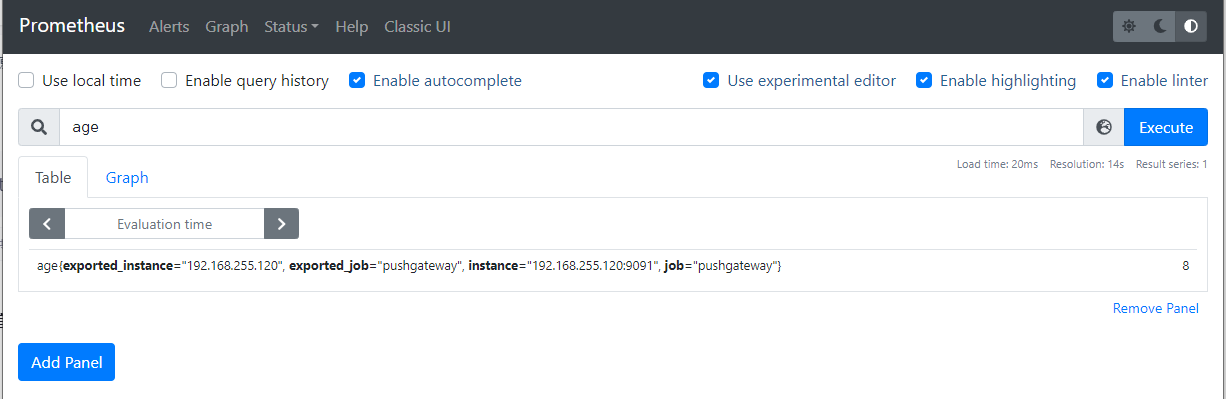
[root@120 prometheus]#echo "age 8" | curl --data-binary @- http://192.168.255.120:9091/metrics/job/pushgateway/instance/`hostname -I`
#说明
192.168.255.120:9091 #安装为Pushgateway主机的IP和端口
pushgateway #Prometheus的job名称
`hostname -I` #取当前主机的IP为instance名称
#编定自定义的metric的脚本
[root@120 prometheus]#vim pushgateway_metric.sh
#!/bin/bash
METRIC_NAME=login_number
METRIC_VALUE="who | wc -l"
PUSHGATEWAY_HOST=192.168.255.120:9091
EXPORTED_JOB=pushgateway
SLEEP_TIME=1
CURL_URL="curl --data-binary @-
http://${PUSHGATEWAY_HOST}/metrics/job/${EXPORTED_JOB}/instance/`hostname -I`"
action() {
while true ;do
VALUE=`eval "$METRIC_VALUE"`
echo "${METRIC_NAME} ${VALUE}" | $CURL_URL
sleep $SLEEP_TIME
done
}
action
[root@120 prometheus]#bash pushgateway_metric.sh4.4验证数据


 280
280

 被折叠的 条评论
为什么被折叠?
被折叠的 条评论
为什么被折叠?
 到【灌水乐园】发言


