


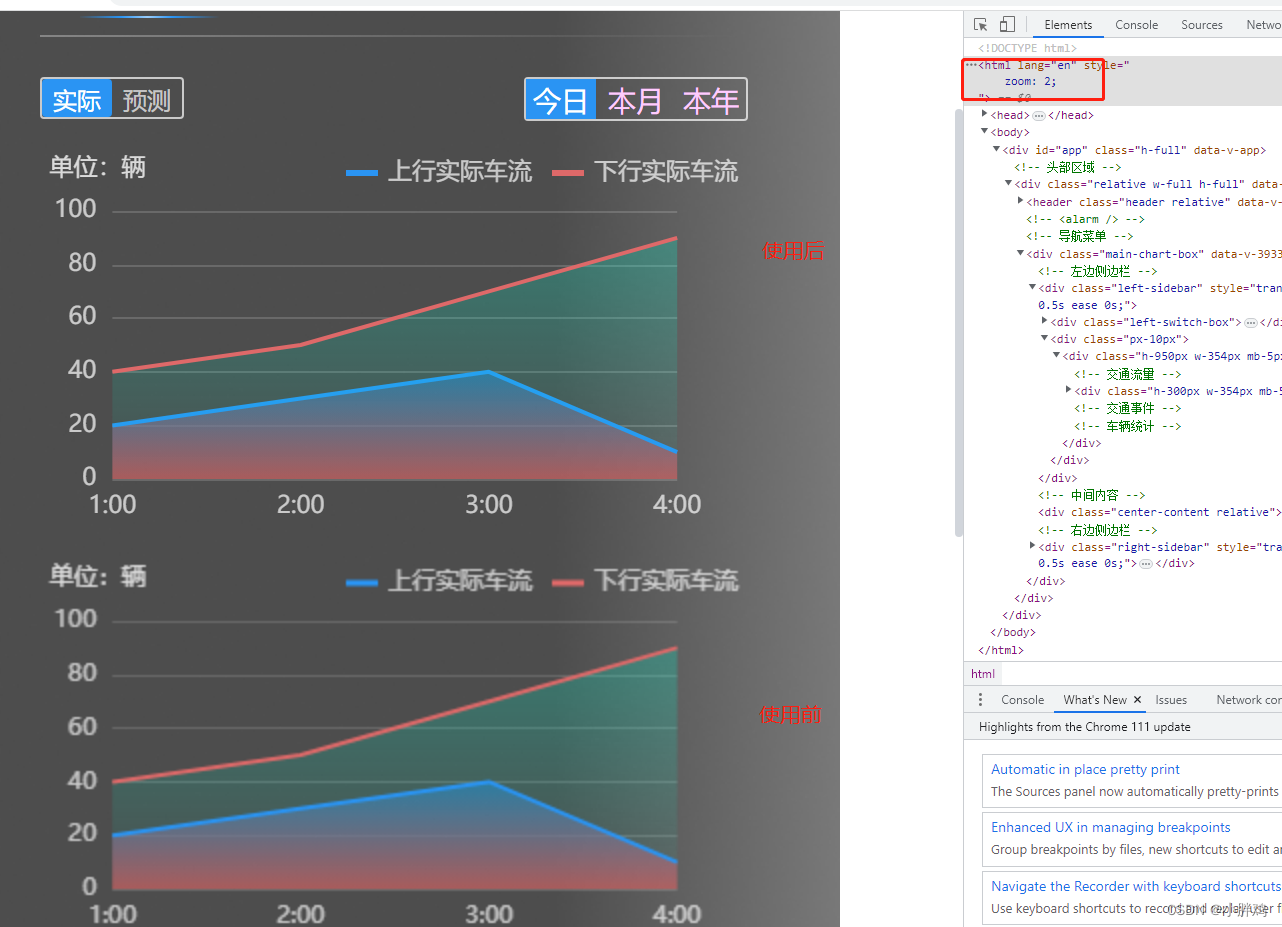
方法1:使用svg渲染,svg渲染出的图表的清晰度高于canvas (我使用感觉效果不好)
var myChart = echarts.init(document.getElementById('chart'), null, {renderer: 'svg'});
方法2:仍然使用canvas渲染,通过调整devicePixelRatio提升清晰度
var myChart = echarts.init(document.getElementById('chart'), null, {devicePixelRatio: 2});
方法3:仍然使用canvas渲染,通过调整devicePixelRatio提升清晰度(vue-echarts插件)
<v-chart class="w-full h-200px mt-5px" :option="option" :init-options="{devicePixelRatio: 2}"/>
参考:https://echarts.apache.org/zh/api.html#echarts.init


 1890
1890


 被折叠的 条评论
为什么被折叠?
被折叠的 条评论
为什么被折叠?
 到【灌水乐园】发言


