


遇到一共sb需求,本来两个柱状图加折线图就实现的功能,非得让折线图的数据展示在双柱状图的顶部,其实同理可以实现只展示最大值在顶部
一下为代码实现效果
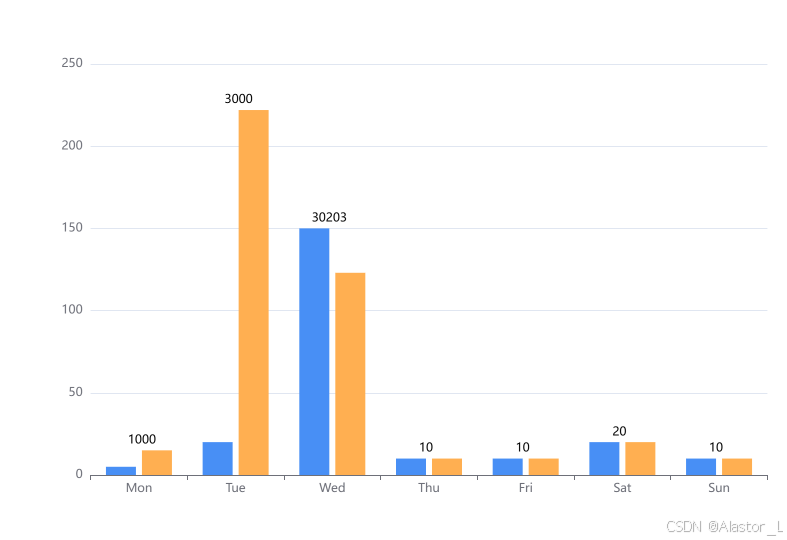
const list1 = [5, 20, 150, 10, 10, 20, 10, 20]
const list2 = [15, 222, 123, 10, 10, 20, 10, 20]
const line3 = [1000, 3000, 30203, 10, 10, 20, 10, 20]

option = {
  xAxis: {
    type: 'category',
    data: ['Mon', 'Tue', 'Wed', 'Thu', 'Fri', 'Sat', 'Sun']
  },
  yAxis: {
    type: 'value'
  },
  series: [{
                  name: '已租',
                  type: 'bar',
                  data: list1,
                  barWidth:30,
                  itemStyle: {
                    normal: {
                      color: '#488FF5',
                      offset: 0.1,
                    }
                  },
                  label: {
                          normal: {
                              show: true,
                              position: 'top',
                              offset:[15,1],
                              color: '#000',
                              formatter(param){
                                let {dataIndex,data} = param
                                console.log(param)
                                return list2[dataIndex] > data ? '': line3[dataIndex]
                              }
                          }
                  },
              },{
                  name: '闲置',
                  type: 'bar',
                  data: list2,
                  barWidth:30,
                  itemStyle: {
                    normal: {
                      color: '#FFAF51',
                      offset: 0.1
                    }
                  },
                  label: {
                          normal: {
                              show: true,
                              position: 'top',
                              offset:[-15,1],
                              color: '#000',
                               formatter(param){
                                let {dataIndex,data} = param
                                if(list1[dataIndex] === data) return ''
                                return list1[dataIndex] > data ? '':line3[dataIndex]
                              }
       ```
放入echarts 示例中可查看


 被折叠的 条评论
为什么被折叠?
被折叠的 条评论
为什么被折叠?
 到【灌水乐园】发言


