


目 录
1. 案例:
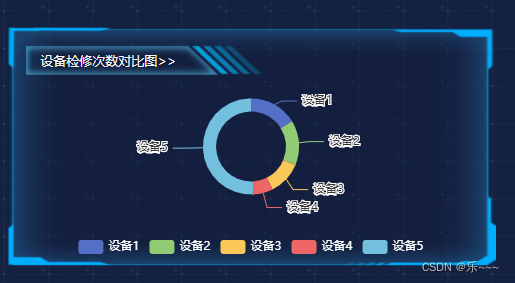
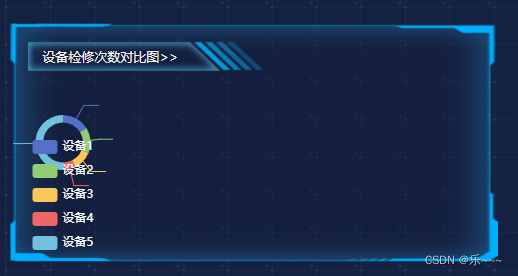
默认是正常宽度(如图1),当再次跳转会该页面时,eachars图发生变化(如图2)。
2. 原因:没有给eachars添加自适应。
3. 解决:
在父组件中:
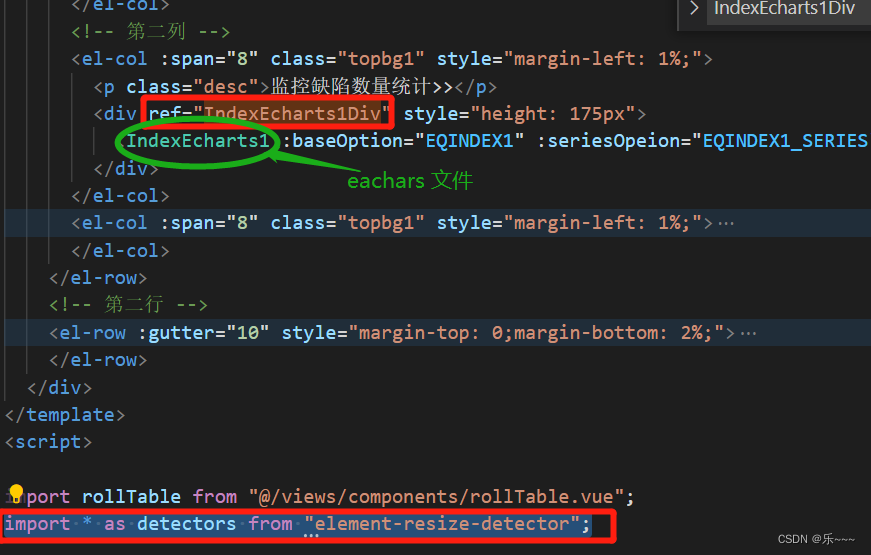
第一步:给包eachars的div 添加 ref="refName",引用依赖,如图3所示;
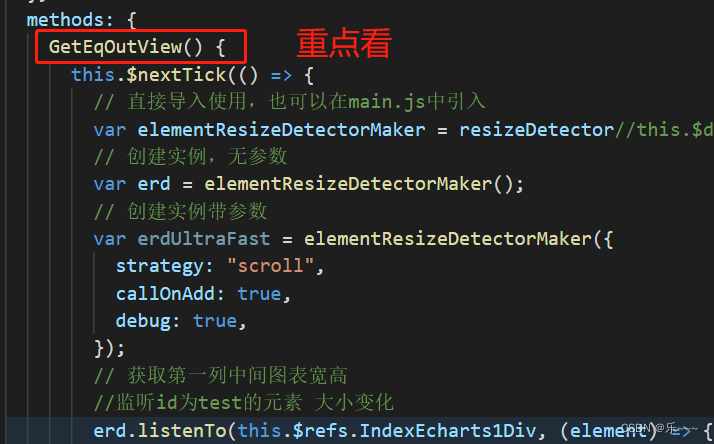
第二步:监听div大小的变化,从而实时计算后的宽、高(看下面的代码),并把值传给子组件(IndexEcharts1.vue)
在子组件中:直接看代码 (子组件相当于一个封装的组件)
父组件:
<template> <div class="ShouYe" v-loading="loading" :element-loading-svg="svg" element-loading-svg-view-box="-10, -10, 50, 50" element-loading-text="加载中" element-loading-background="#062b54" :style="{ height: heights, width: '100%', margin: '0' }"> <div class="da"> <div class="xiao"> <p class="desc">设备数量统计>></p> <div style="height: 175px; padding: 0 4% 2% 4%"> <!-- 设备数量统计图表 --> <rollTable /> </div> </div> <div class="xiao"> <div class="ccc" @dblclick="aaa"> </div> <p class="desc">监控缺陷数量统计>></p> <div ref="IndexEcharts1Div" style="height: 175px"> <!-- 监控缺陷数量统计图表 --> <!-- <IndexEcharts1 /> --> <IndexEcharts1 :baseOption="EQINDEX1" :seriesOpeion="EQINDEX1_SERIES" :widthAndheight="widthAndheight" /> </div> </div> <div class="xiao"> <p class="desc">监控设备质量对比>></p> <div style="height: 175px"> <!-- 监控设备质量对比图表 --> <!-- <IndexEcharts4 /> --> <IndexEcharts1 :baseOption="EQINDEX2" :seriesOpeion="EQINDEX2_SERIES" :widthAndheight="widthAndheight" /> </div> </div> </div> <div class="xiao_da"> <div class="xiao_zhong"> <div class="xiao"> <p class="desc">设备检修次数对比图>></p> <div style="height: 175px"> <!-- 设备检修次数对比图图表 --> <!-- <IndexEcharts5 /> --> <IndexEcharts1 :baseOption="EQINDEX3" :seriesOpeion="EQINDEX3_SERIES" :widthAndheight="widthAndheight" /> </div> </div> <div class="xiao"> <p class="desc">设备技改/异动次数统计>></p> <div style="height: 175px"> <!-- 设备技改/异动次数统计图表 --> <!-- <IndexEcharts7 /> --> <IndexEcharts1 :baseOption="EQINDEX4" :seriesOpeion="EQINDEX4_SERIES" :widthAndheight="widthAndheight" /> </div> </div> </div> <div class="xiao_zhong"> <div class="xiao"> <p class="desc">各场站检修合格排行榜>></p> <div style="height: 175px"> <!-- 各场站检修合格排行榜图表 --> <!-- <IndexEcharts6 /> --> <IndexEcharts1 :baseOption="EQINDEX5" :seriesOpeion="EQINDEX5_SERIES" :widthAndheight="widthAndheight" /> </div> </div> <div class="xiao"> <p class="desc">部门数据统计>></p> <div style="height: 165px"> <!-- 部门数据统计图表 --> <!-- <IndexEcharts8 /> --> <IndexEcharts1 :baseOption="EQINDEX6" :seriesOpeion="EQINDEX6_SERIES" :widthAndheight="widthAndheight" /> </div> </div> </div> <div class="xiao_zhong bgcoler"> <p class="desc">资源统计>></p> <div style="height: 435px"> <!-- 资源统计图表 --> <!-- <IndexEcharts9 /> --> <IndexEcharts1 :baseOption="EQINDEX7" :seriesOpeion="EQINDEX7_SERIES" :widthAndheight="widthAndheight2" /> </div> </div> </div> </div> </template> <script> import rollTable from "@/views/components/rollTable.vue"; import resizeDetector from 'element-resize-detector' export default { name: "index", components: { rollTable, }, data() { return { EQINDEX1: {}, EQINDEX1_SERIES: {}, // 监控缺陷数量统计屏幕宽高 widthAndheight: {}, // 设备检修次数对比图屏幕宽高 // widthAndheight1: {}, // 资源统计图表屏幕宽高 widthAndheight2: {}, loading: "", }; }, setup() { const svg = ` <path class="path" d=" M 30 15 L 28 17 M 25.61 25.61 A 15 15, 0, 0, 1, 15 30 A 15 15, 0, 1, 1, 27.99 7.5 L 15 15 " style="stroke-width: 4px; fill: rgba(0, 0, 0, 0)"/> `; }, created() { }, mounted() { this.GetEqOutView(); }, methods: { GetEqOutView() { this.$nextTick(() => { // 直接导入使用,也可以在main.js中引入 var elementResizeDetectorMaker = resizeDetector//this.$detectors; // 创建实例,无参数 var erd = elementResizeDetectorMaker(); // 创建实例带参数 var erdUltraFast = elementResizeDetectorMaker({ strategy: "scroll", callOnAdd: true, debug: true, }); // 获取第一列中间图表宽高 //监听id为test的元素 大小变化 erd.listenTo(this.$refs.IndexEcharts1Div, (element) => { // 中间图表宽高 this.widthAndheight = { width: element.offsetWidth + "px", height: element.offsetHeight + "px", }; // 左侧小图宽高 // this.widthAndheight1 = { // width: element.offsetWidth - 90 + "px", // height: element.offsetHeight + "px", // }; // 右侧大图宽高 this.widthAndheight2 = { width: element.offsetWidth + "px", height: element.offsetHeight * 2 + 90 + "px", }; // debugger // console.log('实时计算后的宽、高 :::', this.widthAndheight.width, '------', this.widthAndheight.height, '-----------------'); // 第一行第二图样式 this.EQINDEX1 = { backgroundColor: "transparent", tooltip: { trigger: "axis", axisPointer: { type: "cross", label: { backgroundColor: "#6a7985", }, }, }, // 调整位置 grid: { top: "0%", left: "4%", right: "4%", bottom: "4%", containLabel: true, }, textStyle: { color: "#ffffff", }, xAxis: [ { type: "category", boundaryGap: false, axisTick: { inside: true, lineStyle: { color: "#1868a9", }, }, axisLine: { lineStyle: { color: "#1868a9", }, }, data: [ "1月", "2月", "3月", "4月", "5月", "6月", "7月", "8月", "9月", "10月", "11月", "12月", ], }, ], yAxis: [ { type: "value", splitLine: { lineStyle: { color: "#1868a9", }, }, axisLabel: { inside: true, verticalAlign: "bottom", formatter: function (value) { return value + "次"; }, }, }, ], lineStyle: { normal: { color: "#31ad6b", // 线条颜色 }, }, }; // 第一行第二图数据 this.EQINDEX1_SERIES = { series: [ { name: "本年度", type: "line", smooth: true, lineStyle: { normal: { color: "#31ad6b", // 线条颜色 }, }, areaStyle: { //区域填充样式 normal: { //线性渐变,前4个参数分别是x0,y0,x2,y2(范围0~1);相当于图形包围盒中的百分比。如果最后一个参数是‘true’,则该四个值是绝对像素位置。 color: new this.$echarts.graphic.LinearGradient( 0, 0, 0, 1, [ { offset: 0, color: "#58ce8f" }, { offset: 0.7, color: "rgba(61,234,255, 0)" }, ], false ), shadowColor: "rgba(53,142,215, 0.9)", //阴影颜色 shadowBlur: 20, //shadowBlur设图形阴影的模糊大小。配合shadowColor,shadowOffsetX/Y, 设置图形的阴影效果。 }, }, symbol: "none", data: [ 120, 132, 101, 134, 90, 230, 210, 155, 201, 185, 135, 160, ], }, ], }; }); // 第一行第三图样式 this.EQINDEX2 = { tooltip: { trigger: "item", formatter: "{a} <br/>{b}: {c} ({d}%)", }, }; // 第一行第三图数据 this.EQINDEX2_SERIES = { series: [ { name: "访问来源", type: "pie", selectedMode: "single", radius: ["0%", "30%"], center: ["50%", "50%"], //修改位置 label: { normal: { position: "inner", }, }, labelLine: { normal: { show: false, }, }, data: [ { value: 335, name: "名称11", selected: true }, { value: 679, name: "名称22" }, { value: 1548, name: "名称33" }, ], }, { name: "访问来源", type: "pie", radius: ["40%", "55%"], center: ["50%", "50%"], //修改位置 data: [ { value: 335, name: "S10风机" }, { value: 310, name: "SK0灯泡" }, { value: 234, name: "名称3" }, { value: 135, name: "名称4" }, { value: 1048, name: "名称5" }, { value: 251, name: "名称6" }, { value: 147, name: "名称7" }, { value: 102, name: "名称8" }, ], }, ], }; // 第二行第一图样式 this.EQINDEX3 = { tooltip: { trigger: "item", formatter: "{a} <br/>{b}: {c} ({d}%)", }, // 左侧提示标题 legend: { orient: "horizontal", bottom: 10, data: ["设备1", "设备2", "设备3", "设备4", "设备5"], textStyle: { color: "#fff", }, }, }; // 第二行第一图数据 this.EQINDEX3_SERIES = { series: [ { name: "访问来源", type: "pie", radius: ["40%", "55%"], center: ["50%", "30%"], //修改位置 data: [ { value: 335, name: "设备1" }, { value: 310, name: "设备2" }, { value: 234, name: "设备3" }, { value: 135, name: "设备4" }, { value: 1048, name: "设备5" }, ], }, ], }; // 第三行第一图样式 this.EQINDEX4 = { color: ["#008cff", "#ff9f00"], tooltip: { trigger: "axis", axisPointer: { // 坐标轴指示器,坐标轴触发有效 type: "shadow", // 默认为直线,可选为:'line' | 'shadow' }, backgroundColor: "rgba(245, 245, 245, 0.8)", textStyle: { fontSize: 10, color: "#333333", }, padding: 10, }, legend: { show: true, top: "0px", icon: "circle", data: [ { name: "设备技改", textStyle: { color: "#008cff", }, }, { name: "设备异动", textStyle: { color: "#ff9f00", }, }, ], }, // 位置 grid: { left: "3%", right: "10%", bottom: "0%", containLabel: true, }, xAxis: [ { name: "月份", // nameLocation: 'start', type: "category", data: ["1月", "2月", "3月", "10月", "12月"], axisLine: { show: false, }, axisTick: { show: false, }, // 月份字体 nameTextStyle: { fontSize: 12, color: "#f0f0f0", }, axisLabel: { interval: 0, rotate: 45, margin: 15, textStyle: { color: "#fff", }, }, }, ], yAxis: [ { name: "金额:万", nameTextStyle: { color: "#f0f0f0", fontSize: 12, }, show: true, type: "value", axisTick: { show: false, }, axisLabel: { show: true, textStyle: { color: "#fff", }, }, axisLine: { lineStyle: { color: "#fff", }, }, splitLine: { show: true, lineStyle: { color: "#fff", }, }, }, ], }; // 第三行第一图数据 this.EQINDEX4_SERIES = { series: [ { name: "设备技改", type: "bar", barWidth: 14, data: [ 150, 232, 201, 154, 190, 330, 410, 190, 330, 410, 150, 232, 201, 154, 190, 330, 410, 190, 230, 200, 180, ], }, { name: "设备异动", type: "line", symbol: "circle", symbolSize: [10, 10], // borderWidth: 0, data: [ 120, 132, 101, 134, 90, 230, 210, 190, 330, 410, 120, 132, 101, 134, 90, 230, 210, 190, 230, 200, 180, ], }, ], }; // 第二行第二图样式 this.EQINDEX5 = { tooltip: { trigger: "axis", axisPointer: { type: "shadow", }, backgroundColor: "rgba(13, 64, 71, 0.50)", borderColor: "rgba(143, 225, 252, 0.60)", padding: 8, textStyle: { color: "#fff", }, }, grid: { left: "20%", right: "20", bottom: "20", top: "20", containLabel: false, }, xAxis: { type: "value", show: false, }, yAxis: { type: "category", data: [ "东风场站5", "西郊场站4", "西厂场站3", "北部场站2", "南屿场站1", ], axisLine: { show: false, }, axisTick: { show: false, }, axisLabel: { margin: 80, align: "left", color: "#e5e5e5", rich: { // 第一名 one: { backgroundColor: "#F6BD16", color: "white", width: 12, height: 16, padding: [1, 0, 0, 5], borderRadius: 10, fontSize: 11, }, // 第二名 two: { backgroundColor: "#FF9845", color: "white", width: 12, height: 16, padding: [1, 0, 0, 5], borderRadius: 10, fontSize: 11, }, // 第三名 three: { backgroundColor: "#F6BD16", color: "white", width: 12, height: 16, padding: [1, 0, 0, 5], borderRadius: 10, fontSize: 11, }, // 一位数 four: { backgroundColor: "#33CCCC", color: "white", width: 12, height: 16, padding: [1, 0, 0, 5], borderRadius: 10, fontSize: 11, }, // 两位数 five: { backgroundColor: "#33CCCC", color: "white", width: 16, height: 16, padding: [1, 0, 0, 1], borderRadius: 10, fontSize: 11, }, }, }, }, }; // 第二行第二图样式 this.EQINDEX5_SERIES = { series: [ { type: "bar", showBackground: true, label: { show: true, position: "right", color: "#e5e5e5", formatter: "{c}%", }, barWidth: 10, itemStyle: { emphasis: { barBorderRadius: 7, }, //颜色样式部分 normal: { barBorderRadius: 8, color: new this.$echarts.graphic.LinearGradient(0, 0, 1, 0, [ { offset: 0, color: "rgba(51, 204, 204,.4)" }, { offset: 1, color: "rgba(51, 204, 204, 1)" }, ]), }, }, data: [55, 65, 75, 90, 92], }, ], }; // 第三行第二图样式 this.EQINDEX6 = { tooltip: { show: true, trigger: "axis", //axis , item backgroundColor: "RGBA(0, 49, 85, 1)", borderColor: "rgba(0, 151, 251, 1)", borderWidth: 1, borderRadius: 0, textStyle: { color: "#BCE9FC", fontSize: 16, align: "left", }, }, grid: { left: "7%", right: "7%", top: "25%", bottom: "2%", containLabel: true, }, xAxis: [ { type: "category", axisLine: { //坐标轴轴线相关设置。数学上的x轴 show: true, lineStyle: { color: "rgba(1, 58, 116,1)", }, }, axisLabel: { //坐标轴刻度标签的相关设置 textStyle: { color: "#FFFFFF", fontSize: 12, }, }, splitLine: { show: false, type: "dashed", lineStyle: { color: "rgba(1, 58, 116,1)", }, }, axisTick: { show: false, }, data: this.xLabel, }, ], yAxis: [ { name: "(万元)", nameTextStyle: { color: "white", fontSize: 12, padding: [0, 0, 0, -30], }, // minInterval: 1, type: "value", splitLine: { show: false, lineStyle: { color: "#1160a0", type: "dashed", }, }, axisLine: { show: true, lineStyle: { color: "rgba(1, 58, 116,1)", }, }, axisLabel: { show: true, textStyle: { color: "#fff", fontSize: 12, }, }, axisTick: { show: false, }, }, ], dataZoom: [ { xAxisIndex: 0, // 这里是从X轴的0刻度开始 show: false, // 是否显示滑动条,不影响使用 type: "slider", // 这个 dataZoom 组件是 slider 型 dataZoom 组件 startValue: 0, // 从头开始。 endValue: 4, // 展示到第几个。 }, ], }; // 第三行第二图数据 this.EQINDEX6_SERIES = { series: [ { name: "近五年旅游收入", type: "pictorialBar", barWidth: "60%", label: { normal: { show: true, position: "top", textStyle: { color: "#d1ae36", fontSize: 12, }, }, }, itemStyle: { normal: { color: { type: "linear", x: 0, y: 0, x2: 1, y2: 1, colorStops: [ { offset: 0, color: "#d1ae36", // 0% 处的颜色 }, { offset: 0.8, color: "#d1ae3600", // 100% 处的颜色 }, { offset: 1, color: "#d1ae3600", // 100% 处的颜色 }, ], globalCoord: false, // 缺省为 false }, //渐变颜色 borderColor: "#d1ae36", borderWidth: 4, }, }, symbol: "path://M12.000,-0.000 C12.000,-0.000 16.074,60.121 22.731,60.121 C26.173,60.121 -3.234,60.121 0.511,60.121 C7.072,60.121 12.000,-0.000 12.000,-0.000 Z", data: [ { value: 335, legendname: "2019", name: "种类01 335", itemStyle: { color: "#8d7fec" }, }, { value: 310, legendname: "2020", name: "种类02 310", itemStyle: { color: "#5085f2" }, }, { value: 234, legendname: "2021", name: "种类03 234", itemStyle: { color: "#e75fc3" }, }, { value: 154, legendname: "2022", name: "种类04 154", itemStyle: { color: "#f87be2" }, }, { value: 335, legendname: "2023", name: "种类05 335", itemStyle: { color: "#f2719a" }, }, { value: 335, legendname: "2024", name: "种类06 335", itemStyle: { color: "#fca4bb" }, }, { value: 335, legendname: "2025", name: "种类07 335", itemStyle: { color: "#f59a8f" }, }, ], }, ], }; // 大图样式 this.EQINDEX7 = { color: ["#DBB36E", "#33CCCC"], tooltip: { trigger: "axis", backgroundColor: "rgba(13, 64, 71, 0.50)", borderColor: "rgba(143, 225, 252, 0.60)", padding: 8, textStyle: { color: "#fff", }, }, legend: { data: ["计划完成总工期比例", "实际完成总工期比例"], icon: "rect", itemWidth: 14, itemHeight: 14, right: 5, textStyle: { fontSize: 14, color: "#FFFFFF", }, }, grid: { left: "3%", right: "7%", bottom: "3%", containLabel: true, }, xAxis: { type: "category", axisLine: { // 轴线设置 show: true, // 显示轴线 lineStyle: { // 轴线样式设置 color: "#C5C5C5", // 轴线颜色 width: 1, // 轴线宽度 type: "solid", // 轴线类型-虚线 }, }, axisLabel: { textStyle: { color: "#F5F5F5", //更改坐标轴文字颜色 fontSize: 12, //更改坐标轴文字大小 }, }, data: [ "2022.01", "2022.02", "2022.03", "2022.04", "2022.05", "2022.06", "2022.07", "2022.08", "2022.09", "2022.10", "2022.11", "2022.12", ], }, yAxis: { splitLine: { show: true, lineStyle: { type: [10, 20], color: "#979797", dashOffset: 0, }, }, axisLabel: { textStyle: { color: "#F5F5F5", //更改坐标轴文字颜色 fontSize: 12, //更改坐标轴文字大小 }, }, }, }; // 大图数据 this.EQINDEX7_SERIES = { series: [ { name: "计划完成总工期比例", type: "line", stack: "Total", // smooth: true, symbol: "circle", symbolSize: 10, itemStyle: { shadowColor: "#fff", shadowBlur: 5, }, label: { show: true, position: "right", color: "#F5F5F5", }, areaStyle: { opacity: 0.8, color: new this.$echarts.graphic.LinearGradient(0, 0, 0, 1, [ { offset: 0, color: "rgba(219, 179, 110, 1)", }, { offset: 1, color: "rgba(219, 179, 110, 0)", }, ]), }, emphasis: { focus: "series", }, data: [10, 132, 101, 134, 90, 230, 210, 220, 182, 191, 234, 290], }, { name: "实际完成总工期比例", type: "line", stack: "Total", // smooth: true, symbol: "circle", symbolSize: 10, itemStyle: { shadowColor: "#fff", shadowBlur: 5, }, label: { show: true, position: "right", color: "#F5F5F5", }, areaStyle: { opacity: 0.8, color: new this.$echarts.graphic.LinearGradient(0, 0, 0, 1, [ { offset: 0, color: "rgba(51, 204, 204, 1)", }, { offset: 1, color: "rgba(51, 204, 204, 0)", }, ]), }, emphasis: { focus: "series", }, data: [220, 182, 191, 234, 290, 330, 310, 120, 132, 101, 134, 90], }, ], }; }); }, aaa() { console.log("0000000"); } }, }; </script> <style> @import url("@/assets/css/home.css"); </style> <style scoped lang="scss"> .topbg1 { background: url("@/assets/imgList/box1BG.png") no-repeat; background-size: 100% 100%; margin: 0 0.5%; } .indexRight { background: url("@/assets/imgList/IndexBG.png") no-repeat; background-size: 100% 100%; } .home { overflow-y: auto; height: calc(100vh - 36px); background-color: #f6f9f9; padding-bottom: 10px; padding-right: 10px; } .successCard { font-size: 26px; font-family: auto; color: var(--el-color-success); background-color: #f0f9eb; padding: 10px; } .iconClass { font-size: 56px; } .datasClass { font-size: 38px; text-align: end; } .titleClass { font-size: 12px; text-align: center; } .num { display: flex; // 要换行 flex-wrap: wrap; // 从头到尾均匀排列 justify-content: space-between; .el-row { display: flex; flex-wrap: nowrap; } .numCard1 { background: url("@/assets/img/topbg1.png") no-repeat; background-size: 100% 100%; } .numCard2 { background: url("@/assets/img/topbg.png") no-repeat; background-size: 100% 100%; } .numCard3 { background: url("@/assets/img/topbg3.png") no-repeat; background-size: 100% 100%; } .numCard4 { background: url("@/assets/img/topbg4.png") no-repeat; background-size: 100% 100%; } .numCard5 { background: url("@/assets/img/topbg.png") no-repeat; background-size: 100% 100%; } .el-card { height: 10rem; width: 100%; border: 0px solid #fff; :deep .el-card__body { display: flex; justify-content: space-around; } .topBG { display: flex; justify-content: space-around; } .icon { width: 3rem; height: 3rem; line-height: 3rem; text-align: center; font-size: 30px; // color: #f56c6c; color: #fff; margin-top: 0.5rem; // background-color: #fef0f0//#ffcccc; background-color: rgba(252, 255, 255, 0.3); //#ffcccc; border-radius: 50%; } .details { padding: 0 1rem; // 竖着排且居中 display: flex; //flex-direction: column; justify-content: space-between; //margin-left: 50px; //align-items: flex-end; .price { margin-top: 20px; font-size: 30px; margin-bottom: 10px; line-height: 30px; height: 30px; color: #5470c6; // #303133; // rgb(154 204 0); font-weight: bold; font-family: "微软雅黑", Arial; } .numTop { font-size: 2rem; color: #f8f5f5; } } } } .Rightcenter { height: 15rem; width: 100%; //border: 1px solid #ccc; display: flex; .box-card { width: 100%; ::v-deep .el-card__body { display: flex; justify-content: space-around; } .cardLeft { width: 33.33%; .clearfix { border-bottom: 2px solid #00b7f9; padding: 0 3rem 0 1rem; span { color: #00b7f9; } } .text-item { margin: 0.5rem 3rem 0.5rem 1rem; display: flex; justify-content: space-between; border-bottom: 1px solid #cccccc; } } } } // eachars标题 .desc { font-size: 13px; color: #f8f5f5; // text-align: center; font-family: "微软雅黑", Arial; line-height: 2.5rem; background: url("@/assets/imgList/eacharsTitlebg.png") no-repeat; background-size: 100% 100%; width: 50%; margin-left: 2%; margin-top: 3%; padding-left: 4%; } // 首页背景色 .ShouYe { background: url("@/assets/imgList/IndexBG.png") no-repeat; background-size: 100% 100%; } .da { width: 100%; display: flex; justify-content: space-around; .xiao { width: 32%; background: url("@/assets/imgList/box1BG.png") no-repeat; background-size: 100% 100%; height: 245px; position: relative; .ccc { width: 100%; height: 100%; // background: url("@/assets/imgList/box1BG.png") no-repeat; position: absolute; color: white; z-index: 321; } } } .xiao_da { width: 100%; display: flex; justify-content: space-around; .xiao_zhong { width: 32%; height: 510px; margin-bottom: 20px; .xiao { background: url("@/assets/imgList/box1BG.png") no-repeat; background-size: 100% 100%; height: 245px; } } } .bgcoler { margin-top: 10px; background: url("@/assets/imgList/box1BG.png") no-repeat; background-size: 100% 100%; } </style>
子组件:
<template>
  <!-- 接受图标宽度 -->
  <div ref="init" id="left_top" :style="{
    'width': `${width}`,
    'height':`${height}`
  }"></div>
</template>
<script>

export default {
  data() {
    return {
      m2R2Data: [],
      width: '',
      height: '',
      main: '',
    };
  },
  // 父组件传过来的数据
  props: {
    seriesOpeion: [Array, Object],
    baseOption: [Array, Object],
    widthAndheight: [Array, Object]
  },
  computed: {
    changeData() {
      const { baseOption, seriesOpeion, widthAndheight } = this;
      return { baseOption, seriesOpeion, widthAndheight };
    },
  },
  created() {
  },
  mounted() {
  },
  watch: {
     changeData(val) {
      this.width = val.widthAndheight.width
      this.height = val.widthAndheight.height
      // console.log('父级传递宽度', val.widthAndheight.width, '------', val.widthAndheight.height)
      this.main = this.$refs.init;
      this.myChars = this.$echarts.init(this.main); //markRaw(this.$echarts.init(this.main)); //this.$echarts.init(this.main);
      this.SetEchars(val.baseOption, val.seriesOpeion);

      this.$nextTick(() => {
        this.myChars.resize()
      })
    },
  },
  methods: {
    SetEchars(bOp, sOp) {
      // console.log("进入SetEchars方法");
      this.options = Object.assign(bOp, sOp);
      this.myChars.setOption(this.options, true);
    },
  },


};
</script>
<style scoped>
.eachar01 {
  height: 100%;
}
</style>


 9826
9826


 被折叠的 条评论
为什么被折叠?
被折叠的 条评论
为什么被折叠?
 到【灌水乐园】发言


