


 本文介绍了如何在Matplotlib中使用boxplot函数设置线宽,以及如何添加带有特定颜色和名称的Nelder-MeadNLS散点图。作者展示了如何通过`set`函数调整箱线图的线宽至1.1,并保持其他图形元素的可见性。
1.箱线图设置线宽
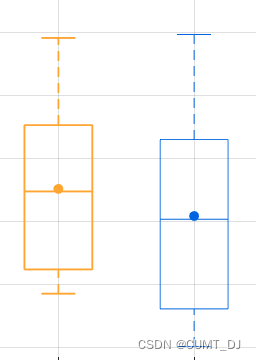
先看效果(左边)
原本boxplot没法设置线宽,通过set可以设置线宽了
h3 = boxplot(corrected_errors_DS,'Color',Brown , 'Position', 3, 'Widths', 0.5);
set(h3,'LineWidth',1.1);
hold on;
scatter(3, mean_corrected_errors_DS, [],Brown, 'filled','DisplayName','Nelder-Mead NLS');
2.二维数据,比如有3个算法对比,每个算法有1000个点,想看这三者的性能
数据必须是1000*3这样的,如果是3*1000要转置
figure;
boxplot(min_error_all_trials(:, 1:3), 'Labels', [ "WLS" "CD-WLS[10]" "PSA-WLS" ] );
% 设置字体为 Times New Roman
set(gca, 'FontName', 'Times New Roman');  % 设置坐标轴字体
%xlabel('方法');
ylabel('RMSE (m)','FontName', 'Times New Roman');
% title('不同算法下的定位误差箱线图');


 被折叠的 条评论
为什么被折叠?
被折叠的 条评论
为什么被折叠?
 到【灌水乐园】发言


