


方法1:关键参数 stacked=True
df.plot.line(stacked=True)
缺点:不知道颜色怎么填充
方法2:plt.stackplot
plt.stackplot(x, y1, y2,..., labels=labels)
参考:https://zhuanlan.zhihu.com/p/527278457
关键参数:edgecolor='black' 、 linestyle、…
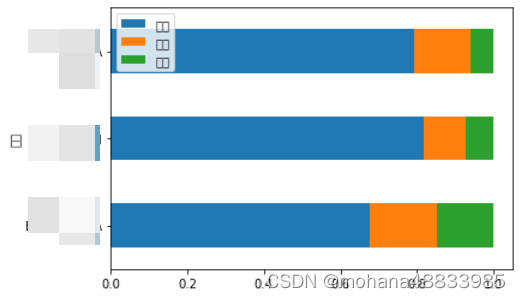
sent2.plot.barh(stacked=True)

df.plot.line(stacked=True)
缺点:不知道颜色怎么填充
plt.stackplot(x, y1, y2,..., labels=labels)
参考:https://zhuanlan.zhihu.com/p/527278457
关键参数:edgecolor='black' 、 linestyle、…
sent2.plot.barh(stacked=True)
 2148
258
2908
2148
258
2908


 被折叠的 条评论
为什么被折叠?
被折叠的 条评论
为什么被折叠?
 到【灌水乐园】发言


