


 本文介绍如何使用D3的不同版本进行颜色配置,并演示了多种颜色方案的实际应用案例,包括分类、离散及连续颜色方案。
v3版本:
var color = d3.scale.category10();
...
return color[i];
v4/v5版本:
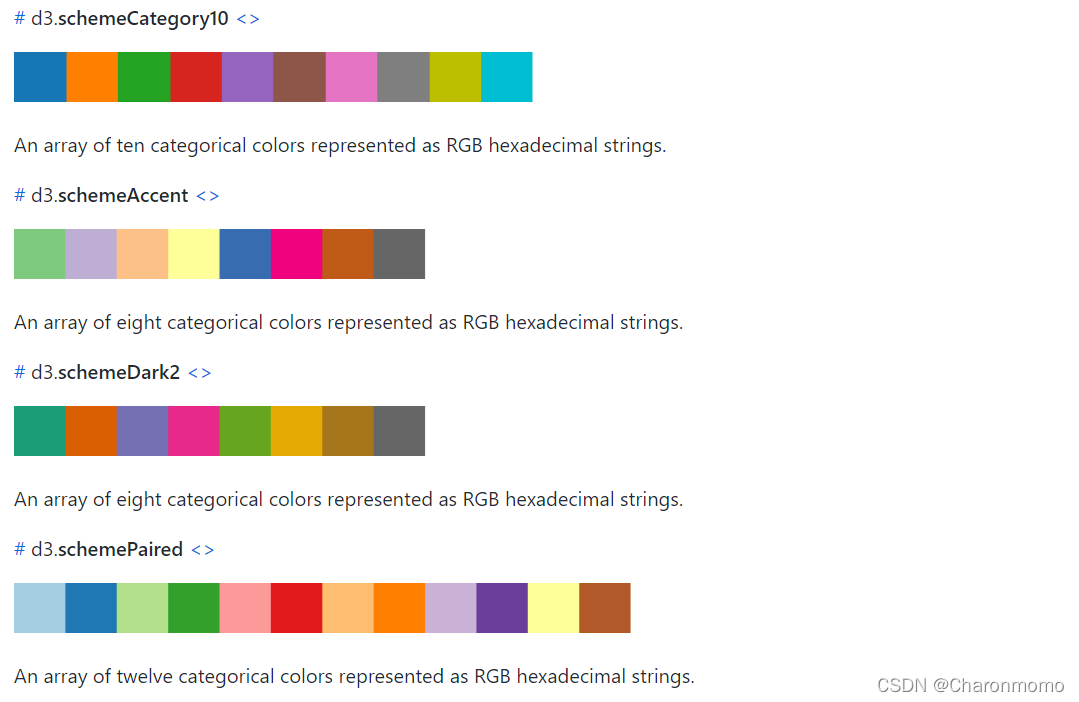
d3.schemeCategory10
d3.schemeCategory20
d3.schemeCategory20b
d3.schemeCategory20c
注意: v5版本只有 d3.schemeCategory10 可用, 其他几个已经被 d3-scale-chromatic 取代了, 在v5版本中使用后面几个都会报错!
// 颜色比例尺
var color = d3.scaleOrdinal()
    		    .domain(d3.range(nodes.length)) // 节点的个数
    		    .range(d3.schemeCategory10);
...
return color(i);
d3-scale-chromatic
d3-scale-chromatic 为 d3 提供了一种新的颜色方案. 描述d3-scale-chromatic的原文如下:
This module provides sequential, diverging and categorical color schemes designed to work with d3-scale’s d3.scaleOrdinal and d3.scaleSequential. Most of these schemes are derived from Cynthia A. Brewer’s ColorBrewer. Since ColorBrewer publishes only discrete color schemes, the sequential and diverging scales are interpolated using uniform B-splines.
大意是说: d3-scale-chromatic 可以提供 连续的 (sequential), 离散的(diverging) and 分类的(categorical) 的颜色方案 (GitHub上还提到了一种 循环的(Cyclical))
这几种方案在GitHub上都给了很多样例, 更加详细的可以查看: d3-scale-chromatic
分类的颜色方案 Categorical
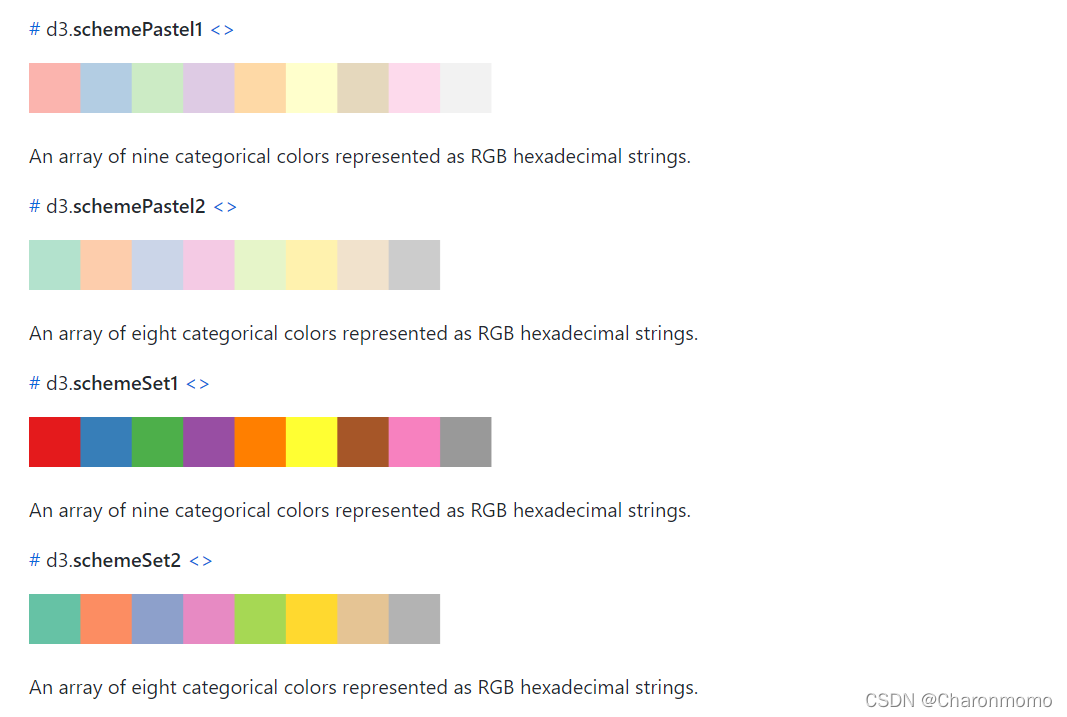
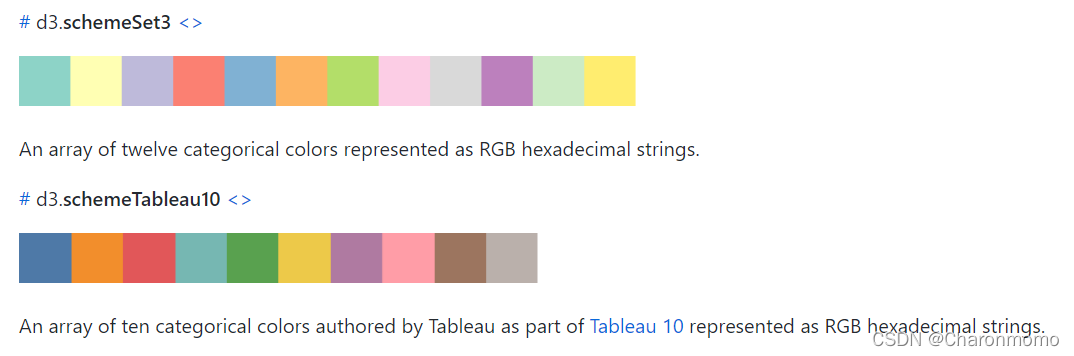
使用方法 (以 d3.schemeSet3 为例):
var colorScale = d3.scaleOrdinal(d3.schemeSet3)

//draw nodes 绘制节点
nodes_g.append("circle")
   .attr("r", function (e) {
       return e.relation_num * 5
   })
   .attr("fill", function(d,i){
   		return colorScale(i)}
   	);
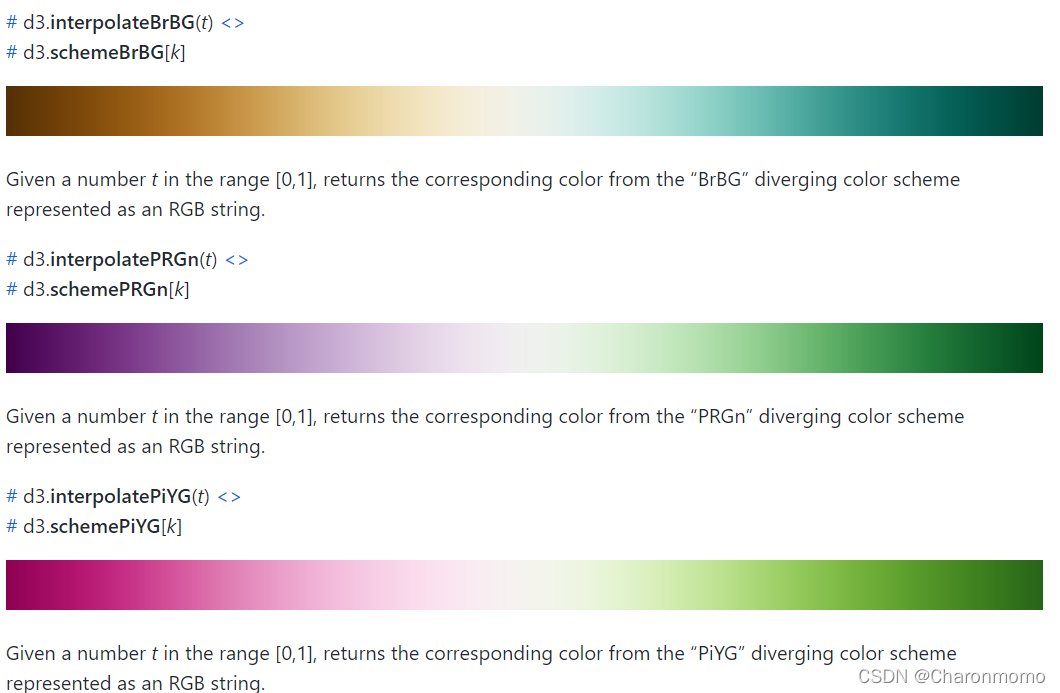
离散的颜色方案 Diverging
括号中的 k 指的是希望生成的色系个数.
eg. 使用PiYG配色方案创建一个发散的、连续的色度:
var piyg = d3.scaleSequential(d3.interpolatePiYG);
用法一
在设置颜色比例尺的时候就把设置几个色系规定好: d3.schemePRGn[nodes.length] (nodes.length是节点个数)
var colorScale = d3.scaleOrdinal(d3.schemePRGn[nodes.length]);

//draw nodes 绘制节点
nodes_g.append("circle")
   .attr("r", function (e) {
       return e.relation_num * 5
   })
   .attr("fill", function(d,i){
   		return colorScale(i)}
   	);
用法二
按照官网的要求使用两个函数:
- d3.interpolatePRGn(t)
- d3.schemePRGn[k]
其中 k 用于设置希望生成的色系个数(也可以不设置),
t 是[0,1]之间的数字,返回以RGB字符串表示的“BrBG”发散配色方案中相应的颜色。
// 设置色系
var colorScale = d3.scaleOrdinal(d3.schemePRGn)
// 设置一个线性比例尺将节点个数映射到[0,1]中
let scale = d3.scaleLinear().domain([0, nodes.length]).range([0,1])

//draw nodes 绘制节点
nodes_g.append("circle")
   .attr("r", function (e) {
       return e.relation_num * 5
   })
   .attr("fill", function(d,i){
   		return d3.interpolatePRGn(scale(i))
   		}
   	);
其他色系:
连续颜色方案 Sequential (Single Hue)
eg. 使用蓝色色系创建一个连续的离散9色尺度:
var blues = d3.scaleOrdinal(d3.schemeBlues[9]);
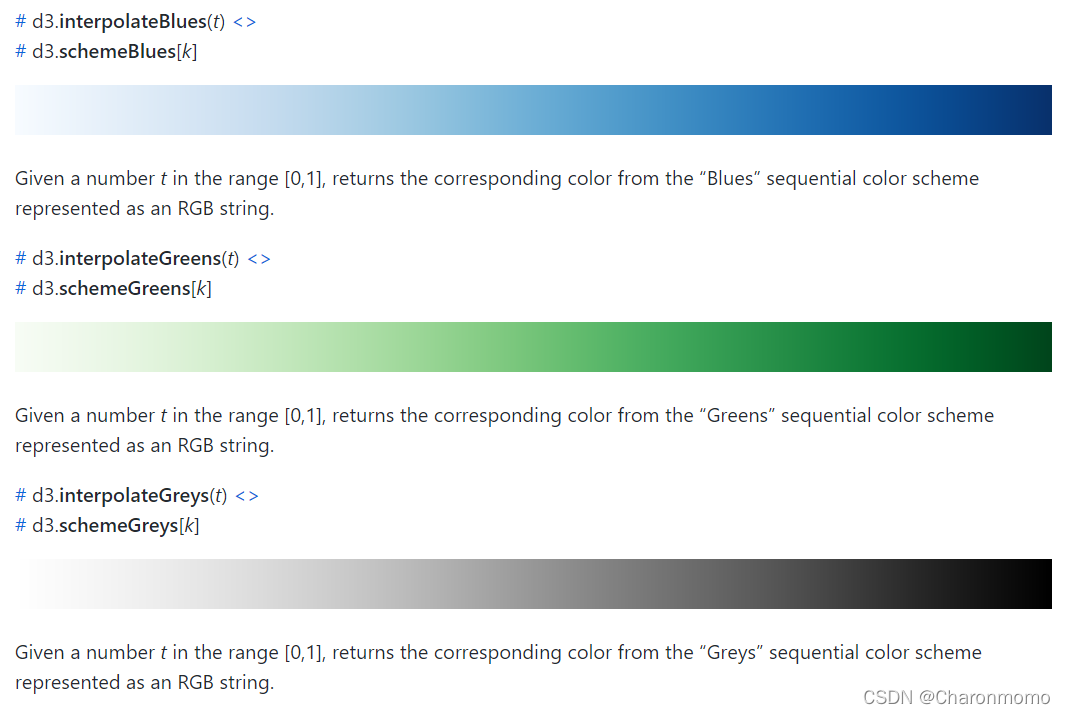
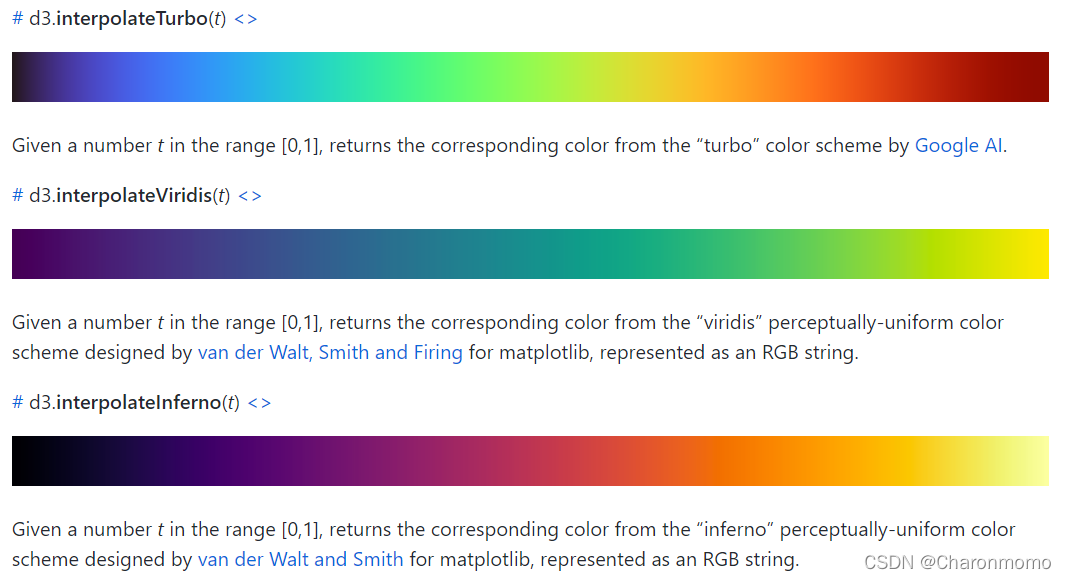
连续颜色方案 Sequential (Multi-Hue)
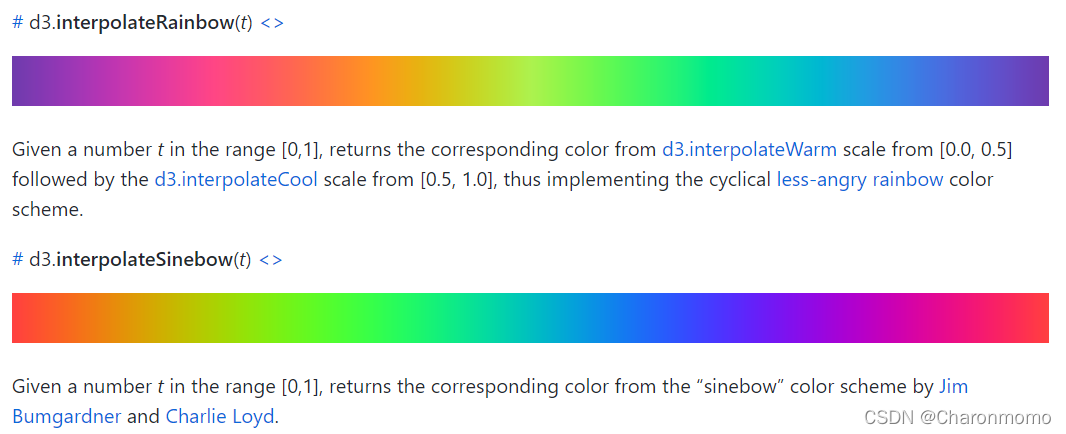
循环颜色方案 Cyclical
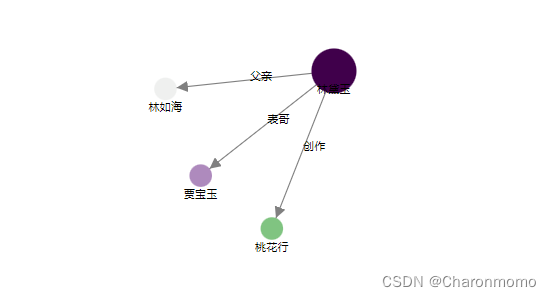
完整代码参考:
<!DOCTYPE html>
<!--draw the graph completely-->
<html lang="en">
<head>
<meta charset="UTF-8">
<title>Title</title>
<!--import d3 version 5-->
<script type="text/javascript" src="https://d3js.org/d3.v5.min.js"></script>
<!--import jquery3.3.1-->
<!-- <script type="text/javascript" src="js/jquery-3.3.1.min.js"></script> -->
<script src="https://cdn.staticfile.org/jquery/1.10.2/jquery.min.js"></script>
</head>
<body>
<svg></svg>
<script>
//get json file
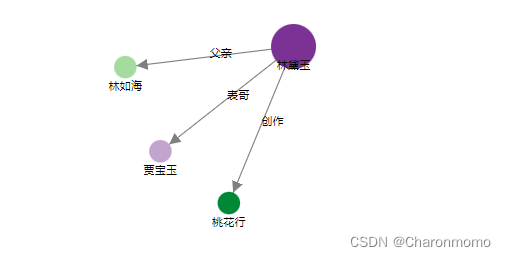
const data = {
"nodes": [{
"entity_name": "林黛玉",
"entity_id": "entity/2870013",
"ontology_name": "人员",
"relation_num": 4
}, {
"entity_name": "贾宝玉",
"entity_id": "entity/2870127",
"ontology_name": "人员",
"relation_num": 2
},
{
"entity_name": "林如海",
"entity_id": "entity/2870147",
"ontology_name": "人员",
"relation_num": 2
},
{
"entity_name": "桃花行",
"entity_id": "entity/3770056",
"ontology_name": "作品",
"relation_num": 2
}],
"links": [{
"from": "entity/2870013",
"to": "entity/2870127",
"relation_id": "relation/815478",
"relation_name": "表哥"
},
{
"from": "entity/2870013",
"to": "entity/2870147",
"relation_id": "relation/815532",
"relation_name": "父亲"
},
{
"from": "entity/2870013",
"to": "entity/3770056",
"relation_id": "relation/815565",
"relation_name": "创作"
}]
}
//GroupExplorer constructing function
//this is one way to create a javascript object
function GroupExplorer(data) {
console.log(data)
//create an object-include some data
//this is an another way to create a javascript object
var defaultConfig = {
windowWidth: window.innerWidth,
windowHeight: window.innerHeight,
defaultLinkDistance: 150,
data: data
}
// console.log(defaultConfig)
// 处理数据, 让同一本体下的实体颜色相同
// 去重
var ontologySet = new Set()
defaultConfig.data.nodes.forEach(n =>
ontologySet.add(n.ontology_name))
let ontologyList = [...ontologySet]
console.log(ontologyList)
//设置一个color的颜色比例尺,为了让不同本体的实体呈现不同的颜色
var colorScale = d3.scaleOrdinal(d3.schemeSpectral)
// .domain(d3.range(ontologyList.length))
// .range([0,1]);
let scale = d3.scaleLinear().domain([0,ontologyList.length+2]).range([0,1])
// 方法一
// var colorScale = d3.scaleOrdinal(d3.schemeYlGn[4]);
var svg = d3.select("svg");
svg.attr("width", defaultConfig.windowWidth);
svg.attr("height", defaultConfig.windowHeight);
defaultConfig.data.links.forEach(function (e) {
var sourceNode = defaultConfig.data.nodes.filter(function (n) {
return n.entity_id === e.from;
})[0];
var targetNode = defaultConfig.data.nodes.filter(function (n) {
return n.entity_id === e.to;
})[0];
e.source = sourceNode;
e.target = targetNode;
// console.log(e)
});
//create a force graph
var forceSimulation = d3.forceSimulation()
.force("link", d3.forceLink())
.force("charge", d3.forceManyBody())
.force("center", d3.forceCenter(defaultConfig.windowWidth / 2, defaultConfig.windowHeight / 2));
//transform nodes data
forceSimulation.nodes(defaultConfig.data.nodes)
.on("tick", ticked);
//tranform links data
forceSimulation.force("link")
.links(defaultConfig.data.links)
.distance(defaultConfig.defaultLinkDistance);
console.log(defaultConfig.data.nodes);
console.log(defaultConfig.data.links);
//define arrow
svg.append("svg:defs")
.append("svg:marker")
.attr("id", "marker")
.attr('viewBox', '0 -5 10 10')
.attr("refX", 20)
.attr("refY", 0)
.attr('markerWidth', 10)
.attr('markerHeight', 10)
.attr('orient', 'auto')
.append('svg:path')
.attr('d', 'M0,-5L10,0L0,5')
.attr("fill", "grey");
//draw links
var links = svg.append("g")
.selectAll("line")
.data(defaultConfig.data.links)
.enter()
.append("line")
.attr("x1", function (n) { return n.source.x })
.attr("y1", function (n) { return n.source.y })
.attr("x2", function (n) { return n.target.x })
.attr("y2", function (n) { return n.target.y })
.attr("stroke", "grey")
.attr("stroke-width", 1)
.attr("marker-end", "url(#marker)");
//draw links-text
var links_text = svg.append("g")
.selectAll("text")
.data(defaultConfig.data.links)
.enter()
.append("text")
.attr("x", function (e) {
return (e.source.x + e.target.x) / 2;
})
.attr("y", function (e) {
// console.log(e.source.y + "+" + e.target.y)
return (e.source.y + e.target.y) / 2;
})
.attr("font-size", 10)
.text(function (e) { return e.relation_name });
//draw nodes group = node+node-text
var nodes_g = svg.append("g")
.selectAll("g")
.data(defaultConfig.data.nodes)
.enter()
.append("g")
.attr("transform", function (e) {
return "translate(" + e.x + "," + e.y + ")";
})
.call(d3.drag()
.on("start", started)
.on("drag", dragged)
.on("end", ended));
//draw nodes
nodes_g.append("circle")
.attr("r", function (e) {
return e.relation_num * 5
})
// .attr("fill", function(d,i){
// // return colorScale(i)
// return d3.interpolateSpectral(scale(i))
// }
// );
.attr("fill", function(n){
for(let i = 0; i<ontologyList.length;i++){
if(n.ontology_name == ontologyList[i]){
return d3.interpolateSpectral(scale(i))
}
}
});
//draw node-text
nodes_g.append("text")
.attr("x", -15)
.attr("y", 20)
.attr("font-size", 10)
.text(function (e) { return e.entity_name });
function started(d) {
if (!d3.event.active) {
forceSimulation.alphaTarget(0.8).restart();
}
d.fx = d.x;
d.fy = d.y;
}
function dragged(d) {
d.fx = d3.event.x;
d.fy = d3.event.y;
}
function ended(d) {
if (!d3.event.active) {
forceSimulation.alphaTarget(0);
}
d.fx = null;
d.fy = null;
}
function ticked() {
links
.attr("x1", function (n) { return n.source.x })
.attr("y1", function (n) { return n.source.y })
.attr("x2", function (n) { return n.target.x })
.attr("y2", function (n) { return n.target.y })
links_text
.attr("x", function (e) {
return (e.source.x + e.target.x) / 2;
})
.attr("y", function (e) {
return (e.source.y + e.target.y) / 2;
})
nodes_g
.attr("transform", function (e) {
return "translate(" + e.x + "," + e.y + ")";
})
}
}
//because in the way of creating a javascript object,
//you need to use "new" to use it
new GroupExplorer(data);
</script>
</body>
</html>
更多样式可以参考: d3/d3-scale-chromatic


 被折叠的 条评论
为什么被折叠?
被折叠的 条评论
为什么被折叠?
 到【灌水乐园】发言


