


 本文介绍了如何使用ECharts在离线环境下显示地图,并通过加载本地GeoJSON数据实现地图上的区域高亮和项目点标记。通过设置地图中心点、缩放级别和交互效果,展示了在不依赖外网的情况下,实现黑龙江省及其下属城市的地图展示和点击切换功能。同时,利用ECharts的effectScatter类型描绘项目点,提供了不同城市的项目点经纬度数据。
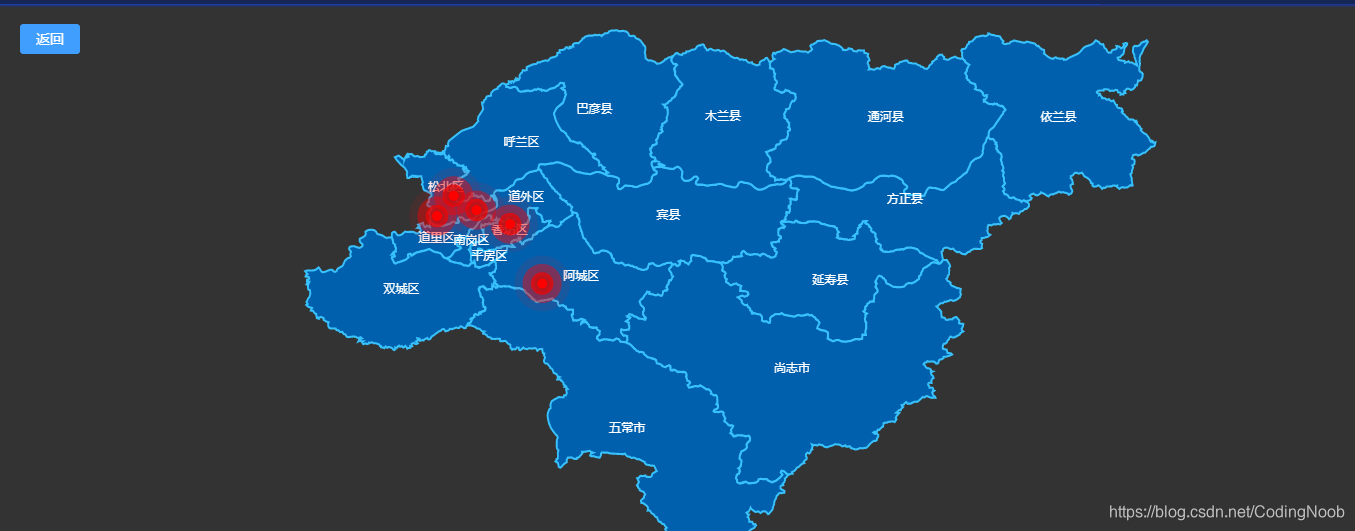
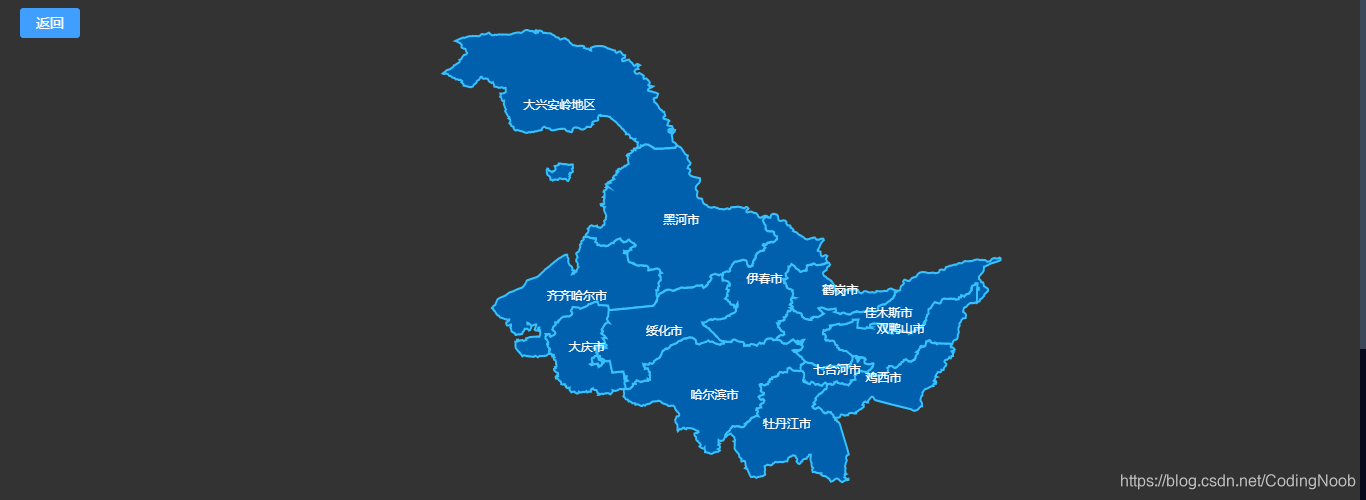
最新在做项目的时候用到一个地图,这个地图是要离线使用的,之前做过的百度地图用的都是在线版本的,但是如果不连接外网的时候就无法显示了,现在要做的是一个不接外网的东西,然后要在地图上对应的经纬度显示项目点。点击每个城市会显示对应的城市。于是研究了下echart的map地图,实现了下面的效果。
代码如下:
<template>
  <div class="echart-bmap_wrapper">
    <div class="btn">
      <el-button type="primary" @click="int" size="mini">返回</el-button>
    </div>
    <div class="bmap-box" id="bmapChartBox"></div>
  </div>
</template>
<script>
import echarts from 'echarts';
export default {
  name: 'echartBmap',
  data () {
    return {
      // 地图数据
      mapData: {
        '黑龙江': require('./data/黑龙江.json'),
        // '中国': require('./data/中国.json'),
        // '吉林': require('./data/吉林省.json'),
        '哈尔滨市': require('./data/哈尔滨.json'),
        '佳木斯市': require('./data/佳木斯.json'),
        '绥化市': require('./data/绥化.json'),
        '齐齐哈尔市': require('./data/齐齐哈尔.json'),
        '牡丹江市': require('./data/牡丹江.json')
      },
      option: {
        backgroundColor: '#333', // 画布颜色
        geo: [{
          map: 'js',
          aspectScale: 0.9,
          roam: true, // 是否允许缩放
          zoom: 1.1, // 默认显示级别
          center: [126.604978, 50.285506], // 地图中心点坐标
          layoutSize: '95%',
          layoutCenter: ['50%', '50%'],
          label: {
            normal: {
              show: true, // 是否地图显示区域的文字,各省市的名字
              textStyle: {
                color: '#fff'
              }
            },
            emphasis: {
              textStyle: {
                color: '#fff'
              }
            }
          },
          itemStyle: {
            // 区域颜色
            areaColor: {
              type: 'radial',
              x: 0.7,
              y: 0.5,
              r: 0.4,
              // 渐变效果
              colorStops: [{
                offset: 0,
                color: '#0160AD' // 0% 处的颜色
              }, {
                offset: 1,
                color: '#0160AD' // 100% 处的颜色
              }],
              global: false // 缺省为 false
            },
            emphasis: {
              areaColor: 'blue', // 鼠标移入区域背景颜色
              borderWidth: 0
            },
            borderColor: '#37C1FD',
            borderWidth: 2
          },
          emphasis: {
            itemStyle: {
              areaColor: '#0160AD'
            },
            label: {
              show: 1,
              color: '#fff'
            }
          },
          zlevel: 3
        }],
        series: [{
          type: 'effectScatter',
          coordinateSystem: 'geo',
          // symbol: 'diamond',
          showEffectOn: 'render',
          rippleEffect: {
            period: 10,
            scale: 6,
            brushType: 'fill'
          },
          zlevel: 10, // 这里是关键,一定要放在 series中,显示层级,
          hoverAnimation: true,
          itemStyle: {
            normal: {
              // 点的颜色可以根据 params 参数里面的值去设定不通的颜色
              color: function (params) {
                return 'red';
              },
              shadowBlur: 10,
              shadowColor: '#333'
            }
          },
          data: [] // 点的数据,包含经纬度
        }]
      },
      // 项目点数据
      cityData: {
        '哈尔滨市': [
          {
            name: '项目01',
            value: [126.957401, 45.454116]
          },
          {
            name: '项目02',
            value: [126.394846, 45.778706]
          },
          {
            name: '项目03',
            value: [126.606415, 45.807463]
          },
          {
            name: '项目04',
            value: [126.483958, 45.876779]
          },
          {
            name: '项目0',
            value: [126.785501, 45.739871]
          }
        ],
        '佳木斯市': [
          {
            name: '项目01',
            value: [130.386197, 46.89112]
          },
          {
            name: '项目02',
            value: [129.921666, 46.851692]
          }
        ],
        '绥化市': [
          {
            name: '项目01',
            value: [127.006269, 46.660841]
          },
          {
            name: '项目02',
            value: [127.076409, 46.608961]
          }
        ],
        '齐齐哈尔市': [
          {
            name: '项目01',
            value: [123.895976, 47.331121]
          },
          {
            name: '项目02',
            value: [124.008659, 47.424847]
          }
        ],
        '牡丹江市': [
          {
            name: '项目01',
            value: [129.646281, 44.5897]
          },
          {
            name: '项目02',
            value: [129.549695, 44.618452]
          }
        ]
      }
    };
  },
  mounted () {
    this.drawMap(this.mapData['黑龙江'], 0);
  },
  methods: {
    int () {
      this.drawMap(this.mapData['黑龙江'], 0);
    },
    setMapCenterZoomData (data, zoom, center) {
      this.option.series[0].data = data;
      this.option.geo[0].zoom = zoom;
      this.option.geo[0].center = center;
    },
    drawMap (json, type = 0, city) {
      this.echarts = echarts;
      this.dom = document.getElementById('bmapChartBox');
      this.myChart = this.echarts.init(this.dom);
      this.echarts.registerMap('js', json);

      if (type == 1) {
        let data = this.cityData[city];
        this.setMapCenterZoomData(data, 10, data[0].value);
      } else {
        this.myChart.clear();
        this.setMapCenterZoomData([], 1, [126.82862, 49.296976]);
      }

      this.myChart.setOption(this.option);
      this.myChart.off('click');
      this.myChart.on('click', (param) => {
        console.log(param);
        const city = param.name;
        this.mapData[city] && this.myChart.clear();
        this.mapData[city] && this.drawMap(this.mapData[city], 1, param.name);
      });
    }
  }
};
</script>
<style lang="less" scoped>
.echart-bmap_wrapper {
  position:relative;
  .btn {
    position:absolute;
    left: 20px;
    top:20px;
    z-index: 1;
  }
  .bmap-box {
    width: 100%;
    height:90vh;
  }
}
</style>
对应的地图的json数据,可以到高德地图提供的下载地址可以下载显示。
最近事情比较多,心里也想了很多事情,一直都不在状态,希望会慢慢变好。


 2231
2231

 被折叠的 条评论
为什么被折叠?
被折叠的 条评论
为什么被折叠?
 到【灌水乐园】发言


