


1.Filebeat介绍
1.1 Filebeat是什么
Filebeat是用于转发和集中日志数据的轻量级传送工具。Filebeat监视您指定的日志文件或位置,收集日志事件,并将它们转发到Elasticsearch或 Logstash进行索引。
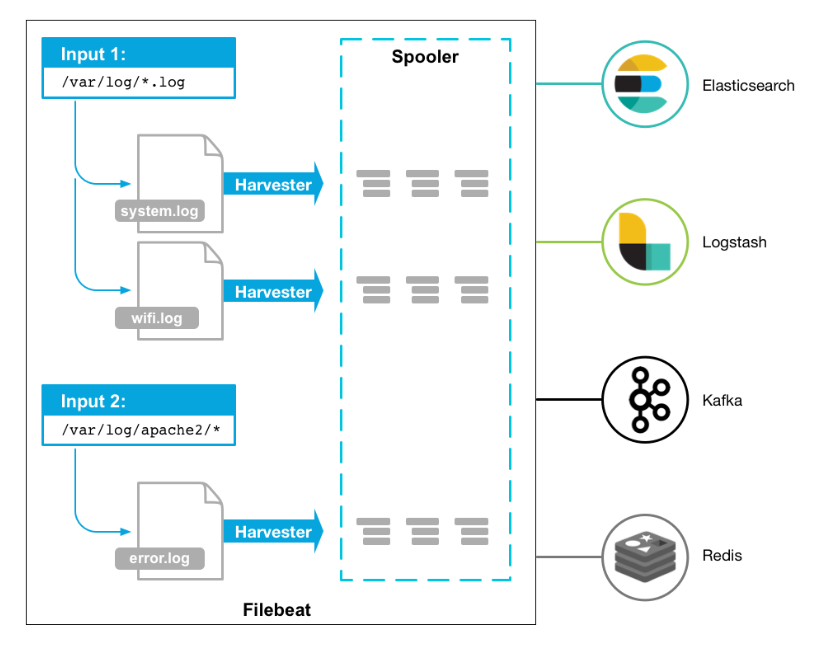
Filebeat的工作方式如下:启动Filebeat时,它将启动一个或多个输入,这些输入将在为日志数据指定的位置中查找。对于Filebeat所找到的每个日志,Filebeat都会启动收集器。每个收集器都读取单个日志以获取新内容,并将新日志数据发送到libbeat,libbeat将聚集事件,并将聚集的数据发送到为Filebeat配置的输出。
工作的流程图如下:
1.2 Filebeat和beats的关系
首先filebeat是Beats中的一员,Beats在是一个轻量级日志采集器,其实Beats家族有6个成员,早期的ELK架构中使用Logstash收集、解析日志,但是Logstash对内存、cpu、io等资源消耗比较高。相比Logstash,Beats所占系统的CPU和内存几乎可以忽略不计。
目前Beats包含六种工具:
- Packetbeat:网络数据(收集网络流量数据)
- Metricbeat:指标(收集系统、进程和文件系统级别的CPU和内存使用情况等数据)
- Filebeat:日志文件(收集文件数据)
- Winlogbeat:windows事件日志(收集Windows事件日志数据)
- Auditbeat:审计数据(收集审计日志)
- Heartbeat:运行时间监控(收集系统运行时的数据)
1.3 Filebeat和logstash的关系
因为logstash是jvm跑的,资源消耗比较大,所以后来作者又用golang写了一个功能较少但是资源消耗也小的轻量级的logstash-forwarder。不过作者只是一个人,加入http://elastic.co公司以后,因为es公司本身还收购了另一个开源项目packetbeat,而这个项目专门就是用golang的,有整个团队,所以es公司干脆把logstash-forwarder的开发工作也合并到同一个golang团队来搞,于是新的项目就叫filebeat了。
1.4 Filebeat的构成
Filebeat结构:由两个组件构成,分别是inputs(输入)和harvesters(收集器),这些组件一起工作来跟踪文件并将事件数据发送到您指定的输出,harvester负责读取单个文件的内容。harvester逐行读取每个文件,并将内容发送到输出。为每个文件启动一个harvester。harvester负责打开和关闭文件,这意味着文件描述符在harvester运行时保持打开状态。如果在收集文件时删除或重命名文件,Filebeat将继续读取该文件。这样做的副作用是,磁盘上的空间一直保留到harvester关闭。默认情况下,Filebeat保持文件打开,直到达到close_inactive
关闭harvester可以会产生的结果:
- 文件处理程序关闭,如果harvester仍在读取文件时被删除,则释放底层资源。
- 只有在scan_frequency结束之后,才会再次启动文件的收集。
- 如果该文件在harvester关闭时被移动或删除,该文件的收集将不会继续
一个input负责管理harvesters和寻找所有来源读取。如果input类型是log,则input将查找驱动器上与定义的路径匹配的所有文件,并为每个文件启动一个harvester。每个input在它自己的Go进程中运行,Filebeat当前支持多种输入类型。每个输入类型可以定义多次。日志输入检查每个文件,以查看是否需要启动harvester、是否已经在运行harvester或是否可以忽略该文件
1.5 Filebeat如何保存文件的状态
Filebeat保留每个文件的状态,并经常将状态刷新到磁盘中的注册表文件中。该状态用于记住harvester读取的最后一个偏移量,并确保发送所有日志行。如果无法访问输出(如Elasticsearch或Logstash),Filebeat将跟踪最后发送的行,并在输出再次可用时继续读取文件。当Filebeat运行时,每个输入的状态信息也保存在内存中。当Filebeat重新启动时,来自注册表文件的数据用于重建状态,Filebeat在最后一个已知位置继续每个harvester。对于每个输入,Filebeat都会保留它找到的每个文件的状态。由于文件可以重命名或移动,文件名和路径不足以标识文件。对于每个文件,Filebeat存储唯一的标识符,以检测文件是否以前被捕获。
1.6 Filebeat何如保证至少一次数据消费
Filebeat保证事件将至少传递到配置的输出一次,并且不会丢失数据。是因为它将每个事件的传递状态存储在注册表文件中。在已定义的输出被阻止且未确认所有事件的情况下,Filebeat将继续尝试发送事件,直到输出确认已接收到事件为止。如果Filebeat在发送事件的过程中关闭,它不会等待输出确认所有事件后再关闭。当Filebeat重新启动时,将再次将Filebeat关闭前未确认的所有事件发送到输出。这样可以确保每个事件至少发送一次,但最终可能会有重复的事件发送到输出。通过设置shutdown_timeout选项,可以将Filebeat配置为在关机前等待特定时间。
2.Filebeat部署
2.1 程序安装
2.1.1 压缩包下载
curl -L -O https://artifacts.elastic.co/downloads/beats/filebeat/filebeat-7.14.1-linux-x86_64.tar.gz
tar -xzvf filebeat-7.14.1-linux-x86_64.tar.gz
当前最新版本为7.14.1
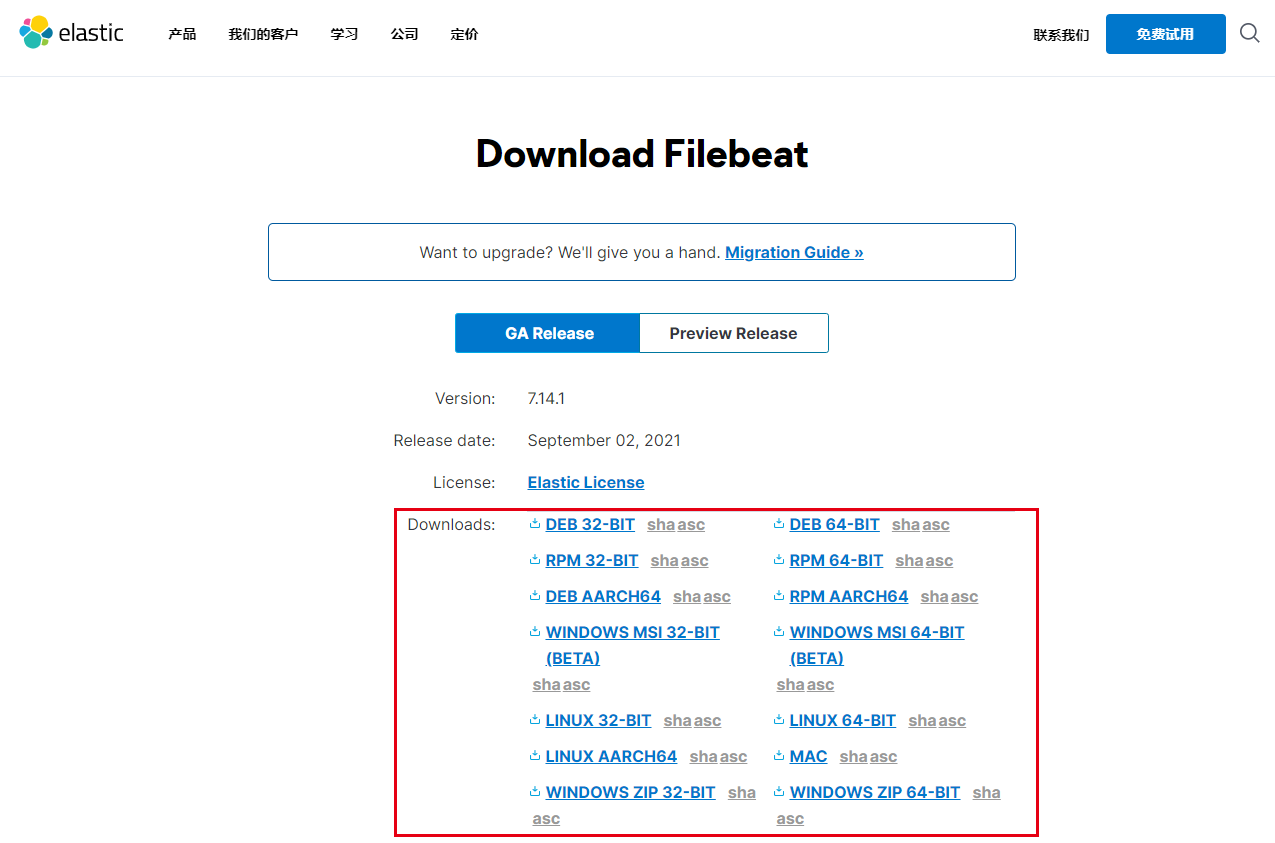
或者通过官网下载压缩包
Download Filebeat • Lightweight Log Analysis | Elastic
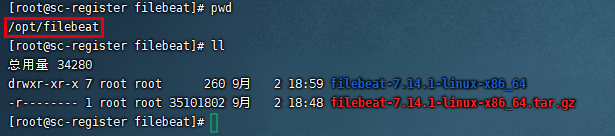
本文以10.0.53.28为例,上传至/opt/filebeatz目录:
2.1.2 rpm 安装
2.1.2.1 获取安装包
wget https://artifacts.elastic.co/downloads/beats/filebeat/filebeat-7.14.1-x86_64.rpm2.1.2.2 配置修改
详见2.2
2.1.2.3 系统命令
启动:systemctl start filebeat

停止:systemctl stop filebeat

重启:systemctl restart filebeat

开机自启动:systemctl enable filebeat

开机不启动:systemctl disable filebeat
2.2 修改配置
配置示例文件:filebeat.reference.yml(包含所有未过时的配置项)
配置文件:filebeat.ym
2.2.1 filebeat.yml配置详解
log输入类型为例:
type: log #input类型为log
enable: true #表示是该log类型配置生效
paths:     #指定要监控的日志,目前按照Go语言的glob函数处理。没有对配置目录做递归处理,比如配置的如果是:
- /var/log/* /*.log  #则只会去/var/log目录的所有子目录中寻找以".log"结尾的文件,而不会寻找/var/log目录下以".log"结尾的文件。
recursive_glob.enabled: #启用全局递归模式,例如/foo/**包括/foo, /foo/*, /foo/*/*
encoding:#指定被监控的文件的编码类型,使用plain和utf-8都是可以处理中文日志的
exclude_lines: ['^DBG'] #不包含匹配正则的行
include_lines: ['^ERR', '^WARN']  #包含匹配正则的行
harvester_buffer_size: 16384 #每个harvester在获取文件时使用的缓冲区的字节大小
max_bytes: 10485760 #单个日志消息可以拥有的最大字节数。max_bytes之后的所有字节都被丢弃而不发送。默认值为10MB (10485760)
exclude_files: ['\.gz$']  #用于匹配希望Filebeat忽略的文件的正则表达式列表
ingore_older: 0 #默认为0,表示禁用,可以配置2h,2m等,注意ignore_older必须大于close_inactive的值.表示忽略超过设置值未更新的
文件或者文件从来没有被harvester收集
close_* #close_ *配置选项用于在特定标准或时间之后关闭harvester。 关闭harvester意味着关闭文件处理程序。 如果在harvester关闭
后文件被更新,则在scan_frequency过后,文件将被重新拾取。 但是,如果在harvester关闭时移动或删除文件,Filebeat将无法再次接收文件
,并且harvester未读取的任何数据都将丢失。
close_inactive  #启动选项时,如果在制定时间没有被读取,将关闭文件句柄
读取的最后一条日志定义为下一次读取的起始点,而不是基于文件的修改时间
如果关闭的文件发生变化,一个新的harverster将在scan_frequency运行后被启动
建议至少设置一个大于读取日志频率的值,配置多个prospector来实现针对不同更新速度的日志文件
使用内部时间戳机制,来反映记录日志的读取,每次读取到最后一行日志时开始倒计时使用2h 5m 来表示
close_rename #当选项启动,如果文件被重命名和移动,filebeat关闭文件的处理读取
close_removed #当选项启动,文件被删除时,filebeat关闭文件的处理读取这个选项启动后,必须启动clean_removed
close_eof #适合只写一次日志的文件,然后filebeat关闭文件的处理读取
close_timeout #当选项启动时,filebeat会给每个harvester设置预定义时间,不管这个文件是否被读取,达到设定时间后,将被关闭
close_timeout 不能等于ignore_older,会导致文件更新时,不会被读取如果output一直没有输出日志事件,这个timeout是不会被启动的,
至少要要有一个事件发送,然后haverter将被关闭
设置0 表示不启动
clean_inactived #从注册表文件中删除先前收获的文件的状态
设置必须大于ignore_older+scan_frequency,以确保在文件仍在收集时没有删除任何状态
配置选项有助于减小注册表文件的大小,特别是如果每天都生成大量的新文件
此配置选项也可用于防止在Linux上重用inode的Filebeat问题
clean_removed #启动选项后,如果文件在磁盘上找不到,将从注册表中清除filebeat
如果关闭close removed 必须关闭clean removed
scan_frequency #prospector检查指定用于收获的路径中的新文件的频率,默认10s
tail_files:#如果设置为true,Filebeat从文件尾开始监控文件新增内容,把新增的每一行文件作为一个事件依次发送,
而不是从文件开始处重新发送所有内容。
symlinks:#符号链接选项允许Filebeat除常规文件外,可以收集符号链接。收集符号链接时,即使报告了符号链接的路径,
Filebeat也会打开并读取原始文件。
backoff: #backoff选项指定Filebeat如何积极地抓取新文件进行更新。默认1s,backoff选项定义Filebeat在达到EOF之后
再次检查文件之间等待的时间。
max_backoff: #在达到EOF之后再次检查文件之前Filebeat等待的最长时间
backoff_factor: #指定backoff尝试等待时间几次,默认是2
harvester_limit:#harvester_limit选项限制一个prospector并行启动的harvester数量,直接影响文件打开数

tags #列表中添加标签,用过过滤,例如:tags: ["json"]
fields #可选字段,选择额外的字段进行输出可以是标量值,元组,字典等嵌套类型
默认在sub-dictionary位置
filebeat.inputs:
fields:
app_id: query_engine_12
fields_under_root #如果值为ture,那么fields存储在输出文档的顶级位置

multiline.pattern #必须匹配的regexp模式
multiline.negate #定义上面的模式匹配条件的动作是 否定的,默认是false
假如模式匹配条件'^b',默认是false模式,表示讲按照模式匹配进行匹配 将不是以b开头的日志行进行合并
如果是true,表示将不以b开头的日志行进行合并
multiline.match # 指定Filebeat如何将匹配行组合成事件,在之前或者之后,取决于上面所指定的negate
multiline.max_lines #可以组合成一个事件的最大行数,超过将丢弃,默认500
multiline.timeout #定义超时时间,如果开始一个新的事件在超时时间内没有发现匹配,也将发送日志,默认是5smax_procs #设置可以同时执行的最大CPU数。默认值为系统中可用的逻辑CPU的数量。name #为该filebeat指定名字,默认为主机的hostname
2.2.2 本地配置
###################### Filebeat Configuration Example #########################

# This file is an example configuration file highlighting only the most common
# options. The filebeat.reference.yml file from the same directory contains all the
# supported options with more comments. You can use it as a reference.
#
# You can find the full configuration reference here:
# https://www.elastic.co/guide/en/beats/filebeat/index.html

# For more available modules and options, please see the filebeat.reference.yml sample
# configuration file.

#=========================== Filebeat inputs =============================

filebeat.inputs:

# Each - is an input. Most options can be set at the input level, so
# you can use different inputs for various configurations.
# Below are the input specific configurations.

 - type: log

  # Change to true to enable this input configuration.
   enabled: true

  # Paths that should be crawled and fetched. Glob based paths.
   paths:
     - /var/lib/docker/containers/*/*.log
     - /opt/smartcity-server/*/*.log
     - /opt/smartcity-server/app/*/*.log
     - /opt/smartcity-server/*/logs/*/*.log
    #- /var/log/*.log
    #- c:\programdata\elasticsearch\logs\*

  # Exclude lines. A list of regular expressions to match. It drops the lines that are
  # matching any regular expression from the list.
  #exclude_lines: ['^DBG']

  # Include lines. A list of regular expressions to match. It exports the lines that are
  # matching any regular expression from the list.
  #include_lines: ['^ERR', '^WARN']

  # Exclude files. A list of regular expressions to match. Filebeat drops the files that
  # are matching any regular expression from the list. By default, no files are dropped.
  #exclude_files: ['.gz$']

  # Optional additional fields. These fields can be freely picked
  # to add additional information to the crawled log files for filtering
   fields:
     index: 'UNI_SC_APP_PLATFORM'
  #  level: debug
  #  review: 1

  ### Multiline options

  # Multiline can be used for log messages spanning multiple lines. This is common
  # for Java Stack Traces or C-Line Continuation

  # The regexp Pattern that has to be matched. The example pattern matches all lines starting with [
  # multiline.pattern: '^([0-9]{4}|[0-9]{2})-[0-9]{2}'

  # Defines if the pattern set under pattern should be negated or not. Default is false.
  # multiline.negate: true

  # Match can be set to "after" or "before". It is used to define if lines should be append to a pattern
  # that was (not) matched before or after or as long as a pattern is not matched based on negate.
  # Note: After is the equivalent to previous and before is the equivalent to to next in Logstash
  # multiline.match: after
  # multiline.timeout: 10s


#============================= Filebeat modules ===============================

filebeat.config.modules:
  # Glob pattern for configuration loading
  path: ${path.config}/modules.d/*.yml

  # Set to true to enable config reloading
  reload.enabled: false

  # Period on which files under path should be checked for changes
  #reload.period: 10s

#==================== Elasticsearch template setting ==========================

setup.template.name: "filebeat.template.json"
setup.template.fields: "filebeat.template.json"
setup.template.overwrite: true
setup.template.enabled: false
setup.template.settings:
  index.number_of_shards: 1
  #index.codec: best_compression
  #_source.enabled: false

#================================ General =====================================

# The name of the shipper that publishes the network data. It can be used to group
# all the transactions sent by a single shipper in the web interface.
#name:

# The tags of the shipper are included in their own field with each
# transaction published.
#tags: ["service-X", "web-tier"]

# Optional fields that you can specify to add additional information to the
# output.
#fields:
#  env: staging


#============================== Dashboards =====================================
# These settings control loading the sample dashboards to the Kibana index. Loading
# the dashboards is disabled by default and can be enabled either by setting the
# options here or by using the `setup` command.
#setup.dashboards.enabled: false

# The URL from where to download the dashboards archive. By default this URL
# has a value which is computed based on the Beat name and version. For released
# versions, this URL points to the dashboard archive on the artifacts.elastic.co
# website.
#setup.dashboards.url:

#============================== Kibana =====================================

# Starting with Beats version 6.0.0, the dashboards are loaded via the Kibana API.
# This requires a Kibana endpoint configuration.
setup.kibana:

  # Kibana Host
  # Scheme and port can be left out and will be set to the default (http and 5601)
  # In case you specify and additional path, the scheme is required: http://localhost:5601/path
  # IPv6 addresses should always be defined as: https://[2001:db8::1]:5601
  #host: "localhost:5601"

  # Kibana Space ID
  # ID of the Kibana Space into which the dashboards should be loaded. By default,
  # the Default Space will be used.
  #space.id:

#============================= Elastic Cloud ==================================

# These settings simplify using filebeat with the Elastic Cloud (https://cloud.elastic.co/).

# The cloud.id setting overwrites the `output.elasticsearch.hosts` and
# `setup.kibana.host` options.
# You can find the `cloud.id` in the Elastic Cloud web UI.
#cloud.id:

# The cloud.auth setting overwrites the `output.elasticsearch.username` and
# `output.elasticsearch.password` settings. The format is `<user>:<pass>`.
#cloud.auth:

#================================ Outputs =====================================

# Configure what output to use when sending the data collected by the beat.

#-------------------------- Elasticsearch output ------------------------------
output.elasticsearch:
  # Array of hosts to connect to.
  hosts: ["10.7.6.9:9200","10.7.6.10:9200","10.7.6.11:9200"]

  # Optional protocol and basic auth credentials.
  #protocol: "https"
  #username: "elastic"
  #password: "changeme"
  indices:
    - index: "UNI_SC_APP_PLATFORM-%{+yyyy.MM.dd}"
      when.contains:
        fields:
          index: "UNI_SC_APP_PLATFORM"
  document_type: log
  max_retries: 3
#----------------------------- Logstash output --------------------------------
#output.logstash:
  # The Logstash hosts
  #hosts: ["localhost:5044"]

  # Optional SSL. By default is off.
  # List of root certificates for HTTPS server verifications
  #ssl.certificate_authorities: ["/etc/pki/root/ca.pem"]

  # Certificate for SSL client authentication
  #ssl.certificate: "/etc/pki/client/cert.pem"

  # Client Certificate Key
  #ssl.key: "/etc/pki/client/cert.key"

#================================ Processors =====================================

# Configure processors to enhance or manipulate events generated by the beat.

processors:
  - add_host_metadata: ~
  - add_cloud_metadata: ~
  - drop_fields:
      fields: ["input_type","offset","stream","beat"]

#================================ Logging =====================================

# Sets log level. The default log level is info.
# Available log levels are: error, warning, info, debug
#logging.level: debug

# At debug level, you can selectively enable logging only for some components.
# To enable all selectors use ["*"]. Examples of other selectors are "beat",
# "publish", "service".
#logging.selectors: ["*"]

#============================== Xpack Monitoring ===============================
# filebeat can export internal metrics to a central Elasticsearch monitoring
# cluster.  This requires xpack monitoring to be enabled in Elasticsearch.  The
# reporting is disabled by default.

# Set to true to enable the monitoring reporter.
#xpack.monitoring.enabled: false

# Uncomment to send the metrics to Elasticsearch. Most settings from the
# Elasticsearch output are accepted here as well. Any setting that is not set is
# automatically inherited from the Elasticsearch output configuration, so if you
# have the Elasticsearch output configured, you can simply uncomment the
# following line.
#xpack.monitoring.elasticsearch:

#================================= Migration ==================================

# This allows to enable 6.7 migration aliases
#migration.6_to_7.enabled: true
2.2.2.1 日志路径
   paths:
     - /var/lib/docker/containers/*/*.log
     - /opt/smartcity-server/*/*.log
     - /opt/smartcity-server/app/*/*.log
     - /opt/smartcity-server/*/logs/*/*.log
2.2.2.2 文件索引
建议各项目组使用对应产品编号作为前缀,后续拼接项目组,如一组平台组:UNI_SC_APP_PLATFORM
   fields:
     index: 'UNI_SC_APP_PLATFORM'
2.2.2.3 Elasticsearch配置
Configure the Elasticsearch output | Elastic Documentation
output.elasticsearch:
  # Array of hosts to connect to.
  hosts: ["10.7.6.9:9200","10.7.6.10:9200","10.7.6.11:9200"]

  # Optional protocol and basic auth credentials.
  #protocol: "https"
  #username: "elastic"
  #password: "changeme"
  indices:
    - index: "UNI_SC_APP_PLATFORM-%{+yyyy.MM.dd}"
      when.contains:
        fields:
          index: "UNI_SC_APP_PLATFORM"
  document_type: log
  max_retries: 3
2.3 服务启动
2.3.1 启动Filebeat
2.3.1.1 压缩包常规启动
./filebeat -e
或者
./filebeat -c filebeat.yml -e
后台启动
 nohup ./filebeat -e -c filebeat.yml -d "Publish" & > nohup.out

# 将所有标准输出及标准错误输出到/dev/null空设备,即没有任何输出
 nohup ./filebeat -e -c filebeat.yml >/dev/null 2>&1 &

 ps -ef | grep filebeat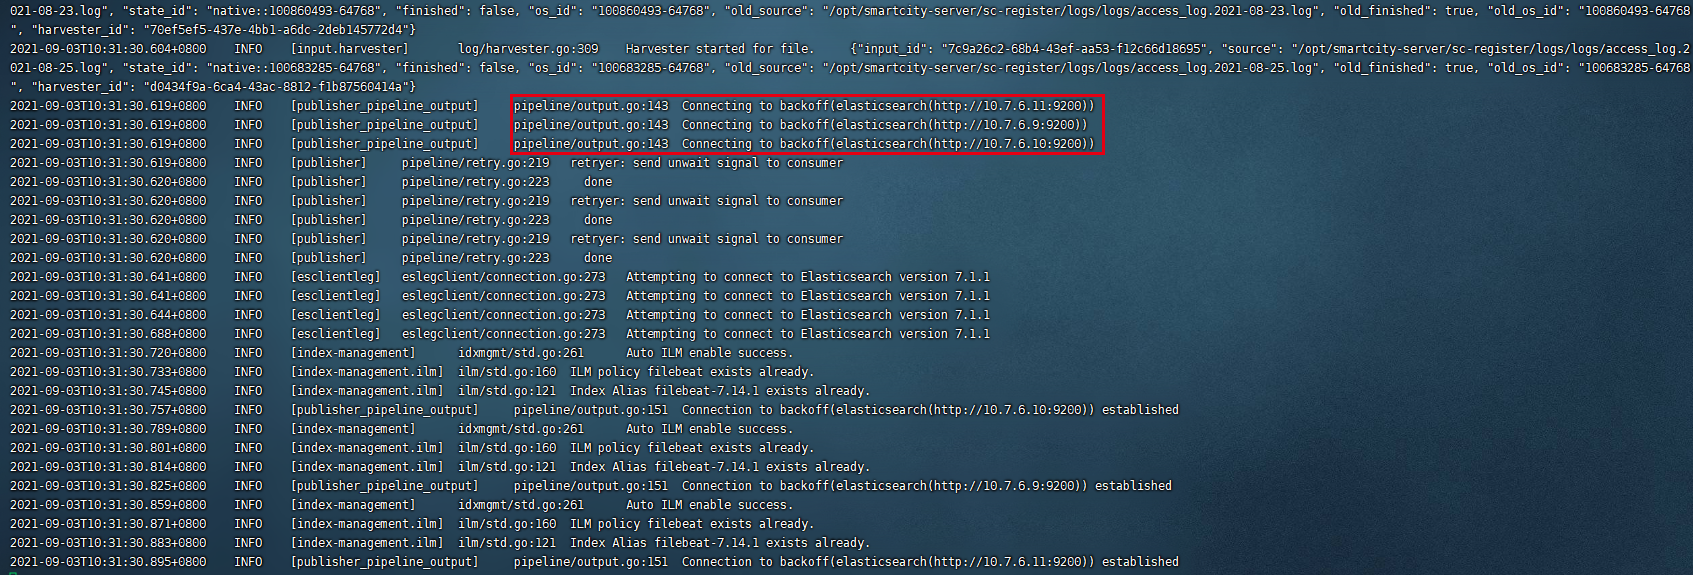
2.3.1.2 systemctl启动
2.3.1.2.1 进入系统目录
cd /usr/lib/systemd/system2.3.1.2.2 新建filebeat启动命令文件
touch filebeat.service2.3.1.2.3 文件内容
vi filebeat.service[Unit]
Description=filebeat server daemon
Documentation=/opt/filebeat//filebeat-7.14.1-linux-x86_64/filebeat -help
Wants=network-online.target
After=network-online.target
[Service]
User=root
Group=root
Environment="BEAT_CONFIG_OPTS=-c /opt/filebeat//filebeat-7.14.1-linux-x86_64/filebeat.yml"
ExecStart=/opt/filebeat//filebeat-7.14.1-linux-x86_64/filebeat $BEAT_CONFIG_OPTS
Restart=always
[Install]
WantedBy=multi-user.target注:/opt/filebeat//filebeat-7.14.1-linux-x86_64 为filebeat安装目录。
2.3.1.2.1 刷新配置
systemctl daemon-reload2.3.1.2.5 启动、关闭、查看状态
# 启动
systemctl start filebeat

# 查看状态
systemctl status filebeat

ps -ef | grep filebeat

# 关闭
systemctl stop filebeat
2.3.1.3 RPM安装启动
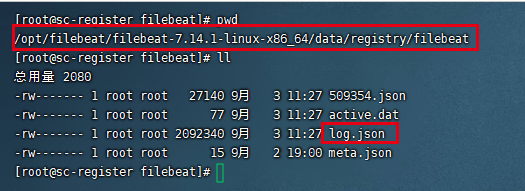
systemctl start filebeat2.3.2 查看数据文件
2.3.2.1 查看Filebeat记录数据
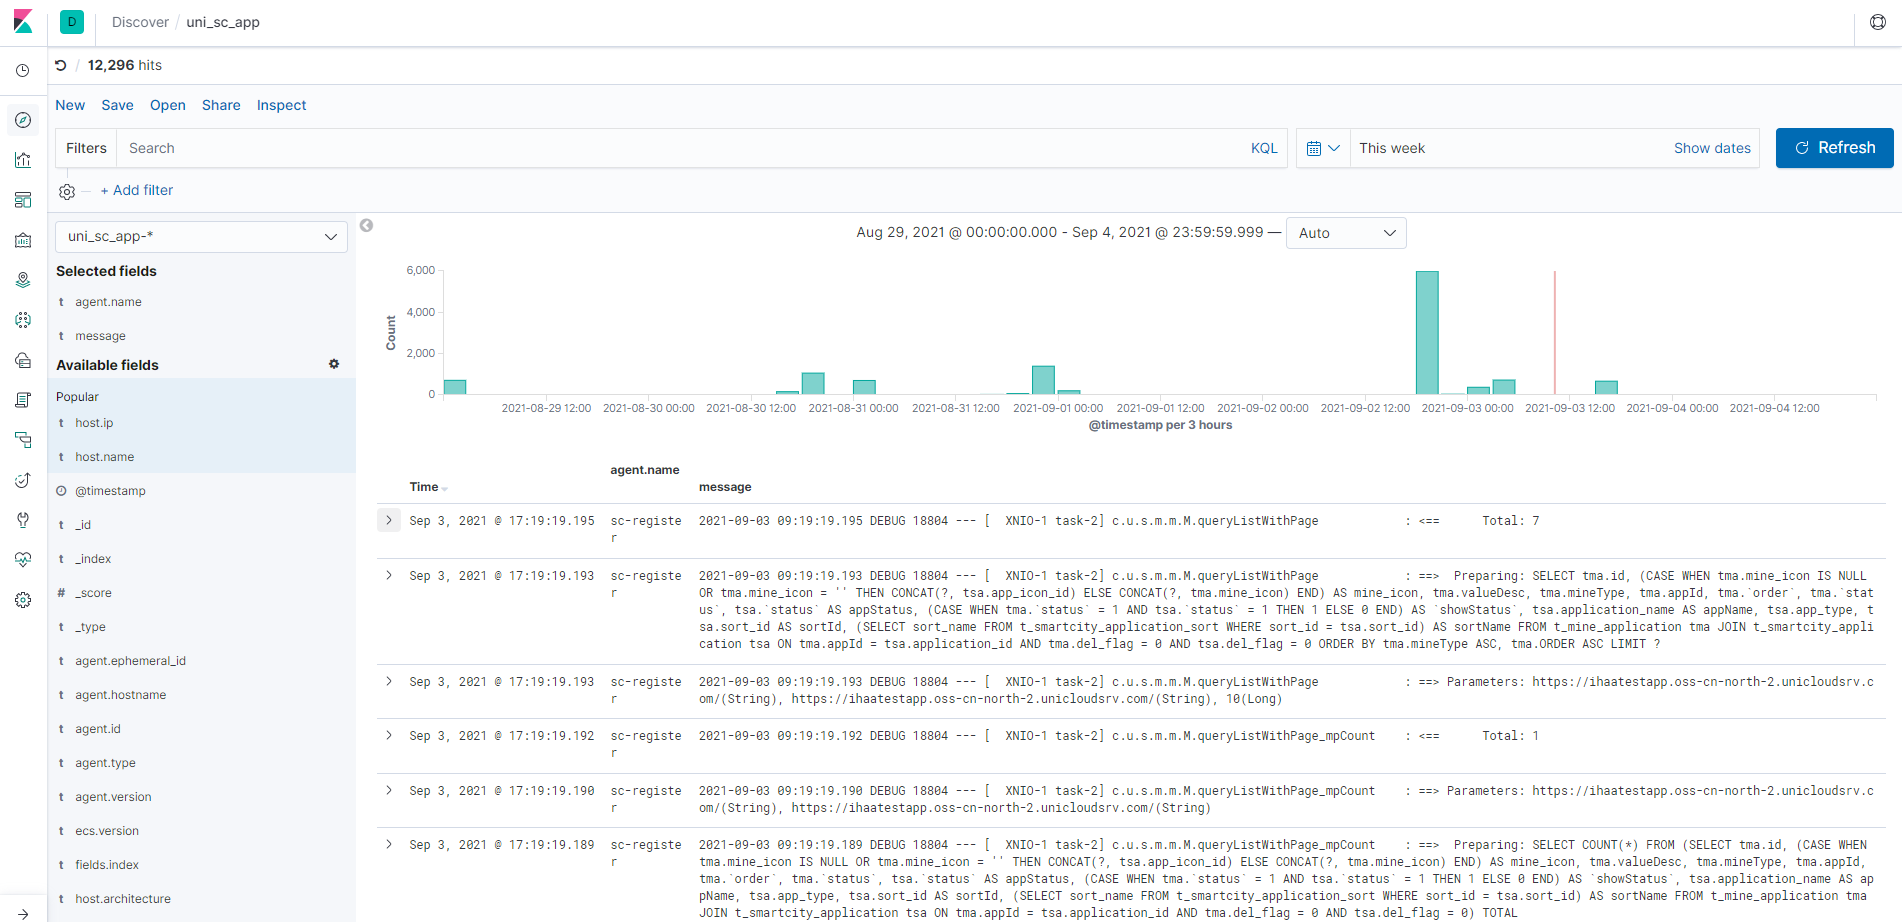
2.3.2.2 查看ELK日志数据
3.测试环境试用ELK
3.1 环境准备
3.2 配置Index Pattern
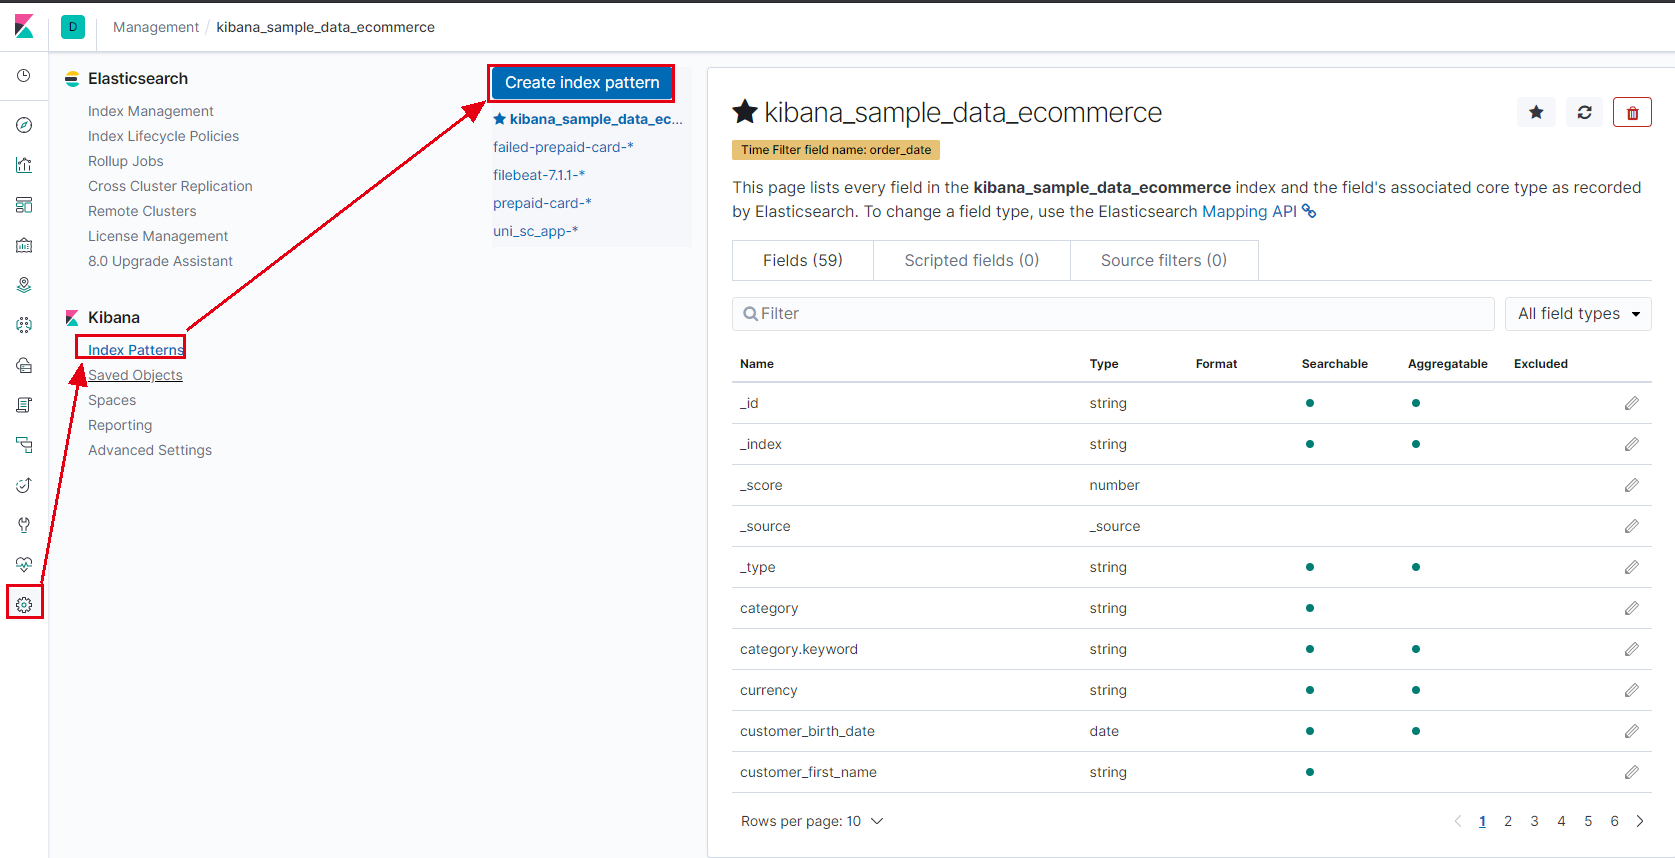
-
- 各组使用对应产品编号,例如:app-*;注:名称小写
- ndex Pattern建议与filebeat.yml中fields.index/output.elasticsearch.indices.index保持一致;
3.2 日志查询


 545
545

 被折叠的 条评论
为什么被折叠?
被折叠的 条评论
为什么被折叠?
 到【灌水乐园】发言


