


前置依赖:
gradle 7.5.1:Gradle | Releases
配置gradle阿里云镜像
1、找到您的 GRADLE_HOME 目录,这通常是您安装Gradle的目录。
2、在 GRADLE_HOME/init.d/ 目录下新建一个文件,命名为 init.gradle。
3、编辑 init.gradle 文件,添加以下内容:
allprojects {
    repositories {
        mavenLocal()
        maven { url 'https://maven.aliyun.com/repository/public/' }
        maven { url 'https://maven.aliyun.com/repository/jcenter/' }
        maven { url 'https://maven.aliyun.com/repository/google/' }
        maven { url 'https://maven.aliyun.com/repository/gradle-plugin/' }
    }
}
openJDK 17:https://download.oracle.com/java/17/latest/jdk-17_windows-x64_bin.exe
idea:IntelliJ IDEA 2022.1 (Ultimate Edition)
1、下载源码 8.6.2 zip包 并解压
地址:Releases · elastic/elasticsearch · GitHub
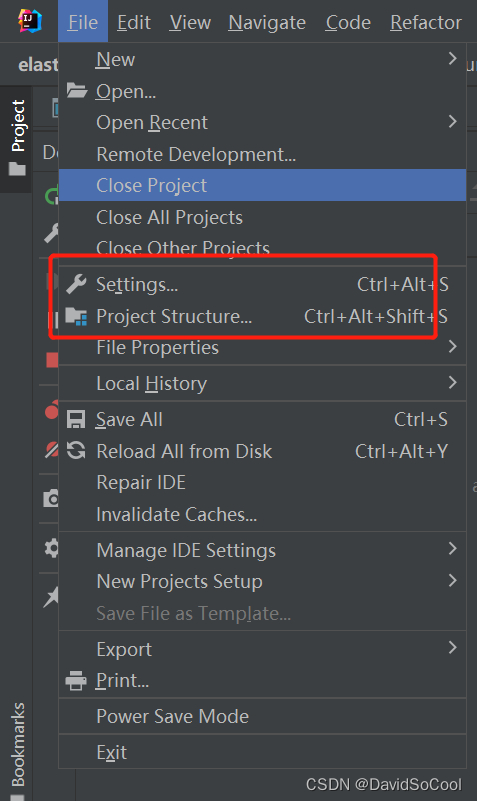
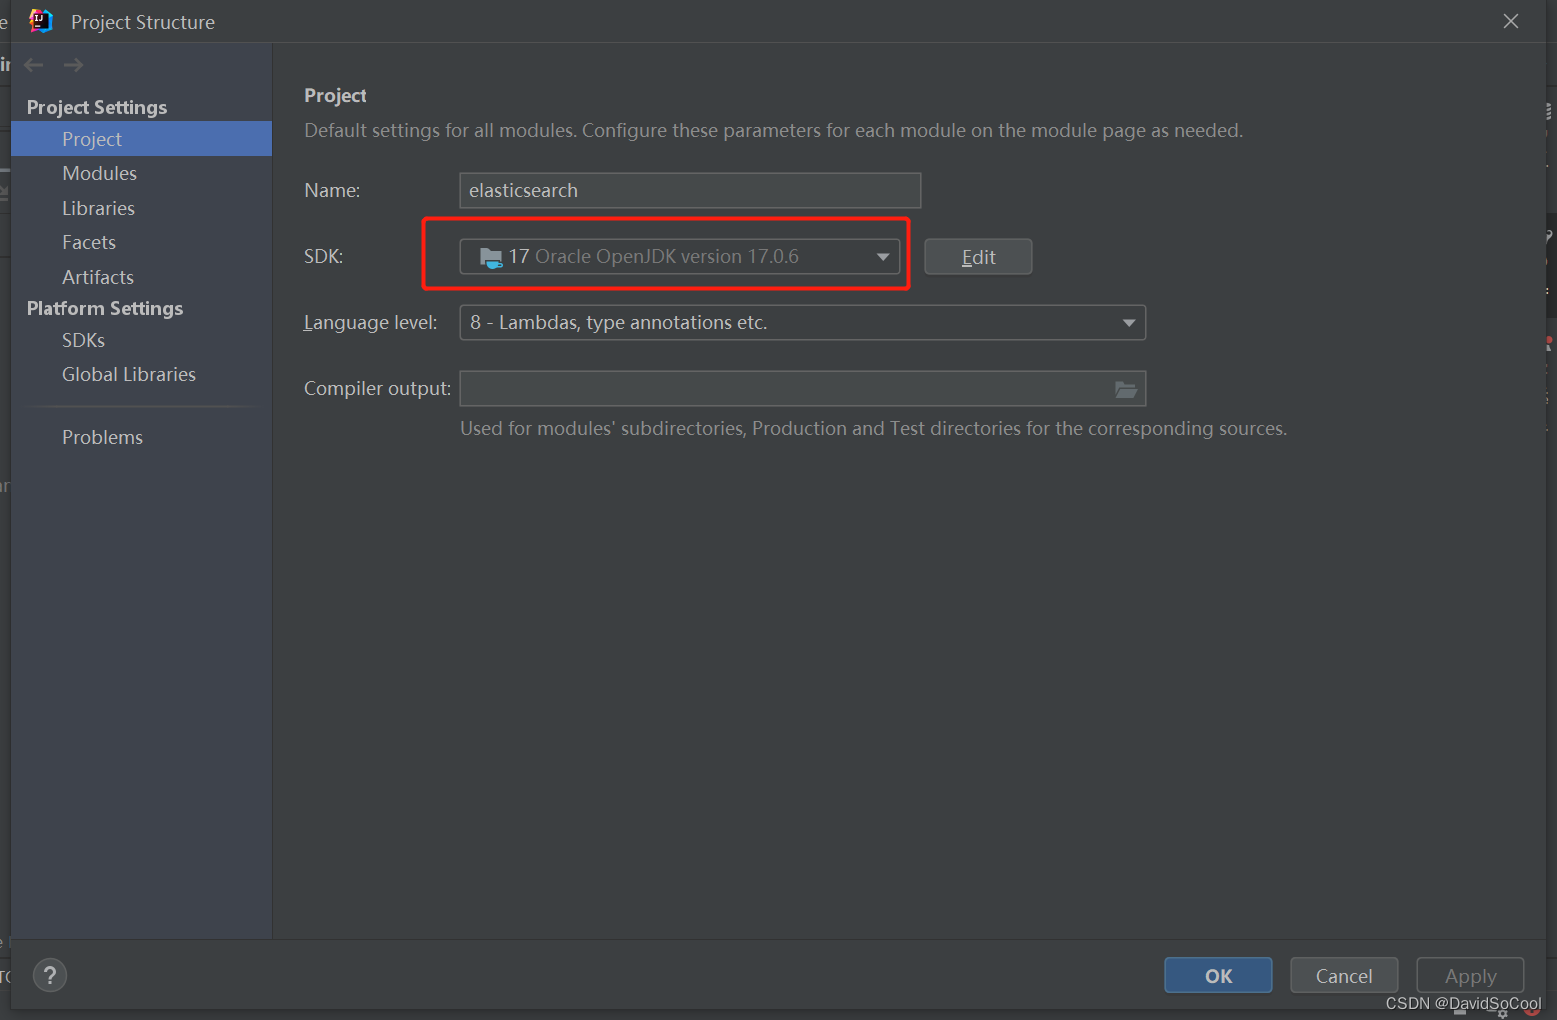
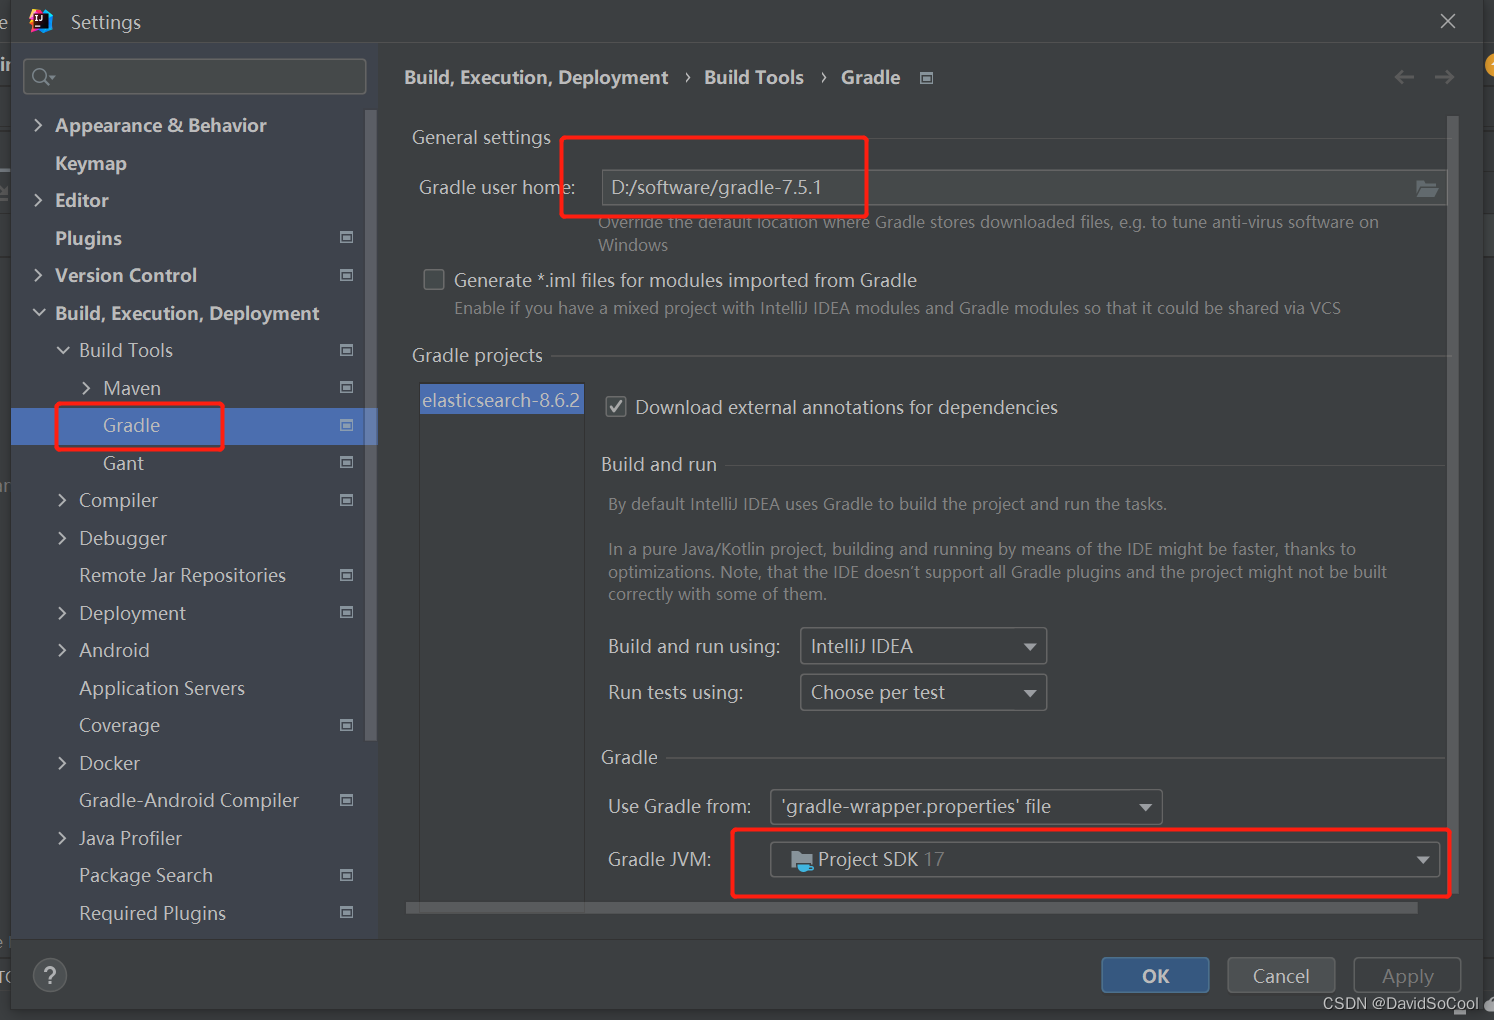
2、idea打开项目工程,设置gradle和jdk
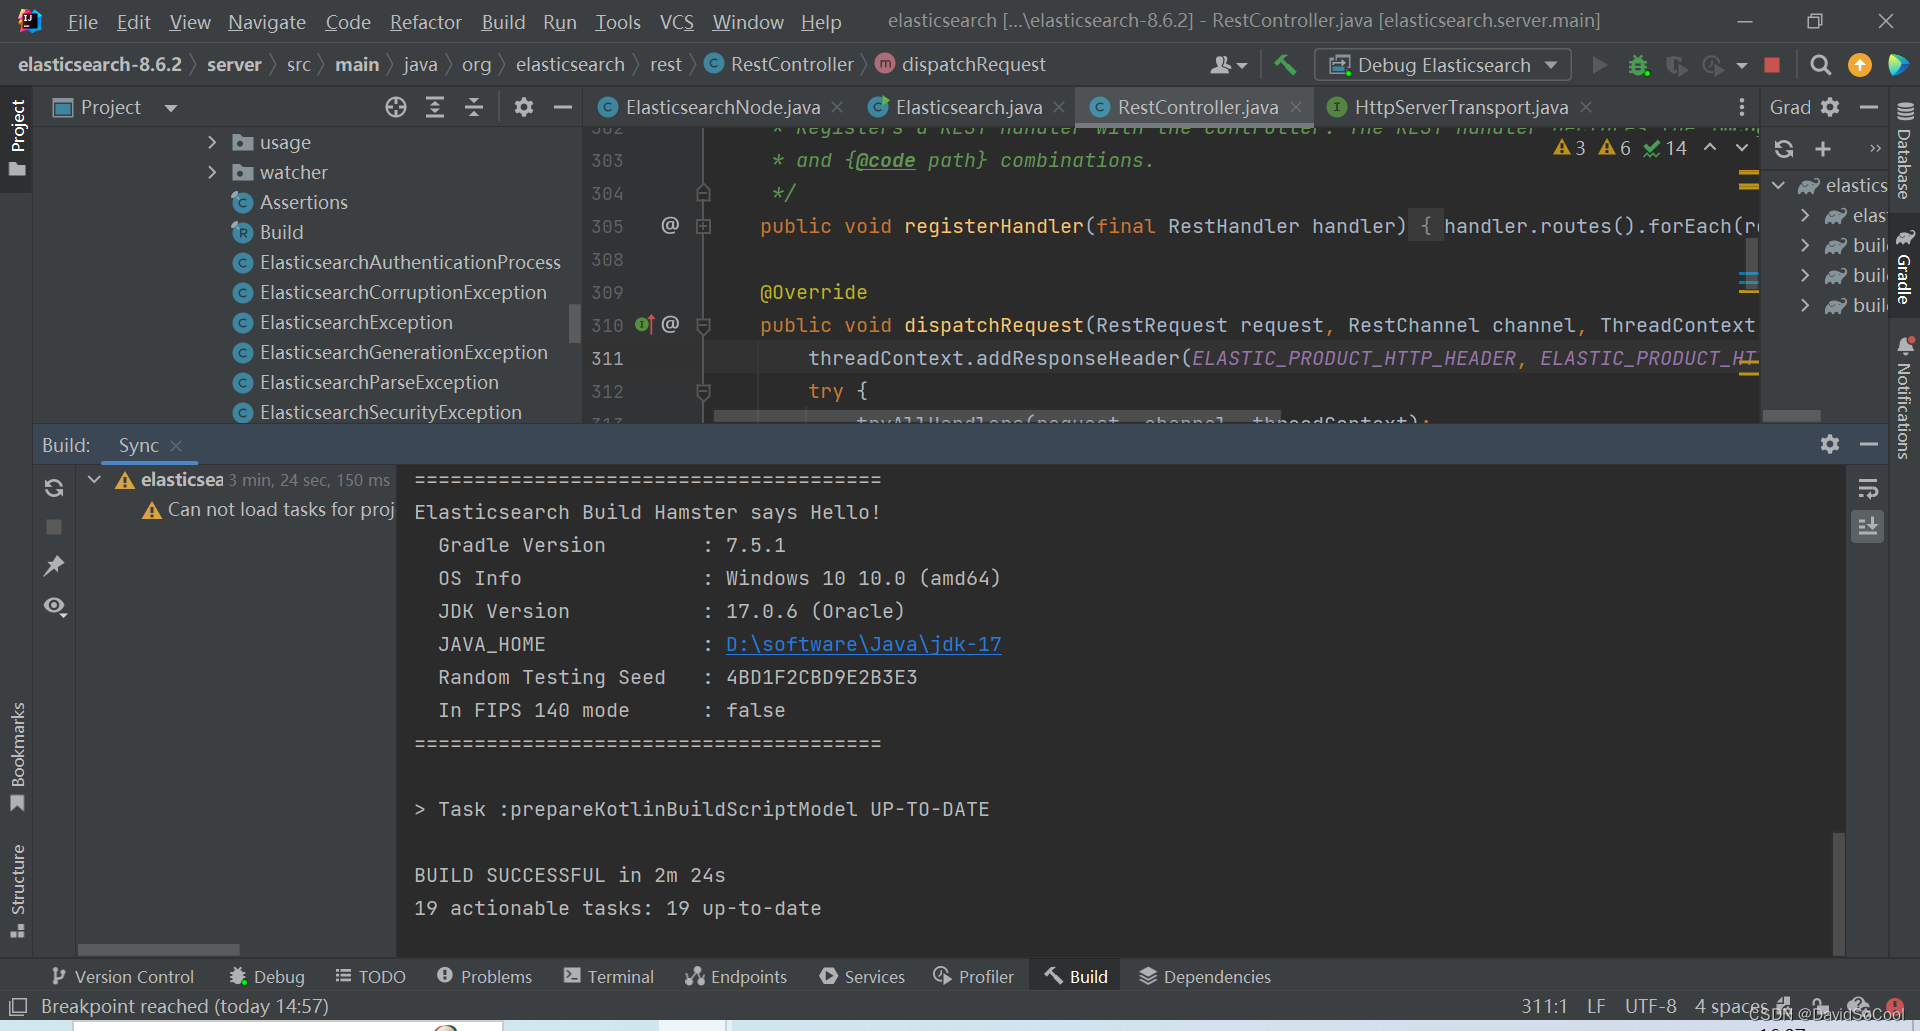
4、确定后等待初次构建完成
5、cmd进入源码目录
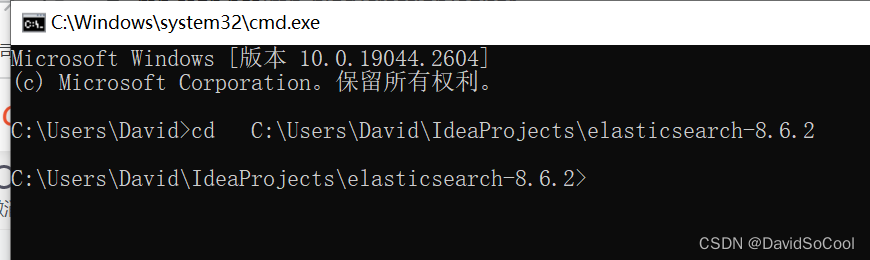
6、运行源码
.\gradlew run该版本默认开启了权限,访问localhost:9200需要输入账号密码
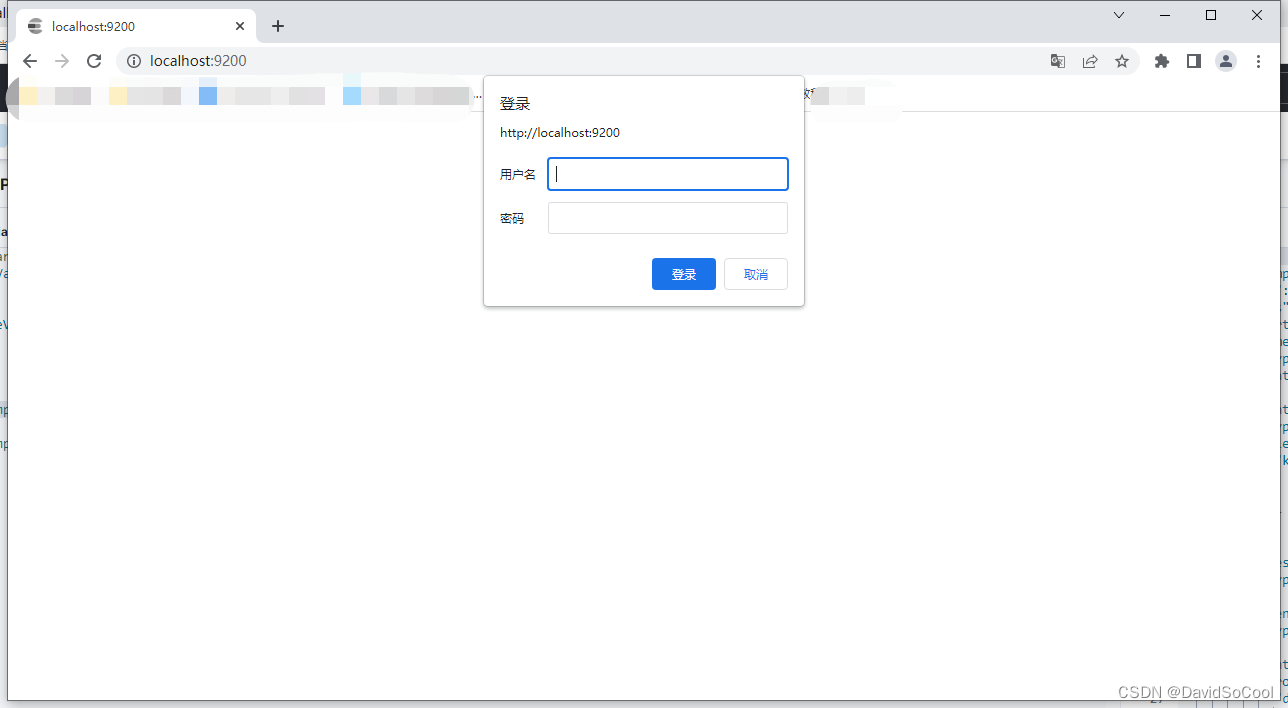
禁用安全策略启动
.\gradlew run -Dtests.es.xpack.security.enabled=false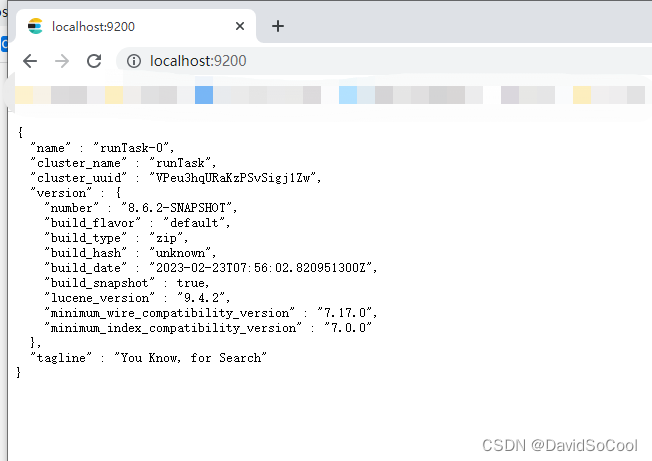
7、debug源码
打开idea es代码,配置debug参数,ok后运行
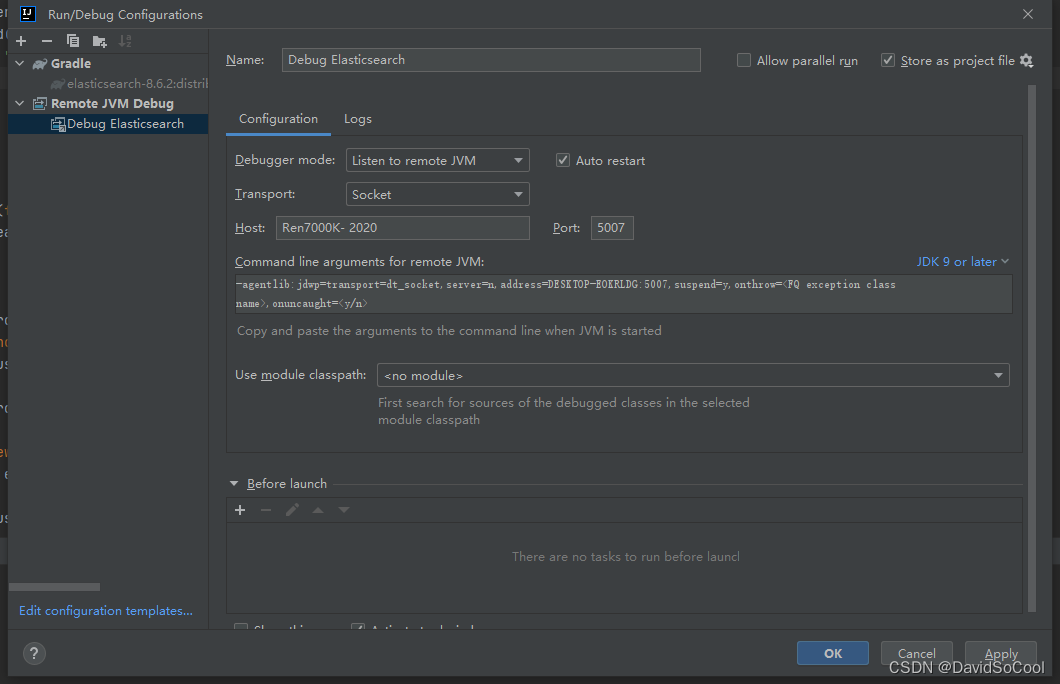
然后cmd bug模式启动源码
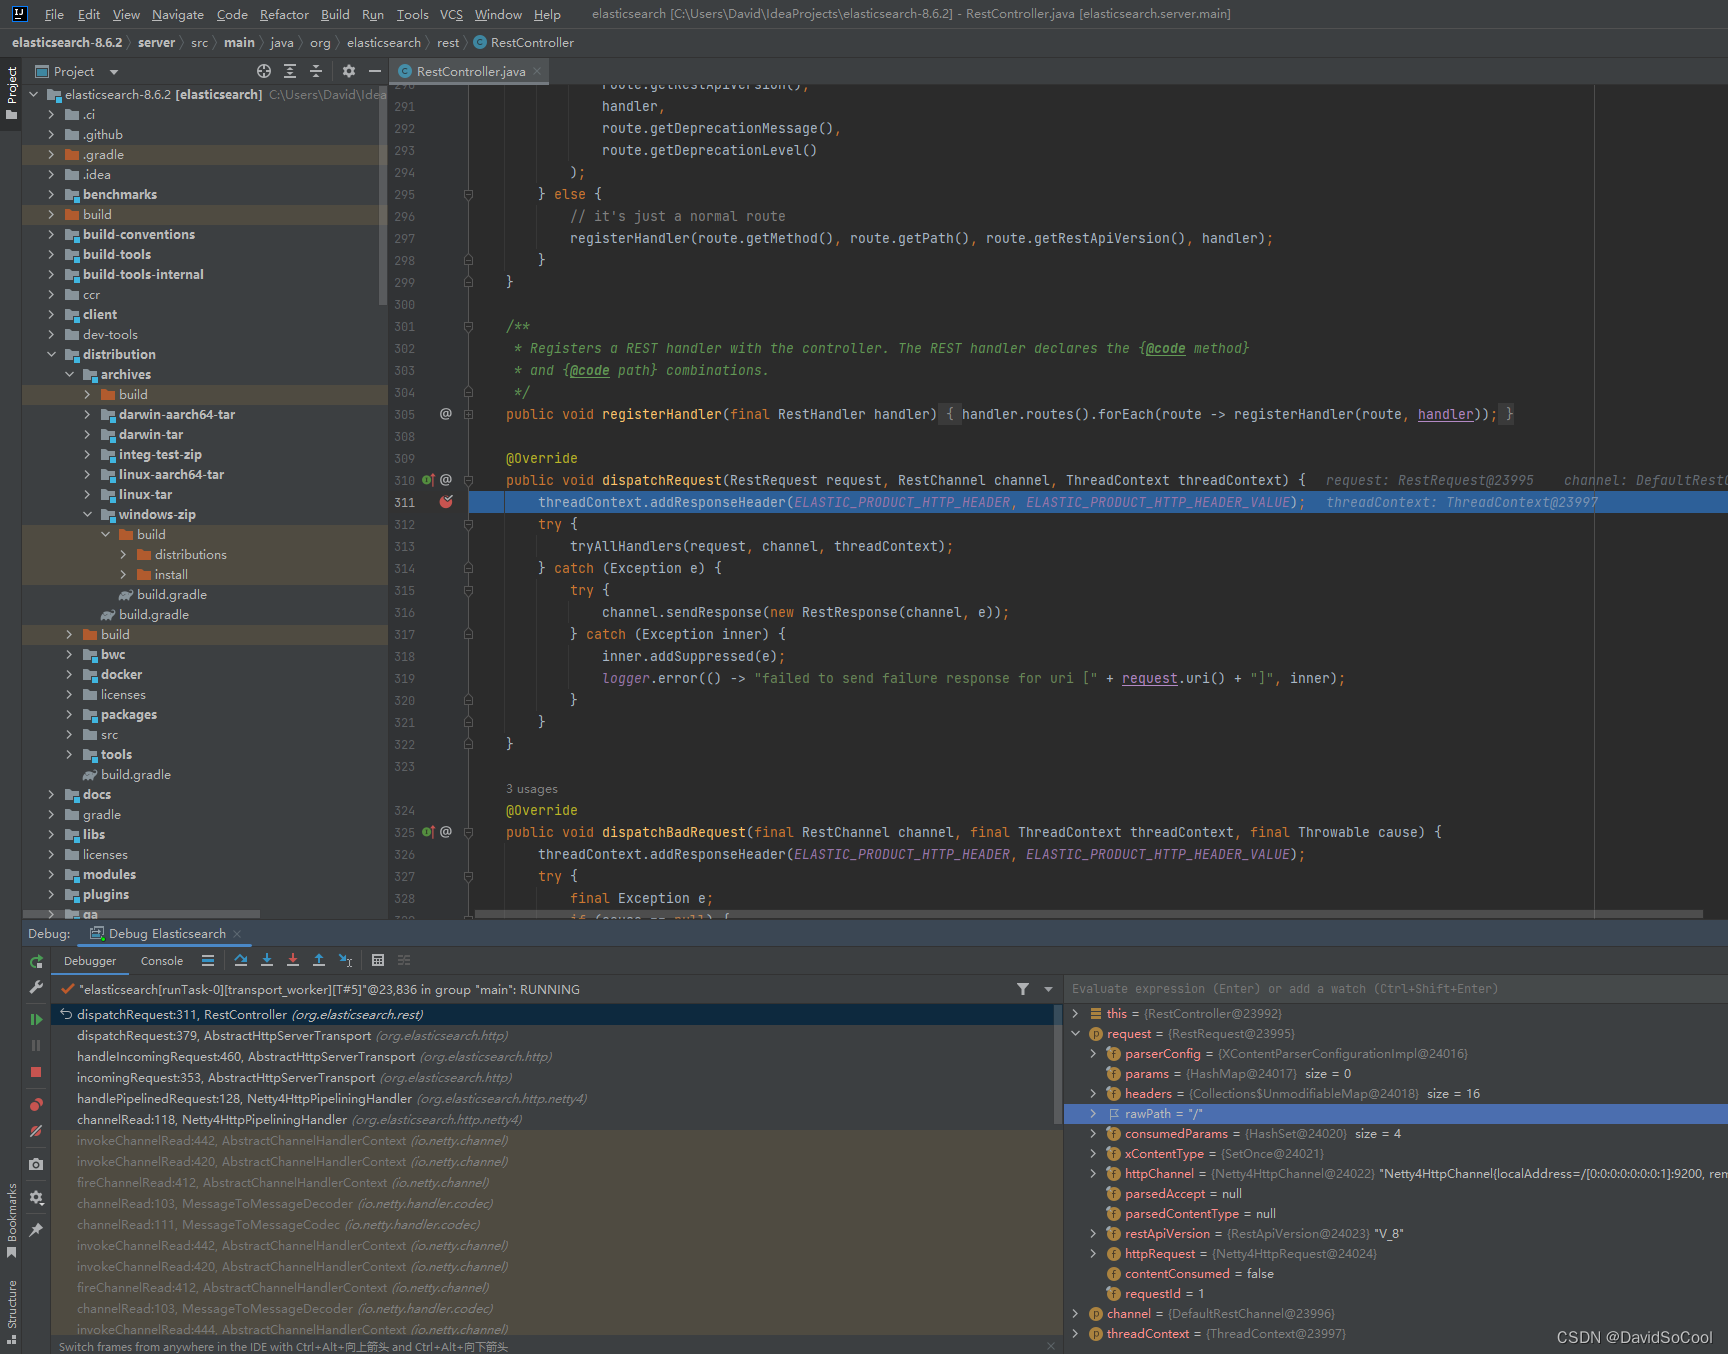
.\gradlew run -Dtests.es.xpack.security.enabled=false --debug-jvm在 idea打上断点
class:org.elasticsearch.rest.RestController#dispatchRequest(org.elasticsearch.rest.RestRequest, org.elasticsearch.rest.RestChannel, org.elasticsearch.common.util.concurrent.ThreadContext)
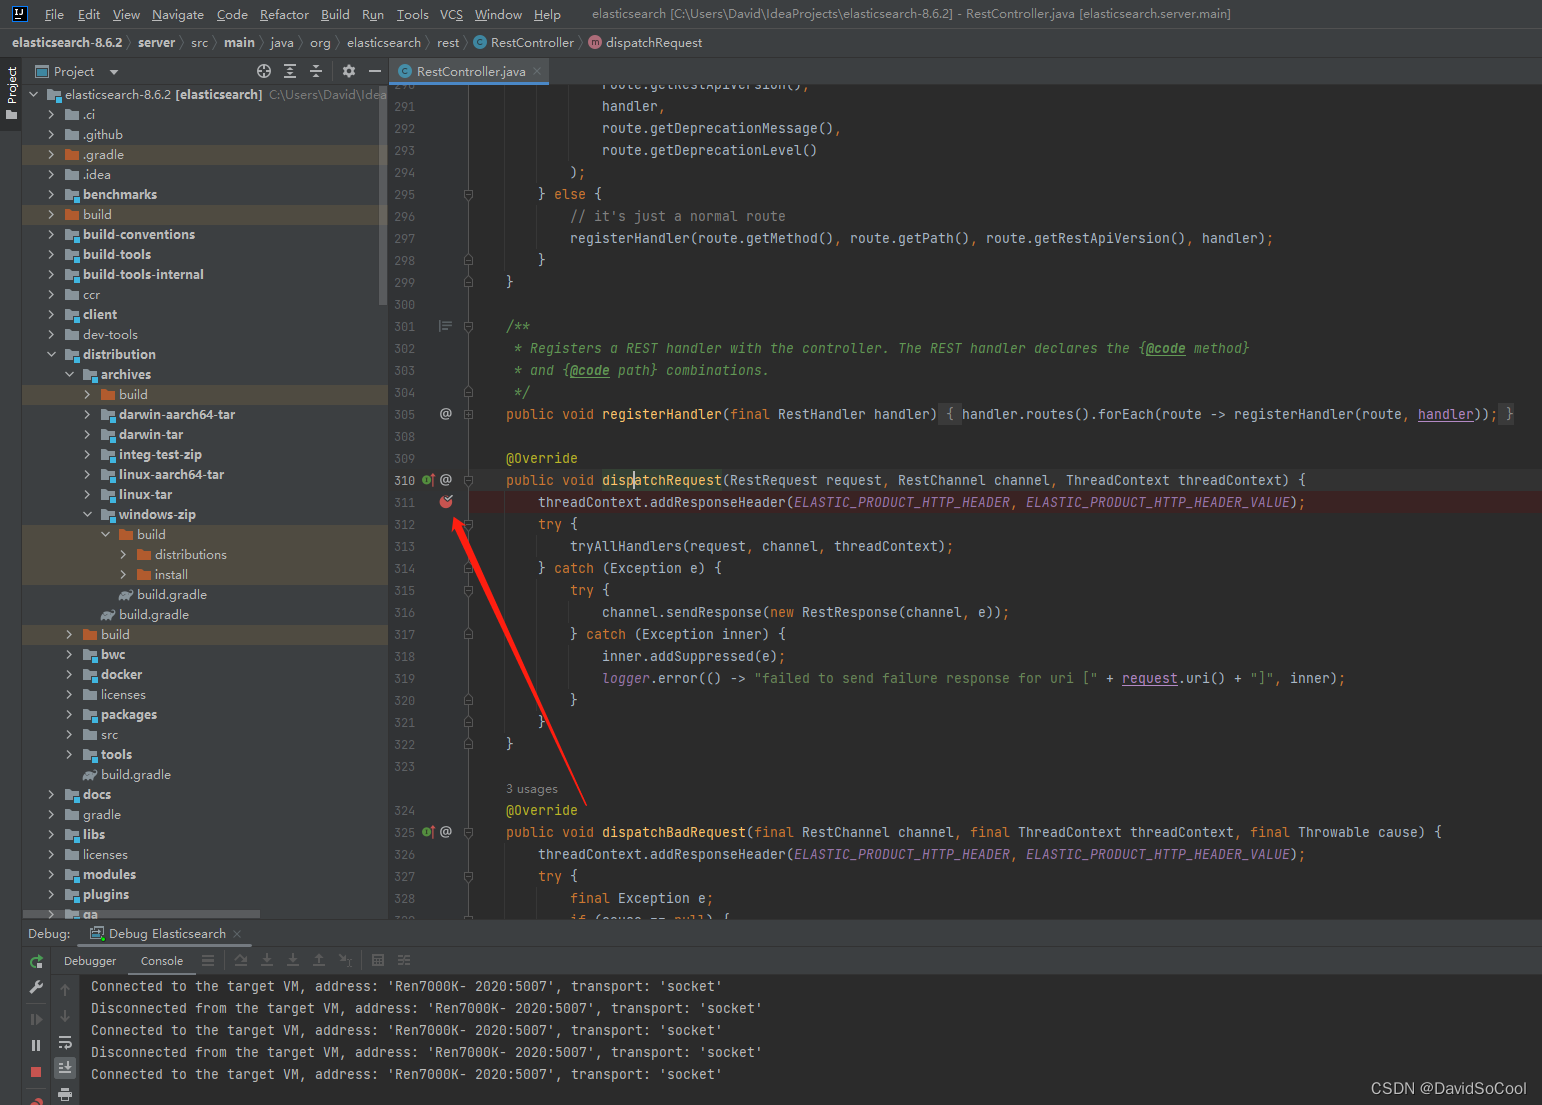
访问 http://localhost:9200/ 已经成功进idea断点中


 426
426


 被折叠的 条评论
为什么被折叠?
被折叠的 条评论
为什么被折叠?
 到【灌水乐园】发言


