


 这篇博客介绍了如何利用HTML5的Canvas标签和JavaScript快速实现数据统计图表的绘制。通过Canvas的绘图对象和方法,如stroke(), beginPath(), fill()等,实现了坐标轴的绘制和数字显示。文章中还包含了一个画圆的示例。"
132902365,19671366,MATLAB实现手指静脉图像检测,"['计算机视觉', '开发语言', 'Matlab']
这篇博客介绍了如何利用HTML5的Canvas标签和JavaScript快速实现数据统计图表的绘制。通过Canvas的绘图对象和方法,如stroke(), beginPath(), fill()等,实现了坐标轴的绘制和数字显示。文章中还包含了一个画圆的示例。"
132902365,19671366,MATLAB实现手指静脉图像检测,"['计算机视觉', '开发语言', 'Matlab']
因为最近在做数据的统计,需要表现在网页上 也查过一些插件和一些绘图语言,学习时间成本太高,所以用上了HTML5的Canvas标签和JavaScript,可以很快的满足我需要的绘图需求
JavaScript中前两句:
var canvas1=document.getElementById(“canvas1”);
var context=canvas1.getContext(“2d”);
第一句获取在HTML中的canvas
第二句得到canvas内置的绘图对象,目前只支持2d
这两句一般为通用格式
写一个函数 function pageLoad():
        var x0=0.1*canvas1.width;
        var y0=0.9*canvas1.height;
        //the begin of the axis
        var widthAx=0.8*canvas1.width;
        var heightAx=0.8*canvas1.height;
        //the width and height of the axis system
上面是获取到圆点的坐标和坐标轴的长宽度
Canvas的坐标和openGL一致,右上角为原点
context.moveTo(0.1*canvas1.width,0.1*canvas1.height);
context.lineTo(0.1*canvas1.width,0.9*canvas1.height);
context.lineTo(0.9*canvas1.width,0.9*canvas1.height);
context.moveTo(0.09*canvas1.width,0.115*canvas1.height);
context.lineTo(0.1*canvas1.width,0.1*canvas1.height);
context.lineTo(0.11*canvas1.width,0.115*canvas1.height);
context.moveTo(0.885*canvas1.width,0.89*canvas1.height);
context.lineTo(0.9*canvas1.width,0.9*canvas1.height);
context.lineTo(0.885*canvas1.width,0.91*canvas1.height);
context.strokeStyle='black';
context.lineWidth=2;
context.stroke();
context.beginPath();
上面的代码中:
stroke()方法为Canvas的画图方法,绘制之前的定制好的路径,每一次做好路径要绘制
beginPath()用于开始一条新路径,即准备画新的图,用新的画笔的时候使用
var textX=[0,1,2,3,4];
for(var i=0;i<4&&x0<canvas1.width;i++){
    context.font="20pt Calibri";
    context.fillText(textX[i],x0,y0+20);
    x0+=0.2*canvas1.width;
}//X轴的数字
上面为X坐标数字的显示
context.arc(nowX0,y0-tempData[i]/40*canvas1.height*0.8,6,0,2*Math.PI); 画圆函数context.arc为画圆
context.fill()方法为把路径填充
context.stroke()方法是把路径描绘出来,圆环和圆心的区别
完整代码:
<!DOCTYPE html>
<html>
<head>
<title>
</title>
</head>
<body onload="pageLoad();">
<div style="margin-top:30%">
<canvas id="canvas1" width="500" height="500" ></canvas>
</div>
<script type="text/javascript">
var canvas1=document.getElementById("canvas1");
var context=canvas1.getContext("2d");
function pageLoad()
{
var x0=0.1*canvas1.width;
var y0=0.9*canvas1.height;
//the begin of the axias
var widthAx=0.8*canvas1.width;
var heightAx=0.8*canvas1.height;
//the width and height of the axais system
context.moveTo(0.1*canvas1.width,0.1*canvas1.height);
context.lineTo(0.1*canvas1.width,0.9*canvas1.height);
context.lineTo(0.9*canvas1.width,0.9*canvas1.height);
context.moveTo(0.09*canvas1.width,0.115*canvas1.height);
context.lineTo(0.1*canvas1.width,0.1*canvas1.height);
context.lineTo(0.11*canvas1.width,0.115*canvas1.height);
context.moveTo(0.885*canvas1.width,0.89*canvas1.height);
context.lineTo(0.9*canvas1.width,0.9*canvas1.height);
context.lineTo(0.885*canvas1.width,0.91*canvas1.height);
context.strokeStyle='black';
context.lineWidth=2;
context.stroke();
context.beginPath();
var textX=[0,1,2,3,4];
for(var i=0;i<4&&x0<canvas1.width;i++){
context.font="20pt Calibri";
context.fillText(textX[i],x0,y0+20);
x0+=0.2*canvas1.width;
}//X轴的数字
var textY=[10,20,30,40];
x0=0.1*canvas1.width;
for(var i=0;i<4&&y0>0;i++)
{
y0-=0.2*canvas1.height;
context.font="20pt Calibri";
context.fillText(textY[i],x0-30,y0);
}
// drawData();
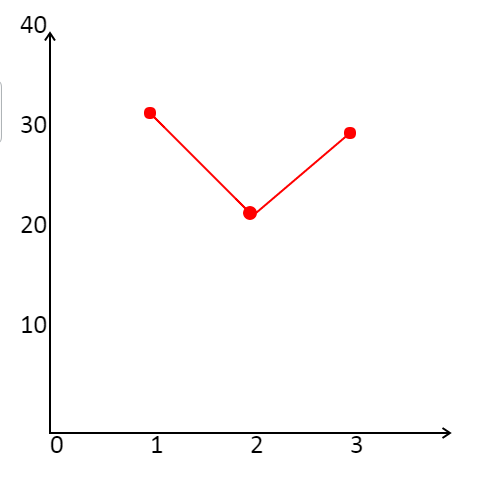
var tempData=[32,22,30];
y0=0.9*canvas1.height;
var nowX0=x0+0.2*canvas1.width;
context.arc(nowX0,y0-canvas1.height*0.8*tempData[0]/40,6,0,2*Math.PI);
context.fillStyle="red";
context.fill();
context.beginPath();
context.moveTo(nowX0,y0-canvas1.height*0.8*tempData[0]/40);
for(var i=1;i<3;i++)
{
nowX0+=0.2*canvas1.width;
context.lineTo(nowX0,y0-tempData[i]/40*canvas1.height*0.8);
context.strokeStyle='red';
context.stroke();
context.beginPath();
context.fillStyle="red";
context.arc(nowX0,y0-tempData[i]/40*canvas1.height*0.8,6,0,2*Math.PI);
//context.stroke();
context.fill();
}
}
</script>
</body>
</html>


 2921
2921

 被折叠的 条评论
为什么被折叠?
被折叠的 条评论
为什么被折叠?
 到【灌水乐园】发言


