


首先我们需要写好画坐标的方法
/**
 * Created by evan_qb on 2017/12/17.
 */
//画坐标轴的两条线
function drawCoordinate(ctx,vertexTop,vertexRight,origin,arrow,padding) {
    ctx.beginPath();
    ctx.moveTo(vertexTop.x, vertexTop.y);
    ctx.lineTo(origin.x, origin.y);
    ctx.lineTo(vertexRight.x, vertexRight.y);
    ctx.stroke();
    //画向上箭头
    ctx.beginPath();
    ctx.moveTo(vertexTop.x, vertexTop.y);
    ctx.lineTo(vertexTop.x - arrow.width / 2, vertexTop.y + arrow.height);
    ctx.lineTo(vertexTop.x, vertexTop.y + arrow.height / 2);
    ctx.lineTo(vertexTop.x + arrow.width / 2, vertexTop.y + arrow.height);
    ctx.fill();
    //画右边的箭头
    ctx.beginPath();
    ctx.moveTo(vertexRight.x, vertexRight.y);
    ctx.lineTo(vertexRight.x - arrow.height, vertexRight.y - arrow.width);
    ctx.lineTo(vertexRight.x - arrow.height / 2, vertexRight.y);
    ctx.lineTo(vertexRight.x - arrow.height, vertexRight.y + arrow.width);
    ctx.fill();
}
然后我们引入该js文件,并准备数据画出坐标后以及折线
html代码如下:
<!DOCTYPE html>
<html lang="en">
<head>
    <meta charset="UTF-8">
    <title>武大郎卖饼</title>
    <style>
        canvas{
            border: 1px dashed gray;
        }
    </style>
</head>
<body>
    <canvas id="cvs" width="500" height="500"></canvas>
</body>
<!-- 引入文件: 画坐标-->
<script src="js/draw.js"></script>
js代码如下:
<script>
var cvs = document.getElementById('cvs');
var ctx = cvs.getContext('2d');
// 坐标轴距离画布上右下左的边距
var padding = {
top:20,
right:20,
bottom:20,
left:20
}
// 坐标轴中箭头的宽和高
var arrow = {
width:12,
height:20
}
// 求坐标轴上顶点的坐标
var vertexTop = {
x:padding.left,
y:padding.top
}
// 求坐标轴原点的坐标
var origin = {
x:padding.left,
y:cvs.height - padding.bottom
}
// 求坐标轴右顶点的坐标
var vertexRight = {
x:cvs.width - padding.left,
y:cvs.height - padding.bottom
}
//设置线宽
ctx.lineWidth = 2;
//画坐标
drawCoordinate(ctx,vertexTop,vertexRight,origin,arrow,padding);
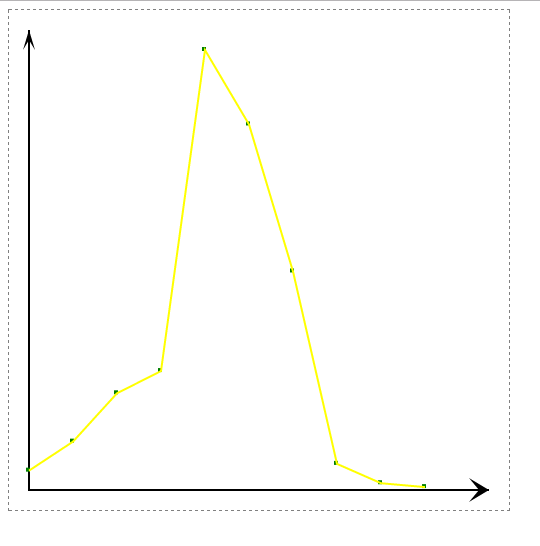
//计算武大郎每天卖饼的情况
var data = [20,50,100,123,455,378,226,27,7,3];
// 求坐标轴默认可显示数据的最大值
var coordMaxX = cvs.width - padding.left - padding.right -arrow.height;
var coordMaxY = cvs.height - padding.bottom - padding.top - arrow.height;
//求数据缩放的比例
var ratioX = coordMaxX / data.length;
//Math.max.apply选取数组中的最大值
var ratioY = coordMaxY / Math.max.apply(null,data);
//根据比例,对元数据进行缩放
/*
* 数组.map(function( val, index, arr ) { return 1; } )
* 返回值:把回调reurn的值共同组成一个数组
* 对数组的元素进行等比例缩放
*/
var ratioData = data.map(function(val){
return val*ratioY;
});
//画点
ctx.fillStyle = "green";
//val为值,index为下标
//等比例缩放后的数据
ratioData.forEach(function(val,index){
ctx.fillRect(origin.x + (index*ratioX) - 3,origin.y - val - 3,4,4);
});
//根据点连线
ctx.beginPath();
ctx.lineWidth = 2;
ctx.strokeStyle = "yellow";
//等比例缩放后的数据
ratioData.forEach(function (val,index) {
ctx.lineTo(origin.x + (index * ratioX),origin.y - val);
});
//描边
ctx.stroke();
</script>结果如下:
优化版:
我们可以使用对象来对以上的代码进行优化
我们可以将画图的方法抽出出一个Line对象
/**
 * Created by evan_qb on 2017/12/17.
 */
/*
 * constructor { line } 折线图构造函数
 * param { ctx: Context } 绘图环境
 * param { data: Array } 绘制折线图所需的数据
 * param { padding: Object } 设置坐标轴到画布的边距
 * param { arrow: Object } 设置箭头的宽高
 */
function Line(ctx,data,padding,arrow){
    this.ctx = ctx;
    this.data = data;
    this.padding = padding || { top: 10, right: 10, bottom: 10, left: 10 };
    this.arrow = arrow || { width: 10, height: 20 };
    //上顶点的坐标
    this.vertexTop = {
        x:this.padding.left,
        y:this.padding.top
    }
    //原点的坐标
    this.origin = {
        x:this.padding.left,
        y:this.ctx.canvas.height - this.padding.bottom
    }
    //右顶点的坐标
    this.vertexRight = {
        x:this.ctx.canvas.width - this.padding.right,
        y:this.ctx.canvas.height - this.padding.bottom
    }
    //计算坐标轴的最大刻度
    this.coordWidth = this.ctx.canvas.width - this.padding.left - this.padding.right - this.arrow.height;
    this.coordHeight = this.ctx.canvas.height - this.padding.top - this.padding.bottom - this.arrow.height;
}
//给原型扩充方法
Line.prototype = {
    constructor:Line,

    draw:function(){
        this.drawCoord();
        this.drawArrow();
        this.drawLine();
    },
    //绘制坐标轴
    drawCoord:function(){
        this.ctx.beginPath();
        this.ctx.moveTo(this.vertexTop.x,this.vertexTop.y);
        this.ctx.lineTo(this.origin.x,this.origin.y);
        this.ctx.lineTo(this.vertexRight.x,this.vertexRight.y);
        this.ctx.stroke();
    },
    //绘制箭头
    drawArrow:function(){
        //绘制向上的箭头
        this.ctx.beginPath();
        this.ctx.moveTo(this.vertexTop.x,this.vertexTop.y);
        this.ctx.lineTo(this.vertexTop.x - this.arrow.width / 2,this.vertexTop.y + this.arrow.height);
        this.ctx.lineTo(this.vertexTop.x , this.vertexTop.y + this.arrow.height / 2);
        this.ctx.lineTo(this.vertexTop.x + this.arrow.width / 2,this.vertexTop.y + this.arrow.height);
        this.ctx.fill();
        //绘制向右的箭头
        this.ctx.beginPath();
        this.ctx.moveTo(this.vertexRight.x,this.vertexRight.y);
        this.ctx.lineTo(this.vertexRight.x - this.arrow.height,this.vertexRight.y - this.arrow.width / 2);
        this.ctx.lineTo(this.vertexRight.x - this.arrow.height / 2,this.vertexRight.y);
        this.ctx.lineTo(this.vertexRight.x - this.arrow.height,this.vertexRight.y + this.arrow.width / 2);
        this.ctx.fill();
    },
    //根据数据绘制折线图
    drawLine:function(){
        //先清除路径
        this.ctx.beginPath();
        var self = this;
        //计算x轴和y轴的缩放比值
        var ratioX = this.coordWidth / this.data.length;
        var ratioY = this.coordHeight / Math.max.apply(null,self.data);
        //设置点的颜色
        this.ctx.fillStyle = "green";
        //根据原点计算点的坐标
        //x = self.origin.x + x
        //y = self.origin.y - y
        //遍历数据,并依次描点 数组:val:值 index:下标
        this.data.forEach(function(val,index){
            self.ctx.fillRect(self.origin.x + index*ratioX - 2,self.origin.y - val*ratioY - 2,4,4);
        });
        //设置线的颜色
        this.ctx.strokeStyle = "yellow";
        //遍历数据,连线
        this.data.forEach(function(val,index){
            self.ctx.lineTo(self.origin.x + index*ratioX,self.origin.y - val*ratioY);
        });
        this.ctx.stroke();
    }
}
然后将创建这个对象,调用对应的方法,将数据传入
<!DOCTYPE html>
<html lang="en">
<head>
<meta charset="UTF-8">
<title>对象版折线图</title>
<style>
canvas{
border: 1px solid red;
}
</style>
</head>
<body>
<canvas id="cvs" width="500" height="500"></canvas>
</body>
<!--引入划线的文件-->
<script src="line.js"></script>
<script>
var cvs = document.getElementById("cvs");
var ctx = cvs.getContext("2d");
//创建对象
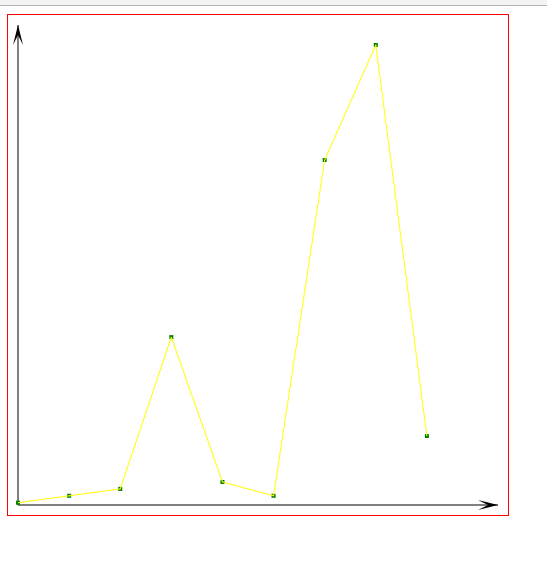
var line = new Line(ctx,[ 10, 40, 70, 730, 100, 40, 1500, 2000, 300 ]);
//调用绘图方法
line.draw();
</script>
</html>运行结果:


 521
521

 被折叠的 条评论
为什么被折叠?
被折叠的 条评论
为什么被折叠?
 到【灌水乐园】发言


