


项目背景:新项目采用vue3 + ant-design-vue + vite + pnpm来搭建,大屏页面打算使用echarts,接下来将具体演示如何使用:
第一步:首先需要下载echarts依赖
yarn add echarts

#or

npm install echarts --save
注意:本项目中大屏页面属于较小模块的内容,所以在此选择按需引入
第二步:开始写echarts的小组件(直接贴代码)
  <template>
    <div ref="analysisRef" style="width: 180%; height: 420%"></div>
  </template>

  <script lang="ts" setup>
    import { ref, onMounted } from "vue";
    //  按需引入 echarts
    import * as echarts from "echarts";

    const props = defineProps({		//通过defineProps "编译器宏"接收子组件传递的数据
      analysisOption: Object
    })
    const analysisRef = ref() // 使用ref创建虚拟DOM引用,使用时用analysisRef.value
    onMounted(
      () => {
        analysisInit()
      }
    )
    function analysisInit() {
      console.log('888', props.analysisOption)
      // 基于准备好的dom,初始化echarts实例
      var myChart = echarts.init(analysisRef.value);
      // 使用刚指定的配置项和数据显示图表。
      myChart.setOption(props.analysisOption);
    }
    </script>

  <style scoped>
  </style>
第三步:在父组件中引入子组件(此处的父组件是放图表的页面)
<template>
<div class="dataScreen-container">
<div ref="dataScreenRef" class="dataScreen-content">
<div class="dataScreen-header">
<div class="header-lf"></div>
<div class="header-ct">
<div class="header-ct-title">
<span>安全生产综合监控中心</span>
</div>
</div>
<div class="header-ri">
<span class="header-time">当前时间:{{ time }}</span>
</div>
</div>
<div class="dataScreen-main">
<div class="dataScreen-lf">
<div class="dataScreen-top">
<div class="dataScreen-main-title">
<div></div>
<span>当前问题治理统计分析</span>
</div>
<div class="dataScreen-main-chart">
<CurrentProblem :problem-option="problemOption"></CurrentProblem>
</div>
</div>
<div class="dataScreen-center">
<div class="dataScreen-main-title">
<div></div>
<span>区域问题</span>
</div>
<div class="dataScreen-main-chart">
<AreaProblem :area-option="areaOption"></AreaProblem>
</div>
</div>
<div class="dataScreen-bottom">
<div class="dataScreen-main-title">
<div></div>
<span>问题来源</span>
</div>
<div class="dataScreen-main-chart">
<Source :source-option="sourceOption"></Source>
</div>
</div>
</div>
<div class="dataScreen-lf dataScreen-ct" style="width: 36%">
<div style="height: 16%">
<Center />
</div>
<div class="dataScreen-center" style="height: 40%">
<div class="dataScreen-main-chart">
<RealTime></RealTime>
</div>
</div>
<div class="dataScreen-bottom" style="height: 38%">
<div class="dataScreen-main-title">
<div></div>
<span>问题治理投入</span>
</div>
<div class="dataScreen-main-chart">
<PutInto :put-option="putOption"></PutInto>
</div>
</div>
</div>
<div class="dataScreen-lf">
<div class="dataScreen-top" style="height: 48%">
<div class="dataScreen-main-title">
<div></div>
<span>问题统计分析</span>
</div>
<div class="dataScreen-main-chart">
<Analysis :analysis-option="analysisOption"></Analysis>
</div>
</div>
<div class="dataScreen-bottom" style="height: 48%">
<div class="dataScreen-main-title">
<div></div>
<span>问题排行</span>
</div>
<div class="dataScreen-main-chart">
<Ranking :ranking-option="rankingOption"></Ranking>
</div>
</div>
</div>
</div>
</div>
</div>
</template>
<script setup lang="ts" name="dataScreen">
import { ref, onMounted, onBeforeUnmount, reactive } from 'vue'
import { useRouter } from 'vue-router'
import dayjs from 'dayjs'
import CurrentProblem from './components/currentProblem.vue'
import AreaProblem from './components/areaProblem.vue'
import PutInto from './components/putInto.vue'
import Analysis from './components/analysis.vue'
import Ranking from './components/ranking.vue'
import Source from './components/source.vue'
import RealTime from './components/realTime.vue'
import Center from './components/center.vue'
const router = useRouter()
const dataScreenRef = ref<HTMLElement | null>(null)
const problemOption = reactive({
color: ['#f90303', '#fd9400', '#ffc605', '#3370ff'],
tooltip: {
trigger: 'axis',
axisPointer: {
// Use axis to trigger tooltip
type: 'shadow', // 'shadow' as default; can also be 'line' or 'shadow'
},
},
legend: {},
grid: {
left: '3%',
right: '4%',
bottom: '3%',
containLabel: true,
},
xAxis: {
type: 'value',
axisLabel: {
//x轴文字的配置
show: true,
textStyle: {
color: 'rgba(219,225,255,1)',
},
},
},
yAxis: {
type: 'category',
data: ['今日完成', '待检查', '待整改', '待确认'],
axisLabel: {
//y轴文字的配置
textStyle: {
color: '#ffffff',
margin: 15,
},
// formatter: '{value} %'//y轴的每一个刻度值后面加上‘%’号
},
},
series: [
{
type: 'bar',
stack: 'total',
label: {
show: true,
},
emphasis: {
focus: 'series',
},
data: [120, 102, 101, 134],
},
{
type: 'bar',
stack: 'total',
label: {
show: true,
},
emphasis: {
focus: 'series',
},
data: [220, 232, 201, 234],
},
{
type: 'bar',
stack: 'total',
label: {
show: true,
},
emphasis: {
focus: 'series',
},
data: [120, 102, 111, 134],
},
{
type: 'bar',
stack: 'total',
label: {
show: true,
},
emphasis: {
focus: 'series',
},
data: [250, 262, 291, 254],
barWidth: '30px',
itemStyle: {
barBorderRadius: [0, 30, 30, 0],
},
},
],
})
const areaOption = reactive({
xAxis: {
type: 'category',
data: ['生产区', '仓库区', '车间1', '车间2', '车间3', '车间4', '车间5'],
axisLabel: {
//y轴文字的配置
textStyle: {
color: '#909399',
margin: 15,
},
// formatter: '{value} %'//y轴的每一个刻度值后面加上‘%’号
},
},
yAxis: {
type: 'value',
axisLabel: {
//y轴文字的配置
textStyle: {
color: '#909399',
margin: 15,
},
// formatter: '{value} %'//y轴的每一个刻度值后面加上‘%’号
},
},
series: [
{
data: [32, 30, 27, 32, 26, 21, 28],
type: 'bar',
barWidth: '20px',
itemStyle: {
normal: {
color: {
type: 'linear',
x: 0,
y: 0,
x2: 0,
y2: 1,
colorStops: [
{
offset: 0,
color: '#53c3e8',
},
{
offset: 1,
color: '#3565c0',
},
],
globalCoord: false, // 缺省为 false
},
barBorderRadius: [30, 30, 0, 0],
shadowColor: 'rgba(0,160,221,1)',
shadowBlur: 4,
},
},
},
],
})
const putOption = reactive({
grid: {
top: 30,
bottom: 20,
},
xAxis: [
{
data: ['1月', '2月', '3月', '4月', '5月', '6月', '7月', '8月', '9月', '10月', '11月', '12月'],
axisLabel: {
color: '#fff',
fontSize: 10,
},
axisTick: {
show: false,
},
axisLine: {
show: false,
},
},
],
yAxis: [
{
nameTextStyle: {
color: '#8CB5E2',
},
splitLine: {
show: true,
lineStyle: {
type: 'dashed',
color: '#182450',
},
},
axisLabel: {
color: '#8CB5E2',
},
},
],
// 使用内部缩放(滚轮缩放、鼠标拖着左右滑动)
dataZoom: [
{
type: 'inside',
minValueSpan: 8, // 最小展示数
start: 0, // 开始展示位置(默认)
end: 5, // 结束展示位置 (默认)
},
],
series: [
{
name: 'hill',
// 象柱形图
type: 'pictorialBar',
// 同一系列的柱间距离
barCategoryGap: '-60%',
// 自定义svg 图标 (三角锥形的关键)
symbol: 'path://M0,10 L10,10 C5.5,10 5.5,5 5,0 C4.5,5 4.5,10 0,10 z',
// 默认样式
itemStyle: {
label: {
show: false,
},
borderColor: '#206fde',
borderWidth: 2,
color: {
colorStops: [
{
offset: 0,
color: 'rgba(4, 202, 190)',
},
{
offset: 1,
color: 'rgba(4, 202, 190, 0.1)',
},
],
},
},
// 鼠标滑过样式
emphasis: {
label: {
show: true,
position: 'top',
color: '#12DCFF',
},
itemStyle: {
borderColor: '#17cdfa',
borderWidth: 2,
color: {
colorStops: [
{
offset: 0,
color: 'rgba(0,238,255, 0.09)',
},
{
offset: 1,
color: 'rgba(23,205,250, 0.5)',
},
],
},
},
},
data: [600, 460, 350, 470, 450, 620, 470, 450, 470, 450, 390],
z: 10,
},
],
})
const analysisOption = reactive({
color: ['#f90303', '#fd9400', '#ffc605', '#3370ff'],
legend: {
textStyle: {
color: '#fff',
},
},
tooltip: {},
dataset: {
source: [
['product', '重大风险', '较大风险', '一般风险', '低风险'],
['09-11', 1, 3, 4, 7],
['09-12', 3, 4, 6, 5],
['09-13', 1, 4, 2, 3],
['09-14', 1, 4, 7, 5],
['09-15', 1, 2, 6, 11],
['09-16', 1, 4, 9, 5],
['09-17', 1, 3, 4, 7],
],
},
xAxis: { type: 'category' },
yAxis: {},
// Declare several bar series, each will be mapped
// to a column of dataset.source by default.
series: [
{
type: 'bar',
},
{ type: 'bar' },
{ type: 'bar' },
{ type: 'bar' },
],
})
const rankingOption = reactive({
tooltip: {
trigger: 'axis',
axisPointer: {
type: 'shadow',
},
},
legend: {},
grid: {
left: '3%',
right: '4%',
bottom: '3%',
containLabel: true,
},
xAxis: {
type: 'value',
boundaryGap: [0, 0.01],
},
yAxis: {
type: 'category',
data: ['区域位置', '设施设备', '作业活动', '管理'],
axisLabel: {
//y轴文字的配置
textStyle: {
color: '#ffffff',
margin: 15,
},
// formatter: '{value} %'//y轴的每一个刻度值后面加上‘%’号
},
},
series: [
{
type: 'bar',
data: [53, 66, 87, 105],
barWidth: '20px',
itemStyle: {
normal: {
color: {
type: 'linear',
x: 0,
y: 0,
x2: 1,
y2: 1,
colorStops: [
{
offset: 0,
color: '#87f9c8',
},
{
offset: 1,
color: '#66baf7',
},
],
globalCoord: false, // 缺省为 false
},
barBorderRadius: [0, 30, 30, 0],
},
},
},
],
})
const sourceOption = reactive({
dataset: [
{
source: [
['Product', 'Sales', 'Price', 'Year'],
['班组巡检', 123, 32, 2011],
['随手拍', 231, 14, 2011],
['安全巡检', 235, 5, 2011],
['公司检查', 341, 25, 2011],
['领导巡检', 122, 29, 2011],
['班组巡检', 143, 30, 2012],
['随手拍', 201, 19, 2012],
['安全巡检', 255, 7, 2012],
['公司检查', 241, 27, 2012],
['领导巡检', 102, 34, 2012],
['班组巡检', 153, 28, 2013],
['随手拍', 181, 21, 2013],
['安全巡检', 395, 4, 2013],
['公司检查', 281, 31, 2013],
['领导巡检', 92, 39, 2013],
['班组巡检', 223, 29, 2014],
['随手拍', 211, 17, 2014],
['安全巡检', 345, 3, 2014],
['领导巡检', 211, 35, 2014],
['安全巡检', 72, 24, 2014],
],
},
{
transform: {
type: 'filter',
config: { dimension: 'Year', value: 2011 },
},
},
{
transform: {
type: 'filter',
config: { dimension: 'Year', value: 2012 },
},
},
{
transform: {
type: 'filter',
config: { dimension: 'Year', value: 2013 },
},
},
],
series: [
{
type: 'pie',
radius: 50,
center: ['50%', '25%'],
datasetIndex: 1,
},
{
type: 'pie',
radius: 50,
center: ['50%', '50%'],
datasetIndex: 2,
},
{
type: 'pie',
radius: 50,
center: ['50%', '75%'],
datasetIndex: 3,
},
],
// Optional. Only for responsive layout:
media: [
{
query: { minAspectRatio: 1 },
option: {
series: [
{ center: ['25%', '50%'] },
{ center: ['50%', '50%'] },
{ center: ['75%', '50%'] },
],
},
},
{
option: {
series: [
{ center: ['50%', '25%'] },
{ center: ['50%', '50%'] },
{ center: ['50%', '75%'] },
],
},
},
],
})
onMounted(() => {
if (dataScreenRef.value) {
dataScreenRef.value.style.transform = `scale(${getScale()}) translate(-50%, -50%)`
dataScreenRef.value.style.width = `1920px`
dataScreenRef.value.style.height = `1080px`
}
window.addEventListener('resize', resize)
})
// 设置响应式
const resize = () => {
if (dataScreenRef.value) {
dataScreenRef.value.style.transform = `scale(${getScale()}) translate(-50%, -50%)`
}
}
// 根据浏览器大小推断缩放比例
const getScale = (width = 1920, height = 1080) => {
const ww = window.innerWidth / width
const wh = window.innerHeight / height
return ww < wh ? ww : wh
}
// 获取当前时间
let timer: NodeJS.Timer | null = null
const time = ref<string>(dayjs().format('YYYY年MM月DD HH:mm:ss'))
timer = setInterval(() => {
time.value = dayjs().format('YYYY年MM月DD HH:mm:ss')
}, 1000)
onBeforeUnmount(() => {
window.removeEventListener('resize', resize)
clearInterval(timer!)
})
</script>
<style lang="less" scoped>
.dataScreen-container {
width: 100%;
height: 100%;
background: url('./images/bg.png') no-repeat;
background-repeat: no-repeat;
background-attachment: fixed;
background-position: center;
background-size: 100% 100%;
background-size: cover;
.dataScreen-content {
position: fixed;
top: 50%;
left: 50%;
z-index: 999;
display: flex;
flex-direction: column;
overflow: hidden;
transition: all 0.3s;
transform-origin: left top;
.dataScreen-header {
display: flex;
width: 100%;
height: 38px;
margin-bottom: 40px;
.header-lf,
.header-ri {
position: relative;
width: 567px;
height: 100%;
background: url('./images/dataScreen-header-left-bg.png') no-repeat;
background-size: 100% 100%;
}
.header-ct {
position: relative;
flex: 1;
height: 100%;
.header-ct-title {
position: absolute;
top: 0;
left: 0;
width: 100%;
height: 82px;
font-family: YouSheBiaoTiHei;
font-size: 32px;
line-height: 78px;
color: #05e8fe;
text-align: center;
letter-spacing: 4px;
background: url('./images/dataScreen-header-center-bg.png') no-repeat;
background-size: 100% 100%;
.header-ct-warning {
position: absolute;
bottom: -42px;
left: 50%;
width: 622px;
height: 44px;
font-family: YouSheBiaoTiHei;
font-size: 14px;
line-height: 44px;
color: #ffffff;
text-align: center;
letter-spacing: 1px;
background: url('./images/dataScreen-header-warn-bg.png') no-repeat;
background-size: 100% 100%;
transform: translateX(-50%);
}
}
}
.header-screening,
.header-download {
position: absolute;
z-index: 9;
box-sizing: border-box;
width: 136px;
height: 42px;
font-family: YouSheBiaoTiHei;
font-size: 18px;
font-weight: 400;
line-height: 42px;
color: #29fcff;
text-align: center;
cursor: pointer;
background-size: 100% 100%;
}
.header-screening {
right: 0;
padding-right: 4px;
background: url('./images/dataScreen-header-btn-bg-l.png') no-repeat;
}
.header-download {
left: 0;
padding-right: 0;
background: url('./images/dataScreen-header-btn-bg-r.png') no-repeat;
}
.header-time {
position: absolute;
top: 0;
right: 14px;
width: 310px;
font-family: YouSheBiaoTiHei;
font-size: 17px;
font-weight: 400;
line-height: 38px;
color: #05e8fe;
white-space: nowrap;
}
}
.dataScreen-main {
box-sizing: border-box;
display: flex;
flex: 1;
width: 100%;
padding-top: 42px;
.dataScreen-lf {
display: flex;
flex-direction: column;
justify-content: space-between;
width: 30%;
height: 100%;
margin-right: 40px;
.dataScreen-top,
.dataScreen-center,
.dataScreen-bottom {
position: relative;
box-sizing: border-box;
width: 100%;
padding-top: 54px;
}
.dataScreen-top {
height: 37%;
background: #11144e;
border-radius: 8px;
padding: 16px;
}
.dataScreen-center {
height: 30%;
background: #11144e;
padding: 16px;
border-radius: 8px;
}
.dataScreen-bottom {
height: 27%;
padding: 16px;
margin-bottom: 16px;
border-radius: 8px;
background: #11144e;
}
}
.dataScreen-main-title {
// position: absolute;
// top: 1px;
// left: 0;
display: flex;
span {
margin-bottom: 12px;
font-family: YouSheBiaoTiHei;
font-size: 18px;
line-height: 16px;
color: #ffffff;
letter-spacing: 1px;
}
div {
width: 6px;
background: #3370fe;
border-radius: 8px;
height: 20px;
margin-right: 8px;
}
}
.dataScreen-main-chart {
// width: 100%;
// height: 100%;
}
}
}
}
</style>
上述第三步贴图的代码运行结果如下图所示
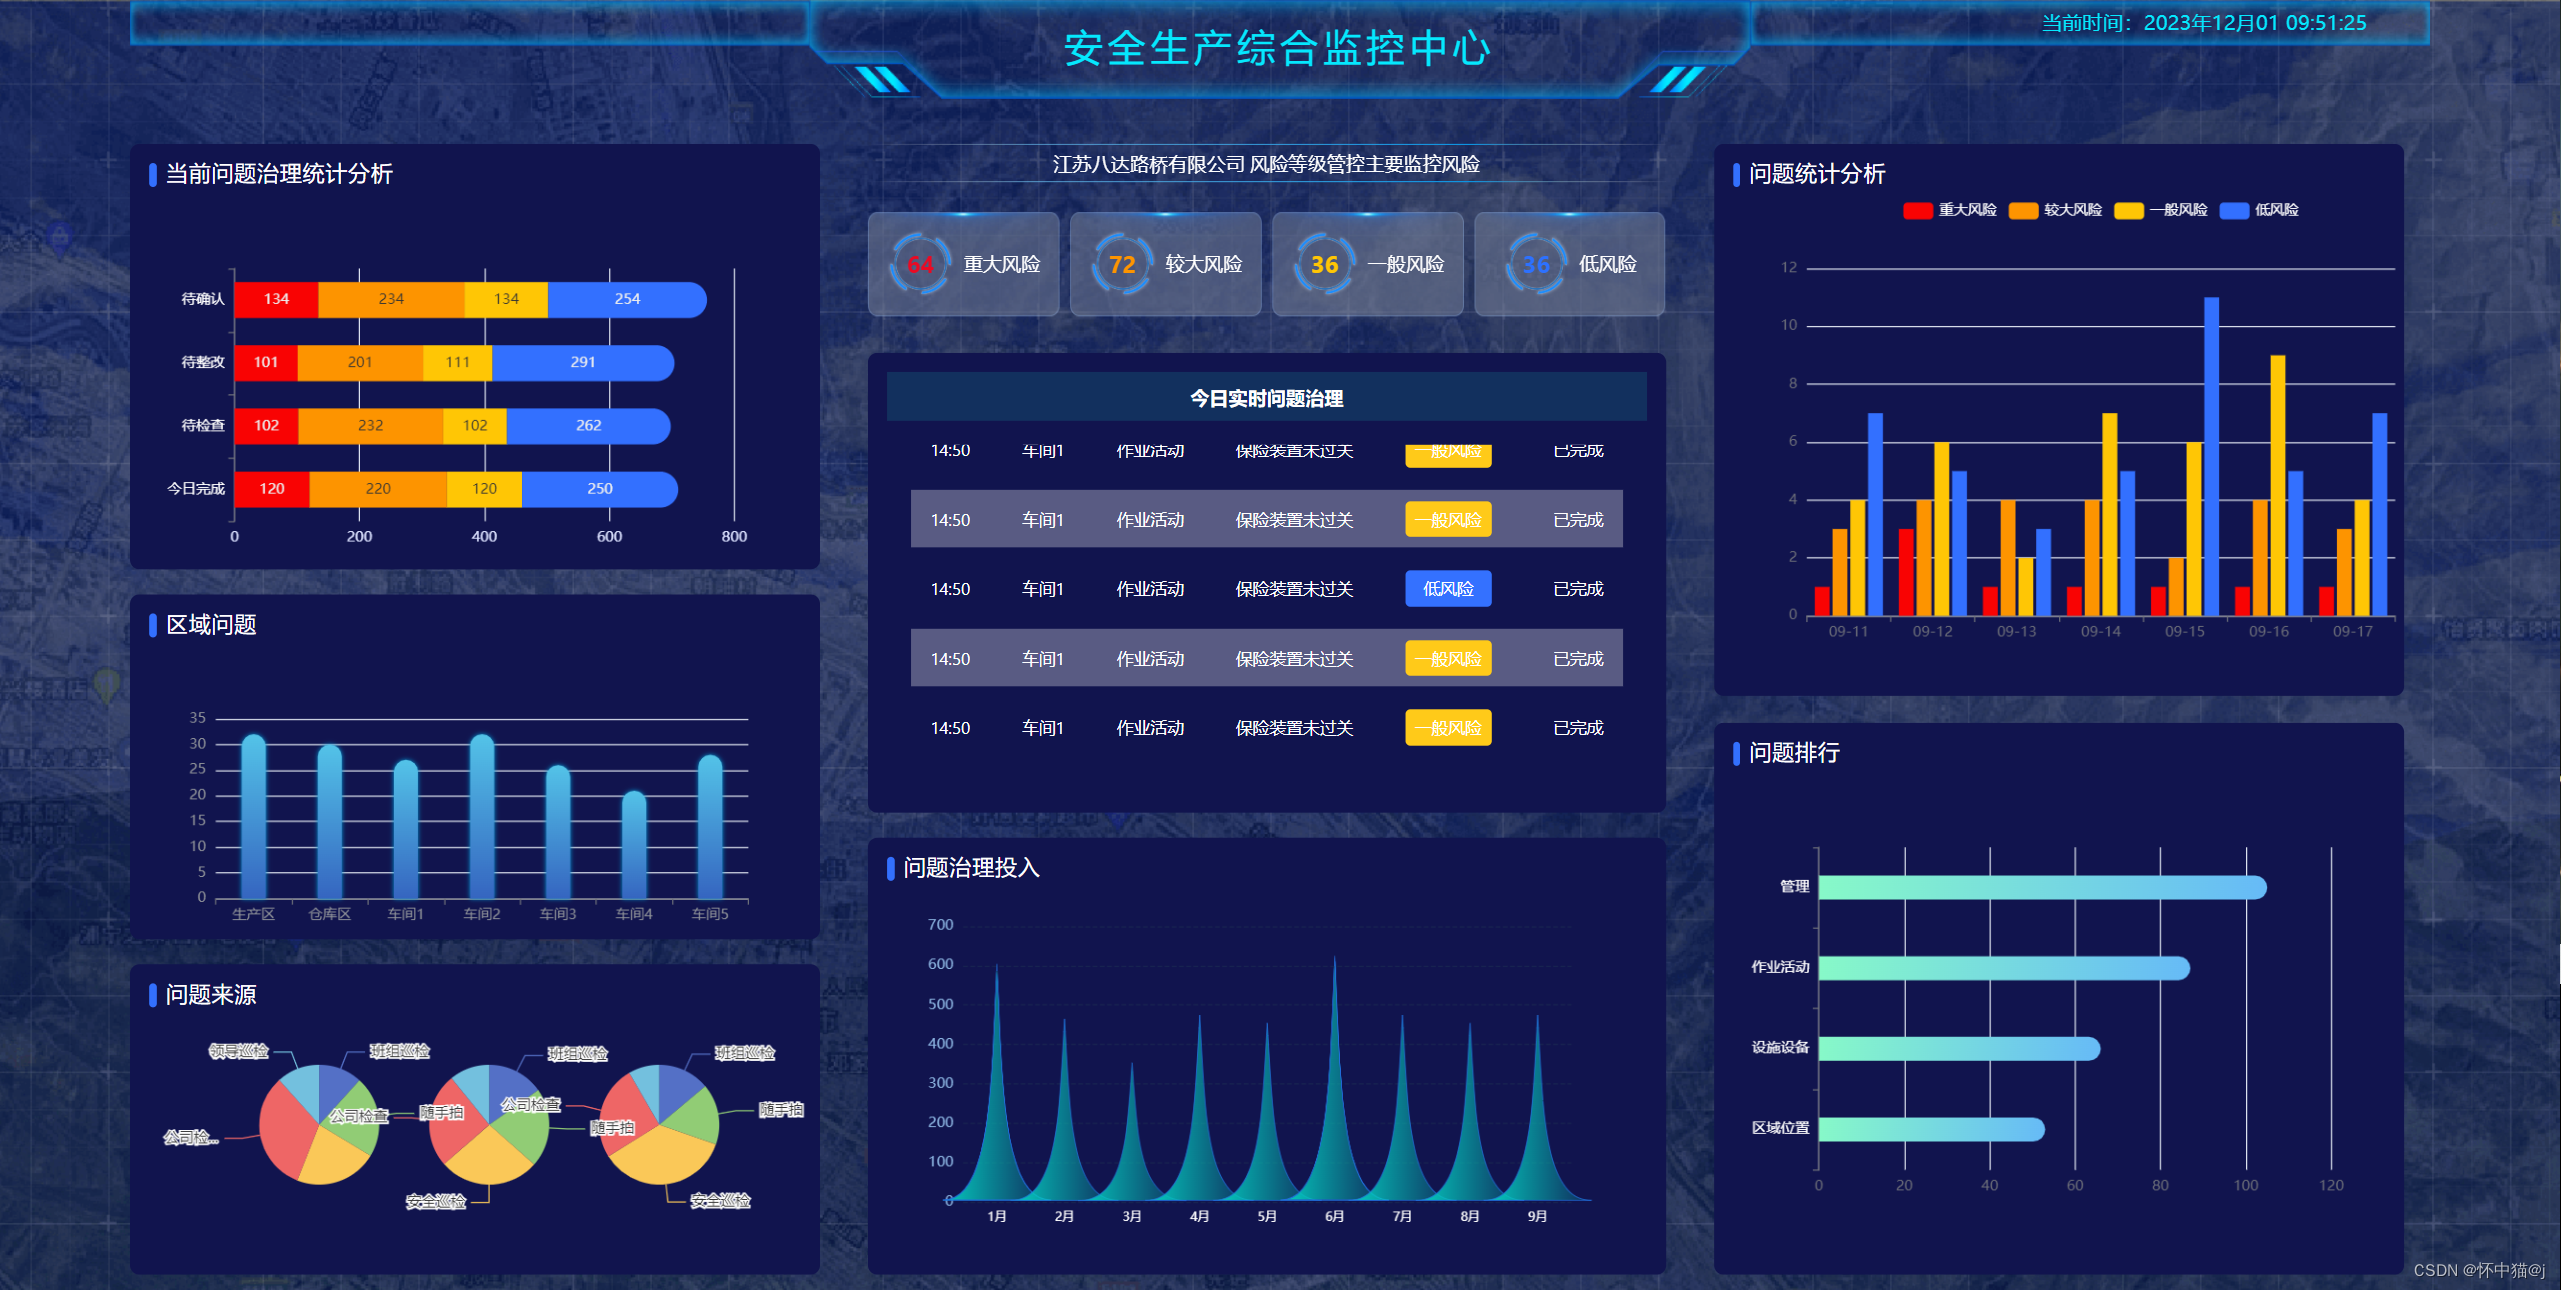
第二步贴图代码只是众多图表中的其中一个,其余图表类似,只需要改改前缀名就行,至此全部结束
关于大屏中vue列表无缝滚动的实现会在下一篇博文中提及


 646
646


 被折叠的 条评论
为什么被折叠?
被折叠的 条评论
为什么被折叠?
 到【灌水乐园】发言


