


var option = {
radar: [{
indicator: [{
text: 'a频率 \n (高于60%的用户)',
max: 1000
},
{
name: 'b成功率 \n (高于65%的用户)',
max:1000
},
{
name: 'c率 \n (低于40%的用户)',
max:1000
},
{
name: 'd能力 \n (低于10%的用户)',
max:1000
},
{
name: 'e能力 \n (低于30%的用户)',
max:1000
}
],
center: ['46%', '50%'], // 位置
radius: 70, //大小
startAngle: 90, // 雷达图的旋转偏移量
splitNumber: 5, // 分层5层,当前最大1000,可理解为每层200
shape: 'line',
name: {
formatter: '{value}',
textStyle: {
color: '#595959', // 文字颜色
fontSize: 13
}
},
splitArea: {
areaStyle: {
color: ['#FFFFFF','#EEEEEE', '#FFFFFF','#EEEEEE', '#FFFFFF']
//圆环颜色
}
},
axisLine: {
lineStyle: {
color: 'rgba(128, 128, 128, 0.1)' // 五角内部的连接线颜色
}
},
splitLine: {
lineStyle: {
color: '#595959' // 每个区域的边框颜色
}
}
}],
series: [{
name: '雷达图',
type: 'radar',
itemStyle: {
emphasis: {
// color: 各异,
lineStyle: {
width: 4
}
}
},
data: [{
value: [200, 400, 600, 800, 1000], // 排序从顶部→左→左下角→右下角→右侧
lineStyle: { // 五点连接线的样式。
normal: {
opacity: 1, // 图形透明度,
color: '#1F6AFB'
}
},
itemStyle: { // 单个拐点标志的样式设置。
normal: {
borderColor: '#1F6AFB',
// 拐点的描边颜色。[ default: '#000' ]
borderWidth: 3,
// 拐点的描边宽度,默认不描边。[ default: 0 ]
}
},
areaStyle: {
normal: {
color: 'rgba(128, 128, 128, 0.1)' // 五点连接后形成的区域颜色: 透明色
}
}
}]
}]
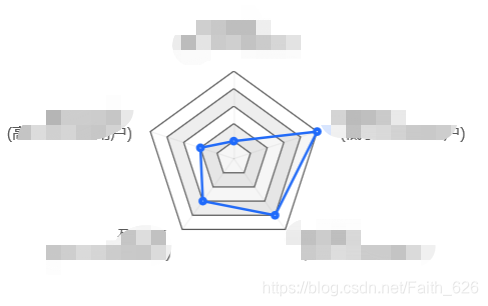
}效果图:


 被折叠的 条评论
为什么被折叠?
被折叠的 条评论
为什么被折叠?
 到【灌水乐园】发言


