


Prometheus
简介
Prometheus是一个开放性的监控解决方案,用户可以非常方便的安装和使用Prometheus并且能够非常方便的对其进行扩展。
在Prometheus的架构设计中,Prometheus Server并不直接服务监控特定的目标,其主要任务负责数据的收集,存储并且对外提供数据查询支持。因此为了能够能够监控到某些东西,如主机的CPU使用率,我们需要使用到Exporter。Prometheus周期性的从Exporter暴露的HTTP服务地址(通常是/metrics)拉取监控样本数据。
Exporter可以是一个相对开放的概念,其可以是一个独立运行的程序独立于监控目标以外,也可以是直接内置在监控目标中。只要能够向Prometheus提供标准格式的监控样本数据即可。
更详细的文档请戳:Prometheus 中文文档
Prometheus下载安装
下载地址:https://prometheus.io/download/
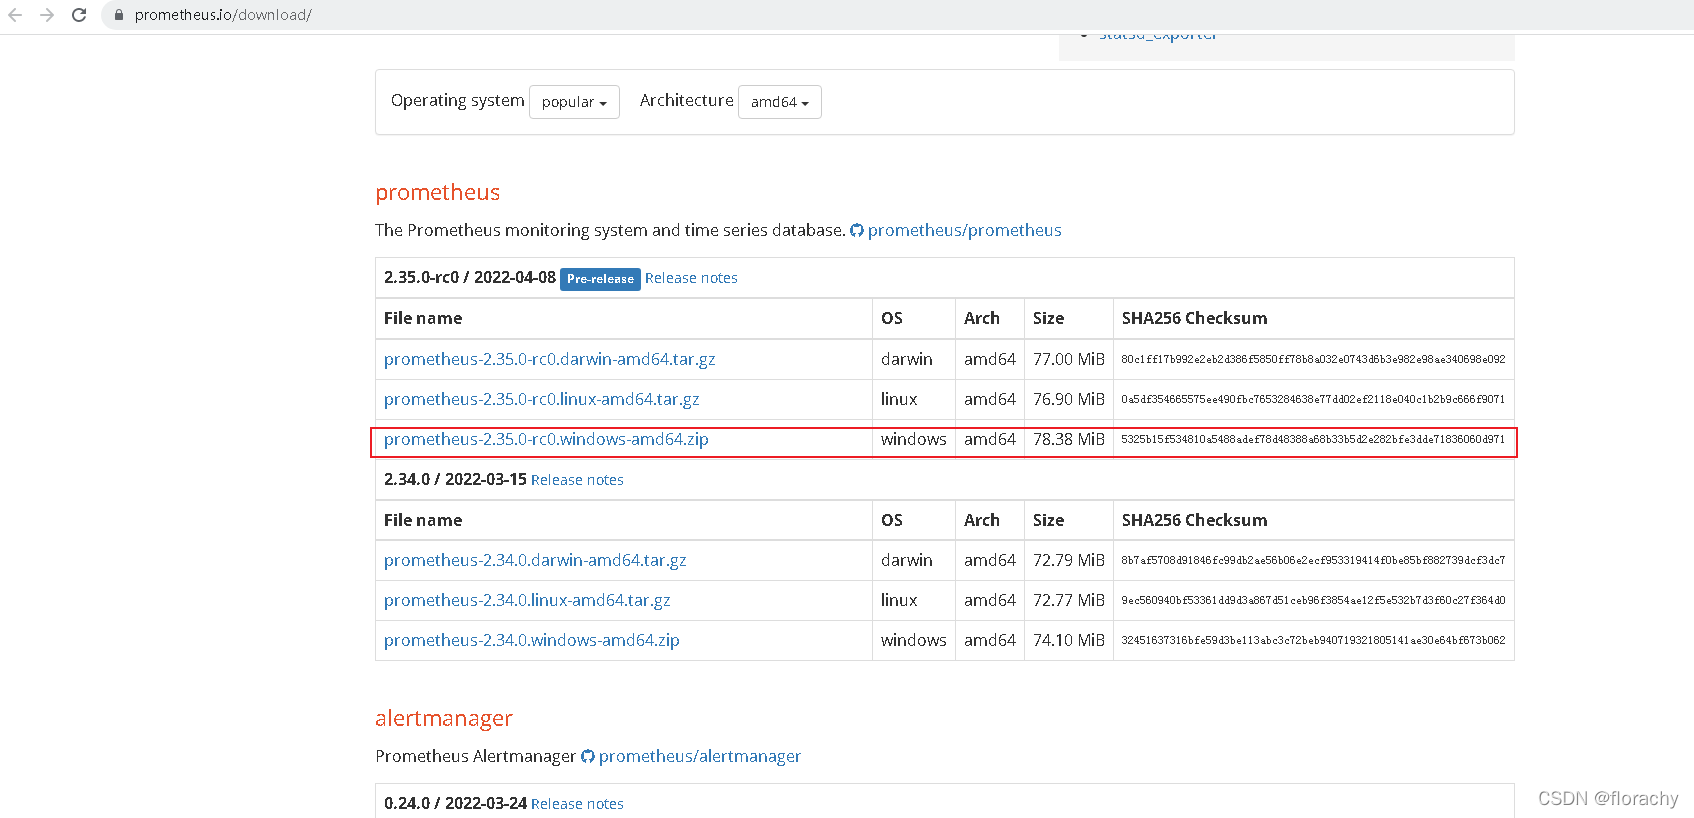
下载完成后,解压压缩包,直接运行prometheus.exe即可。
访问Prometheus
prometheus默认端口是9090,在浏览器输入:localhost:9090即可访问。

也可以在prometheus.yaml中修改默认端口。

Windows Exporter
下载安装
Windows Exporter 由 Prometheus Community 维护,官方地址是:https://github.com/prometheus-community/windows_exporter 。 当前版本是 v0.18.0 ,发行于 2022.02.05 。
Windows Exporter 是一个采集 Windows 机器指标的采集器。支持 Windows Server 2008R2 以上版本或者 Windows 7 以上版本。
Windows Exporter 在发布的是时候提供了两种格式的文件,分别是 *.exe 和 *.msi 。
MSI (Microsoft Installers)是 Windows 的包管理器,类似于 Linux 的 rpm 。
Windows Exporter 每个版本都提供一个 .msi 安装程序。安装程序将 windows_exporter 设置为 Windows 服务,并在 Windows 防火墙中创建一个异常。
我们在使用的时候可以选择任意一种格式来进行安装。
下载地址:https://github.com/prometheus-community/windows_exporter/releases
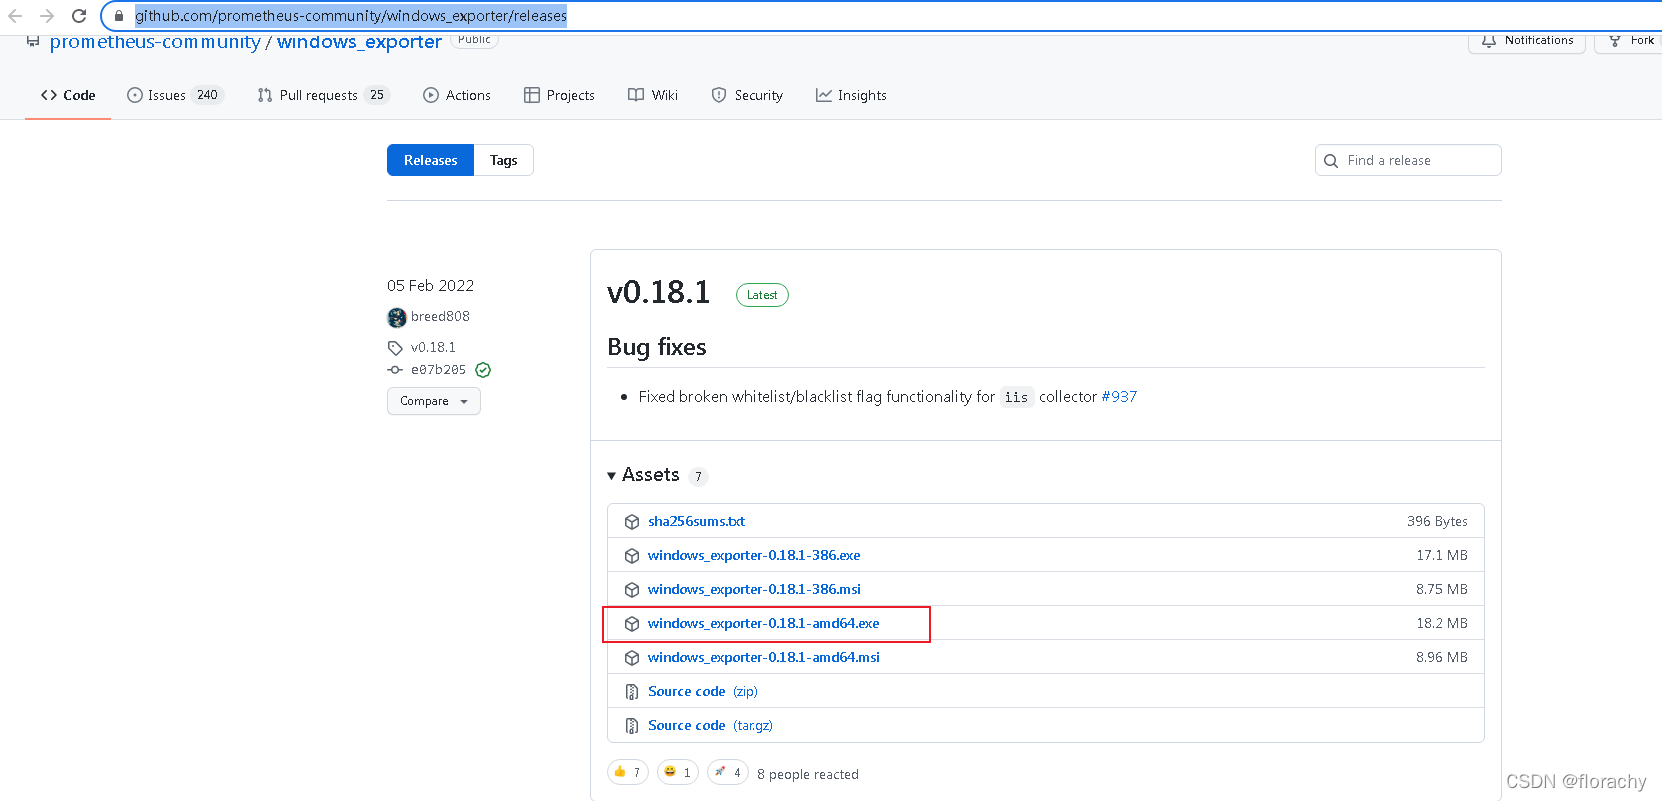
下载完成后,管理员直接运行windows_exporter-0.18.1-amd64.exe文件即可。
访问Windows Exporter
windows_exporter默认端口是9182,在浏览器输入:localhost:9182即可访问。

采集的指标
这个列表是 Windows Exporter 支持采集的指标,有一些指标是启动后缺省会打开的,有一些是需要手动打开的。
https://github.com/prometheus-community/windows_exporter
| 名称 | 说明 | 是否默认开启 |
|---|---|---|
| ad | Active Directory Domain Services | × |
| adcs | Active Directory Certificate Services | × |
| adfs | Active Directory Federation Services | × |
| cache | Cache metrics | × |
| cpu | CPU usage | ✓ |
| cpu_info | CPU Information | × |
| cs | “Computer System” metrics(system properties, num cpu / total memory) | ✓ |
| container | Container metrics | × |
| dfsr | DFSR metrics | × |
| dhcp | DHCP Server | × |
| dns | DNS Server | × |
| exchange | Exchange metrics | × |
| hyperv | Hyper-V hosts | × |
| iis | IIS sites and applications | × |
| logical_disk | Logical disks, disk I/O | ✓ |
| logon | User logon sessions | × |
| memory | Memory usage metrics | × |
| msmq | MSMQ queues | × |
| mssql | SQL Server Performance Objects metrics | × |
| netframework_clrexceptions | .NET Framework CLR Exceptions | × |
| netframework_clrinterop | .NET Framework Interop Metrics | × |
| netframework_clrjit | .NET Framework JIT metrics | × |
| netframework_clrloading | .NET Framework CLR Loading metrics | × |
| netframework_clrlocksandthreads | .NET Framework locks and metrics threads | × |
| netframework_clrmemory | .NET Framework Memory metrics | × |
| netframework_clrremoting | .NET Framework Remoting metrics | × |
| netframework_clrsecurity | .NET Framework Security Check metrics | × |
| net | Network interface I/O | ✓ |
| os | OS metrics (memory, processes, users) | ✓ |
| process | Per-process metrics | × |
| remote_fx | RemoteFX protocol (RDP) metrics | × |
| service | Service state metrics | ✓ |
| smtp | IIS SMTP Server | × |
| system | System calls | ✓ |
| tcp | TCP connections | × |
| time | Windows Time Service | × |
| thermalzone | Thermal information | × |
| terminal_services | Terminal services (RDS) | × |
| textfile | Read prometheus metrics from a text file | ✓ |
| vmware | Performance counters installed by the Vmware Guest agent | × |
使用配置文件
Windows Exporter 支持使用 --config.file 参数来指定一个 YAML 格式的文件作为配置文件来启动,比如: .\windows_exporter.exe --config.file=config.yml .
这个配置文件支持配置要采集的内容,日志、等内容。
Prometheus配置exporter
打开prometheus的配置文件:

在prometheus.yaml中加上如下内容:
	- job_name: “windows_exporter”

	# you can customize the job name’.
	  static_configs:
		- targets: ["localhost:9182", "10.47.38.66:9182", "10.47.38.62:9182"]

重启prometheus即可查看已经配置好的exporter。

了解更多的Exporter
关于Exporter的介绍可以看这篇文章,介绍的非常详细。
https://xie.infoq.cn/article/230d2f31f102259dfe821519f


 4357
4357

 被折叠的 条评论
为什么被折叠?
被折叠的 条评论
为什么被折叠?
 到【灌水乐园】发言


