


文章目录
0 前言
🔥这两年开始毕业设计和毕业答辩的要求和难度不断提升,传统的毕设题目缺少创新和亮点,往往达不到毕业答辩的要求,这两年不断有学弟学妹告诉学长自己做的项目系统达不到老师的要求。
为了大家能够顺利以及最少的精力通过毕设,学长分享优质毕业设计项目,今天要分享的是
🚩 基于大数据的世界500强数据分析与可视化
🥇学长这里给一个题目综合评分(每项满分5分)
- 难度系数:3分
- 工作量:3分
- 创新点:3分
🧿 选题指导, 项目分享:见文末
1 简介
本项目对Python的2022年《财富》世界500强数据进行可视化分析,通过此项目,你可以了解到各国在榜企业的数量,各国在榜企业的总部所属城市的城市数量分布。今年新上榜的企业详情等等
2 数据处理
import pandas as pd
import numpy as np
from pyecharts.charts import *
import pyecharts.options as opts
from pyecharts.commons.utils import JsCode
import warnings
warnings.filterwarnings(‘ignore’)
df2022 = pd.read_csv(‘/home/mw/input/caifu5003751/2022年《财富》世界500强.csv’)
print(‘{:-^36}’.format(‘’))
print(‘数据集存在重复值个数:’)
print(df2022.duplicated().sum())
print(‘{:-^36}’.format(‘’))
print(‘数据集缺失值情况:’)
print(df2022.isna().sum())
print(‘{:-^36}’.format(‘’))
print(‘数据集各字段类型:’)
print(df2022.dtypes)
print(‘{:-^36}’.format(‘’))
def drop_en(tag):
r = tag.split(’ ‘)[0]
return r
df2022[‘country’] = df2022[‘country’].map(lambda x:drop_en(x))
df2022[‘headquarters_city’] = df2022[‘headquarters_city’].map(lambda x:drop_en(x))
df2022[‘name’] = df2022[‘name’].map(lambda x:x.split(’(')[0]).tolist()
3 数据可视化
2022《财富》世界500强企业Top10
icon_dict = {
‘dollor’:‘path://M1005.63552 338.752l-320-320a64.064 64.064 0 0 0-106.432 26.304c-14.496 47.008-39.552 87.872-76.64 124.928-49.536 49.504-114.048 87.008-182.304 126.656-72.448 41.984-147.296 85.504-208.64 146.816C59.49152 495.648 24.00352 553.696 3.20352 621.088a64.064 64.064 0 0 0 15.872 64.192l320 320a64.064 64.064 0 0 0 106.432-26.368c14.528-47.008 39.584-87.872 76.704-124.928 49.504-49.504 113.984-86.944 182.304-126.56 72.384-42.048 147.264-85.568 208.576-146.88 52.128-52.128 87.616-110.24 108.448-177.632a64.128 64.128 0 0 0-15.904-64.16zM384.35552 960L64.35552 640c90.944-294.432 485.12-281.568 576-576l320.064 320C869.44352 678.368 475.26752 665.568 384.35552 960z M626.33952 476.8c-10.432-8.736-20.928-14.688-31.488-17.632a91.648 91.648 0 0 0-31.616-3.36 113.28 113.28 0 0 0-32 7.328 439.36 439.36 0 0 0-32.448 14.016 1818.176 1818.176 0 0 0-51.552-57.376c7.744-7.008 15.264-10.56 22.496-10.816 7.264-0.32 14.24 0.448 20.864 2.112 6.752 1.696 12.928 3.136 18.624 4.256a17.216 17.216 0 0 0 15.136-3.808 21.248 21.248 0 0 0 7.552-15.424c0.32-6.304-2.048-12.448-7.328-18.432a41.376 41.376 0 0 0-24.64-14.176 76.064 76.064 0 0 0-29.76 0.672c-10.112 2.304-19.744 6.112-28.864 11.488s-16.448 10.88-21.888 16.256l-6.24-5.888a12.032 12.032 0 0 0-8.64-3.2 11.2 11.2 0 0 0-8.736 4.256 11.52 11.52 0 0 0-2.944 9.12 11.52 11.52 0 0 0 4.064 8.064c2.08 1.76 4.16 3.488 6.24 5.312-8.192 9.888-14.944 20.8-20.256 32.32a108.032 108.032 0 0 0-9.76 34.112c-1.248 11.2-0.064 21.44 3.36 30.944 3.424 9.568 9.76 17.696 19.008 25.376 15.072 12.512 32.8 17.824 53.376 16.64 20.512-1.248 42.624-7.36 66.4-20.128 18.88 21.824 37.824 43.488 56.736 63.616-8 6.752-15.008 10.624-21.184 11.872a33.12 33.12 0 0 1-16.672-0.32 53.024 53.024 0 0 1-13.888-6.688 97.536 97.536 0 0 0-12.64-7.488c-4.128-2.048-8.384-3.2-12.736-3.264s-8.992 2.048-14.112 6.432c-5.248 4.576-7.872 9.888-7.872 15.872 0 5.952 2.752 12 8.128 18.112 5.44 6.112 12.512 11.264 21.056 15.328s18.208 6.624 28.832 7.328a80 80 0 0 0 33.632-5.248c11.872-4.32 23.616-12.128 35.2-23.744 5.568 5.44 11.2 10.624 16.8 15.616a11.52 11.52 0 0 0 8.736 2.816 11.616 11.616 0 0 0 8.64-4.512 12.352 12.352 0 0 0 3.008-9.376 10.912 10.912 0 0 0-4-7.808 419.2 419.2 0 0 1-16.864-14.24c9.568-11.744 17.248-24.128 22.944-36.384 5.696-12.32 9.056-24.192 10.176-35.2a62.88 62.88 0 0 0-3.808-30.112c-3.584-9.184-9.952-17.056-19.072-24.64z m-178.912 21.696a31.072 31.072 0 0 1-23.872-9.312 23.456 23.456 0 0 1-6.24-10.304 32.128 32.128 0 0 1-1.248-13.376c0.448-4.8 1.888-9.824 4.384-14.88 2.368-5.056 5.888-10.112 10.368-15.008a1141.344 1141.344 0 0 1 48.64 52.128c-12.288 6.752-22.976 10.368-32.032 10.752z m150.944 64.064c-2.88 5.312-6.176 10.048-10.048 14.176a1307.616 1307.616 0 0 1-53.76-58.432c4.576-2.048 9.376-4.192 14.56-6.368s10.368-3.616 15.552-4.512c5.312-0.8 10.56-0.576 15.808 0.672 5.184 1.312 10.112 4.128 14.688 8.576 4.512 4.512 7.36 9.184 8.512 14.24 1.248 5.12 1.312 10.304 0.448 15.616a51.584 51.584 0 0 1-5.76 16.032zM471.29952 709.76h-0.064a574.4 574.4 0 0 0-57.6 49.696 467.584 467.584 0 0 0-46.752 54.368l-21.888 29.888 0.064 0.064a16.096 16.096 0 0 0 2.112 20.064 16.128 16.128 0 0 0 22.72 0 15.04 15.04 0 0 0 2.368-3.2l20.448-28c12.672-17.312 27.328-34.368 43.552-50.56a507.52 507.52 0 0 1 54.848-47.2l-0.064-0.064c0.576-0.448 1.12-0.8 1.632-1.312a16 16 0 0 0-21.376-23.744zM588.45152 246.88c-16.736 16.736-34.88 31.808-53.696 46.176a16.192 16.192 0 0 0-3.744 25.632c6.112 6.176 16 6.304 22.368 0.448l0.128 0.064c20-15.36 39.488-31.616 57.568-49.696a470.176 470.176 0 0 0 46.752-54.304l21.888-30.016-0.064-0.064a16.128 16.128 0 0 0-23.616-21.888 17.44 17.44 0 0 0-2.816 3.936l-21.248 29.12a432.448 432.448 0 0 1-43.52 50.592z’
}
tmp = df2022.head(10)[::-1]
p = (PictorialBar(init_opts=opts.InitOpts(height=‘580px’,width=‘980px’,theme=‘light’))
.add_xaxis(tmp[‘name’].tolist())
.add_yaxis(‘’, tmp[‘revenues’].tolist(),
symbol_size=24,
symbol_repeat=“fixed”,
symbol_offset=[125, 0],
is_symbol_clip=True,
symbol=icon_dict[‘dollor’]
)
.set_series_opts(
label_opts=opts.LabelOpts(
position=‘right’,
distance = -150,
formatter=‘{c}million’,
font_family=‘Adobe’,
font_style=‘italic’,
color=‘#1ba784’
)
)
.set_global_opts(
xaxis_opts=opts.AxisOpts(
is_show=False
),
yaxis_opts=opts.AxisOpts(
axislabel_opts=opts.LabelOpts(
margin = -120,
font_family=‘KaiTi’,
font_size=16,
color=‘#1ba784’
),
axisline_opts = opts.AxisLineOpts(
is_show=False
),
axistick_opts = opts.AxisTickOpts(
is_show=False
)
),
title_opts=opts.TitleOpts(
title = ‘Top 10 enterprises in the 2020 Fortune Global 500’,
subtitle = ‘Data source: fortunechina’,
pos_top=‘1%’,
pos_left=‘center’,
title_textstyle_opts=opts.TextStyleOpts(
font_family=‘Adobe’,
font_size=26,
font_weight = ‘bolder’
)
),
)
.reversal_axis()
)
p.render_notebook()
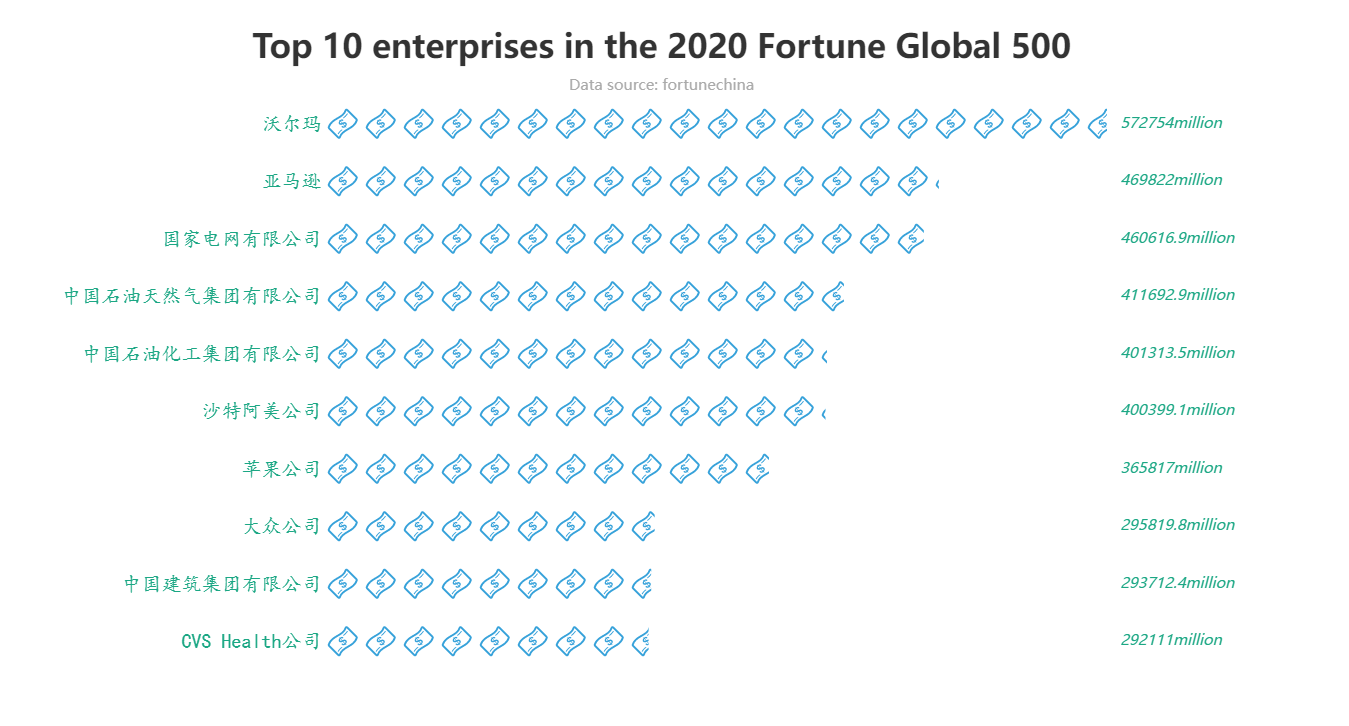
在今年的世界500强企业榜单中
- 沃尔玛以572754百万美元的营业收入夺得榜单第一
- 其次,亚马逊以469822百万美元的营业收入排名第二
- 而我国的国家电网有限公司以460616.9百万美元位居榜单第三
前10企业所属的国家数量占比
rich={
“a”: {“color”: “#999”, “fontSize”:24, “lineHeight”: 22, “align”: “center”,“fontFamily”:“KaiTi”},
“abg”: {
“backgroundColor”: “#e3e3e3”,
“width”: “100%”,
“align”: “right”,
“height”: 28,
“borderRadius”: [4, 4, 0, 0],
},
“hr”: {
“borderColor”: “#aaa”,
“width”: “100%”,
“borderWidth”: 0.5,
“height”: 0,
},
“c”: {“fontSize”: 12, “align”: “center”, “fontFamily”:“Adobe”, “fontStyle”:“italic”},
“d”: {“fontSize”: 12}
}
attrs = tmp[‘country’].value_counts().index.tolist()
value = tmp[‘country’].value_counts().values.tolist()
pie = (Pie(init_opts=opts.InitOpts(width=‘980px’))
.add(‘’,[list(z) for z in zip(attrs,value)],radius=[‘50%’,‘65%’],center=[‘50%’,‘60%’],)
.set_colors([‘#428675’,‘#63AA83’,‘#92CD8A’,‘#CCEF8F’])
.set_series_opts(
label_opts=opts.LabelOpts(
formatter="{a|{b}}{abg|}\n {hr|}\n {c|{c} enterprise(s)\n Percentage {d}%} ",
rich=rich
)
)
.set_global_opts(
legend_opts=opts.LegendOpts(
is_show=False
),
title_opts=opts.TitleOpts(
title = ‘Number and proportion of top 10 enterprises in countries’,
subtitle = ‘Data source: fortunechina’,
pos_top=‘1%’,
pos_left=‘center’,
title_textstyle_opts=opts.TextStyleOpts(
font_family=‘Adobe’,
font_size=26,
font_weight = ‘bolder’
)
),
)
)
pie.render_notebook()
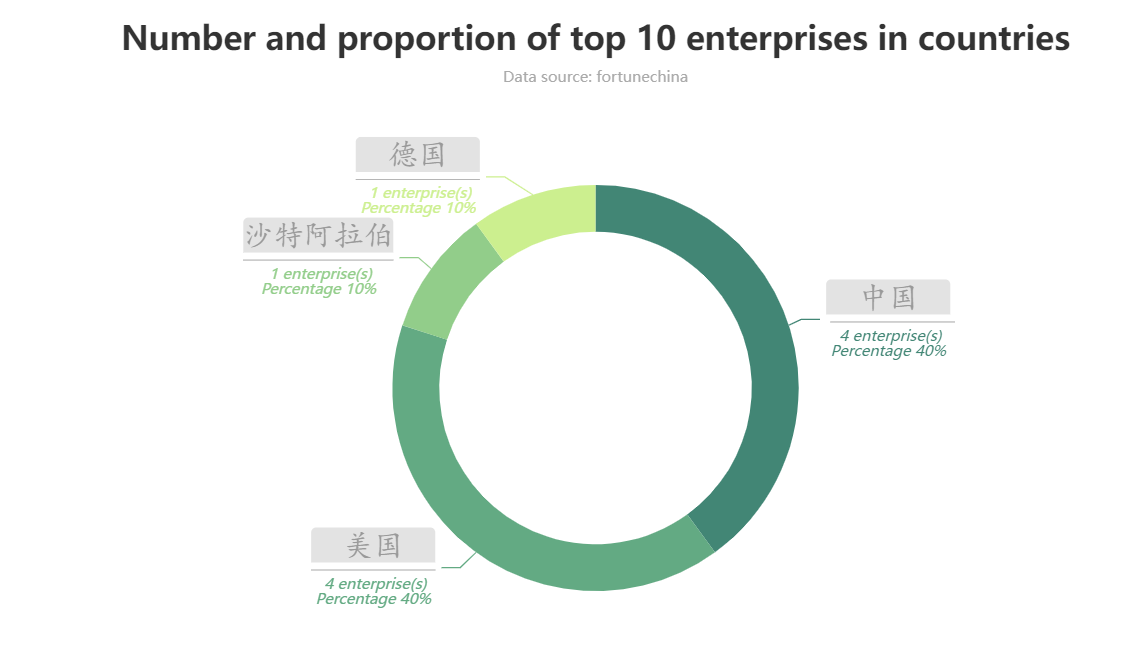
在榜单前10的企业中
- 属于美国的企业有4家,同时也有4家企业是中国的企业
- 此外,沙特阿拉伯与德国也各有1家企业在榜(Top10)
各国在榜的企业数量
tmp = pd.DataFrame(df2022[‘country’].value_counts()).reset_index()
tmp.columns = [‘country’,‘count’]
map_name = pd.read_csv(‘/home/mw/input/mapname2791/Pyecharts世界地图国家名称中英映射.csv’)
tmp[‘country’] = tmp[‘country’].map(lambda x:x.split(’ ')[0])
tmp.replace(‘俄罗斯’,‘俄罗斯联邦’,inplace=True)
tmp = tmp.merge(map_name,left_on=‘country’,right_on=‘中文名称’)
tmp.drop([‘中文名称’,‘ISO-2’],axis=1,inplace=True)
attrs = tmp[‘英文名称’].tolist()
value = tmp[‘count’].tolist()
map_= (
Map(init_opts=opts.InitOpts(height=‘650px’,width=‘980px’,theme=‘light’))
.add(“总数”,
[list(z) for z in zip(attrs,value)],
“world”,
is_map_symbol_show=False,
is_roam=False,
zoom=1.2,
)
.set_series_opts(
label_opts=opts.LabelOpts(
is_show=False
),
itemstyle_opts=opts.ItemStyleOpts(
border_color=‘#fff’,
border_width=2
)
)
.set_global_opts(
title_opts=opts.TitleOpts(
title=“Number of enterprises listed in the Fortune Global 500 countries in 2022”,
subtitle=‘Data source: fortunechina’,
pos_top=‘1%’,
pos_left=‘center’,
title_textstyle_opts=opts.TextStyleOpts(
font_family=‘Adobe’,
font_size=22,
font_weight = ‘bolder’
)
),
visualmap_opts=opts.VisualMapOpts(
max_=150,
is_piecewise=True,
pieces=[
{“min”: 50, “max”: 150},
{“min”: 25, “max”: 50},
{“min”: 10, “max”: 25},
{“min”: 5, “max”: 10},
{“max”: 5}
],
pos_bottom=‘15%’,
pos_left=‘10%’,
range_text=[‘企业数量’, ‘’],
range_color=[‘#98E885’, ‘#26D0A4’, ‘#00B1B8’, ‘#008FB6’, ‘#346C9C’]
),
legend_opts=opts.LegendOpts(
is_show=False
),
)
)
bar = (Bar(init_opts=opts.InitOpts(theme=‘light’,width=‘980px’,height=‘300px’))
.add_xaxis(tmp[‘country’].tolist())
.add_yaxis(“”, tmp[‘count’].tolist(),
itemstyle_opts={
‘normal’: {
‘shadowColor’: ‘rgba(0, 0, 0, .5)’,
‘shadowBlur’: 5,
‘shadowOffsetY’: 2,
‘shadowOffsetX’: 2,
‘borderColor’: ‘#fff’
}}
)
.set_series_opts(
label_opts=opts.LabelOpts(
position=“insideBottom”,
font_size=10,
rotate=‘90’,
vertical_align=‘middle’,
horizontal_align=‘left’,
#font_weight=‘bold’,
formatter=‘{b}:{c}家’
)
)
.set_global_opts(
xaxis_opts=opts.AxisOpts(is_show=False, boundary_gap=False),
yaxis_opts=opts.AxisOpts(is_show=False),
visualmap_opts=opts.VisualMapOpts(
is_show=False,
type_=‘color’,
is_piecewise=True,
pieces=[{‘min’: 50, ‘max’: 150},
{‘min’: 25, ‘max’: 50},
{‘min’: 10, ‘max’: 25},
{‘min’: 5, ‘max’: 10},
{‘max’: 5}],
range_color=[“#EEA2A4”,“#F0616F”]
),
graphic_opts=[
opts.GraphicGroup(
graphic_item=opts.GraphicItem(
left=“5%”, top=“5%”),
children=[
opts.GraphicRect(
graphic_item=opts.GraphicItem(
z=0, left=“center”, top=“middle”
),
graphic_shape_opts=opts.GraphicShapeOpts(
width=900, height=270),
graphic_basicstyle_opts=opts.GraphicBasicStyleOpts(
fill=“#fff”,
stroke=“#000”,
),
),
],
)
],
tooltip_opts=opts.TooltipOpts(
is_show=True,
formatter=JsCode(
“function(data){return data.name + ': ’ + data.value+ ‘家企业’;}”),),
)
)
page = Page()
page.add(map_,bar)
page.render_notebook()
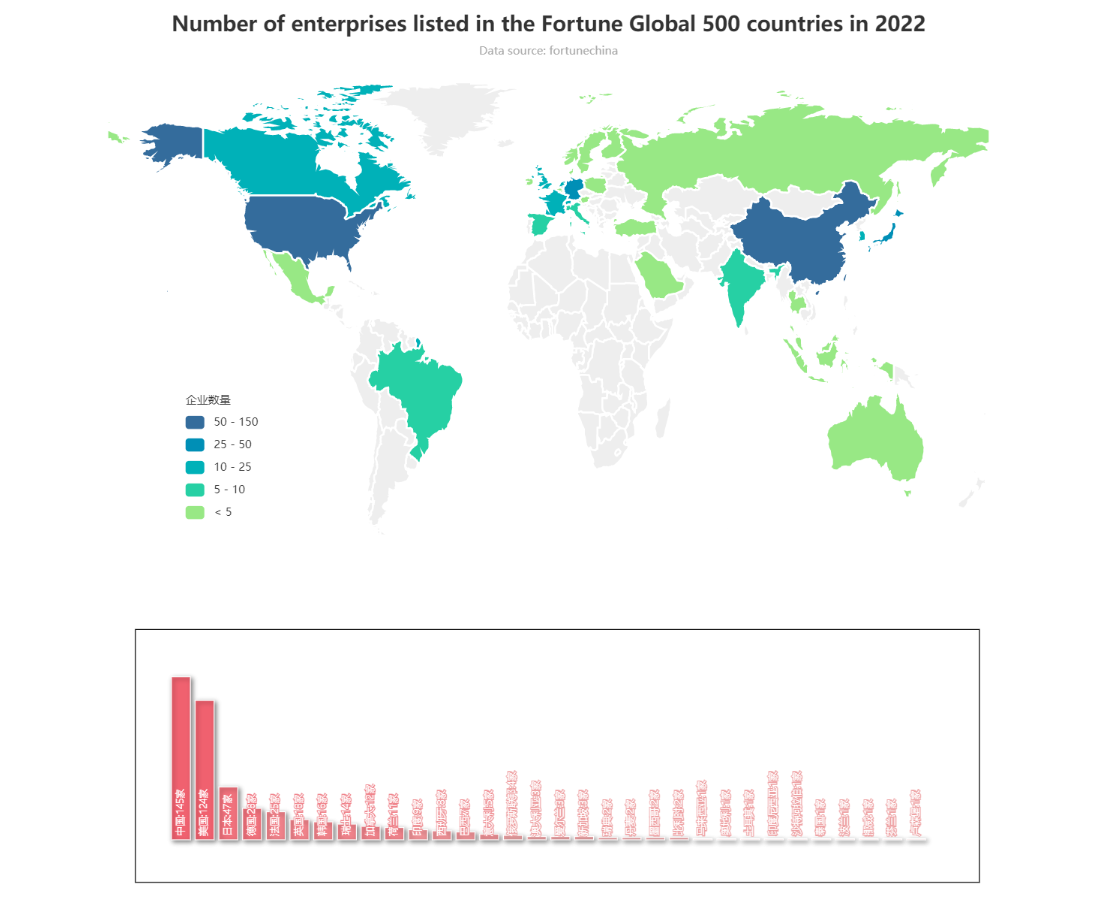
在总榜中
- 我国总共有145家企业入榜,位列所有国家中的入榜数量第一位
- 其次,美国与日本分别有124、47家企业入榜,位列第2与第3
- 同时,通过其结果也可发现,超过100家企业入榜的国家仅有中国与美国
入榜企业所属国家及总部所在城市数量分布详情
tmp3 = df2022.groupby([‘country’,‘headquarters_city’]).agg({‘name’:‘count’}).reset_index()
tmp3.columns = [‘country’,‘headquarters_city’,‘count’]
data = []
item = []
for idx, row in tmp3.iterrows():
if row[‘country’] in item:
data[-1][‘children’].append(dict(name=row[‘headquarters_city’], value=row[‘count’]))
else:
data.append(dict(name=row[‘country’], children=[dict(name=row[‘headquarters_city’], value=row[‘count’])]))
item.append(row[‘country’])
rich={
“b”: {“color”: “white”, “fontSize”:20, “align”: “center”, “fontFamily”:“KaiTi”},
“c”: {“color”:“white”,“fontSize”:14,“fontFamily”:“Adobe”, “fontStyle”:“italic”},
}
tree = (TreeMap(init_opts=opts.InitOpts(width=‘980px’,height=‘600px’,))
.add(
“Enterprises”,
data,
leaf_depth=1,
roam=False,
label_opts=opts.LabelOpts(
position=“inside”,
formatter=‘{b|{b}}\n{c|{c}} enterprise(s)’,
rich=rich
),
levels=[
opts.TreeMapLevelsOpts(
treemap_itemstyle_opts=opts.TreeMapItemStyleOpts(
border_color=“white”, border_width=4, gap_width=4
)
),
opts.TreeMapLevelsOpts(
color_saturation=[0.8, 0.5],
treemap_itemstyle_opts=opts.TreeMapItemStyleOpts(
border_color=“white”,border_color_saturation=0.7, gap_width=4, border_width=8
),
)
],
)
.set_global_opts(
title_opts=opts.TitleOpts(
title=“Number of countries and cities where the headquarters of listed enterprises are located”,
subtitle=‘(Click to drill down to the details of each city)’,
pos_left=‘center’,
title_textstyle_opts=opts.TextStyleOpts(
font_size=20,
font_family=‘Adobe’,
font_weight=‘bolder’),
pos_top=‘1%’
),
legend_opts=opts.LegendOpts(
is_show=False
)
)
)
tree.render_notebook()
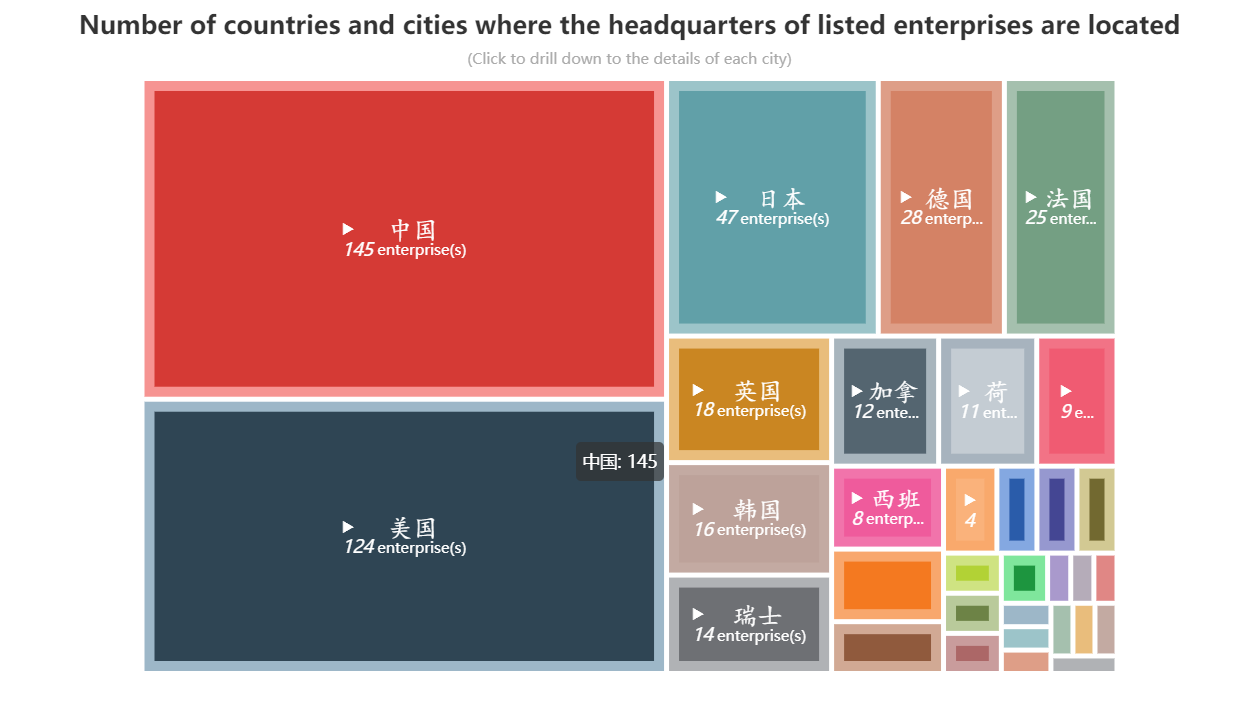
以上榜企业数量最多的国家–中国为例
通过点击
- 企业总部最多的城市是在北京市,共有54家企业设立总部在此
- 其次是上海,共有12家企业将总部设立在此
结合上图5,可以得到以下信息:
上榜企业更多的是出现在发达国家或是发达地区
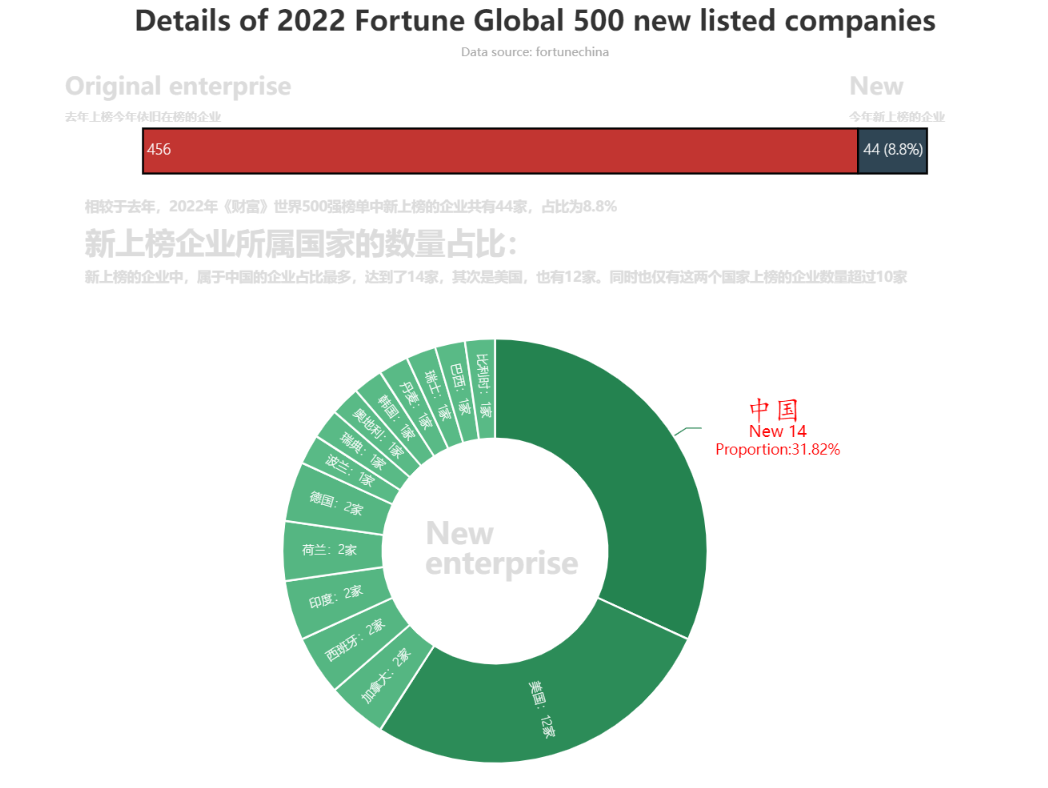
今年新上榜的企业详情
df2022[‘is_new’] = df2022[‘last_year_rank’].map(lambda x:‘yes’ if x == ‘未上榜’ else ‘no’)
tmp = pd.DataFrame(df2022.is_new.value_counts()).reset_index().T
tmp.columns = tmp.loc[‘index’].tolist()
tmp.drop(‘index’,axis=0,inplace=True)
bar = (Bar(init_opts=opts.InitOpts(height=‘300px’,width=‘980px’))
.add_xaxis(tmp.index.tolist())
.add_yaxis(‘’,tmp[‘no’].tolist(),stack=1,bar_width=45,
label_opts=opts.LabelOpts(
position=‘insideLeft’,
font_family=‘Adobe’,
font_size=14,
font_weight=‘lighter’,
formatter=‘{c}’
)
)
.add_yaxis(‘’,tmp[‘yes’].tolist(),stack=1,
label_opts=opts.LabelOpts(
position=‘insideRight’,
font_family=‘Adobe’,
font_size=14,
font_weight=‘lighter’,
formatter=‘{c}’+’ (‘+str(round((tmp[‘yes’].values[0]/500)*100,2))+’%‘+’)’
)
)
.set_series_opts(
itemstyle_opts=opts.ItemStyleOpts(
border_color=‘#000’,
border_width=2,
)
)
.set_global_opts(
title_opts=opts.TitleOpts(
title = ‘Details of 2022 Fortune Global 500 new listed companies’,
subtitle=‘Data source: fortunechina’,
pos_top=‘1%’,
pos_left=‘center’,
title_textstyle_opts=opts.TextStyleOpts(
font_family=‘Adobe’,
font_size=28,
font_weight = ‘bolder’
)
),
xaxis_opts=opts.AxisOpts(
is_show=False,
max_=500
),
yaxis_opts=opts.AxisOpts(
is_show=False,
),
graphic_opts=[
opts.GraphicGroup(
graphic_item=opts.GraphicItem(id_=‘1’,left=“20PX”, top=“75PX”),
children=[
opts.GraphicText(
graphic_textstyle_opts=opts.GraphicTextStyleOpts(
text=‘Original enterprise’,
font=“bolder 24px Microsoft YaHei”,
graphic_basicstyle_opts=opts.GraphicBasicStyleOpts(
fill=“rgb(220,220,220)”,
stroke=‘rgb(220,220,220)’,
shadow_blur=10,
shadow_offset_x=10,
shadow_offset_y=10,
shadow_color=‘rgba(0, 0, 0, 0.5)’
),),),
opts.GraphicText(
graphic_textstyle_opts=opts.GraphicTextStyleOpts(
text=‘\n\n\n去年上榜今年依旧在榜的企业’,
font=“bolder 12px Microsoft YaHei”,
graphic_basicstyle_opts=opts.GraphicBasicStyleOpts(
fill=“rgb(220,220,220)”,
stroke=‘rgb(220,220,220)’,
shadow_blur=10,
shadow_offset_x=10,
shadow_offset_y=10,
shadow_color=‘rgba(0, 0, 0, 0.5)’
),),),
]),
opts.GraphicGroup(
graphic_item=opts.GraphicItem(id_=‘2’,right=“80PX”, top=“75PX”),
children=[
opts.GraphicText(
graphic_textstyle_opts=opts.GraphicTextStyleOpts(
text=‘New’,
font=“bolder 24px Microsoft YaHei”,
graphic_basicstyle_opts=opts.GraphicBasicStyleOpts(
fill=“rgb(220,220,220)”,
stroke=‘rgb(220,220,220)’,
shadow_blur=10,
shadow_offset_x=10,
shadow_offset_y=10,
shadow_color=‘rgba(0, 0, 0, 0.5)’
),),),
opts.GraphicText(
graphic_textstyle_opts=opts.GraphicTextStyleOpts(
text=‘\n\n\n今年新上榜的企业’,
font=“bolder 12px Microsoft YaHei”,
graphic_basicstyle_opts=opts.GraphicBasicStyleOpts(
fill=“rgb(220,220,220)”,
stroke=‘rgb(220,220,220)’,
shadow_blur=10,
shadow_offset_x=10,
shadow_offset_y=10,
shadow_color=‘rgba(0, 0, 0, 0.5)’
),),),]),
opts.GraphicGroup(
graphic_item=opts.GraphicItem(id_=‘4’,left=“40px”, top=“200px”, z=2),
children=[
opts.GraphicText(
graphic_textstyle_opts=opts.GraphicTextStyleOpts(
text=‘相较于去年,2022年《财富》世界500强榜单中新上榜的企业共有44家,占比为8.8%\n\n\n\n\n新上榜的企业中,属于中国的企业占比最多,达到了14家,其次是美国,也有12家。同时也仅有这两个国家上榜的企业数量超过10家’,
font=“bolder 14px Microsoft YaHei”,
graphic_basicstyle_opts=opts.GraphicBasicStyleOpts(
fill=“rgb(220,220,220)”,
),
),
),
opts.GraphicText(
graphic_textstyle_opts=opts.GraphicTextStyleOpts(
text=‘\n新上榜企业所属国家的数量占比:’,
font=“bolder 30px Microsoft YaHei”,
graphic_basicstyle_opts=opts.GraphicBasicStyleOpts(
fill=“rgb(220,220,220)”,
),
),
),
],
)
]
)
.reversal_axis()
)
tmp3 = df2022.query(‘is_new == “yes”’)[‘country’].value_counts()
attrs = tmp3.index.tolist()
value = tmp3.values.tolist()
rich={
“a”: {“color”: “red”, “fontSize”:28, “fontFamily”:“KaiTi”, “align”: “center”},
“c”: {“color”: “red”, “fontSize”:16, “align”: “center”, “fontFamily”:“Adobe”},
“d”: {“color”:“red”,“fontSize”:14,“fontFamily”:“Adobe”},
}
data_pair = []
for k, v in zip(attrs,value):
if k == “中国”:
chart_item = opts.PieItem(
name = k,
value = v,
label_opts=opts.LabelOpts(
position=‘outside’,
formatter=“{a|{b}}\n {c|New {c}}\n {d|Proportion:{d}%}”,
rich=rich,
font_weight=‘lighter’,
font_family=‘KaiTi’,
font_size=18
),
)
else:
chart_item = opts.PieItem(
name = k,
value = v,
label_opts=opts.LabelOpts(
position=‘inside’,
rotate=‘90’,
formatter = ‘{b}:{c}家’,
font_weight=‘lighter’
),
)
data_pair.append(chart_item)
pie = (Pie()
.add(‘’,data_pair=data_pair,radius=[‘45%’,‘85%’])
.set_series_opts(
itemstyle_opts=opts.ItemStyleOpts(
border_color=‘#fff’,
border_width=2
)
)
.set_global_opts(
legend_opts=opts.LegendOpts(
is_show=False
),
visualmap_opts=opts.VisualMapOpts(
max_=15,
min_=0,
is_show=False,
range_color=[‘#5dbe8a’,‘#207f4c’]
),
graphic_opts=[
opts.GraphicGroup(
graphic_item=opts.GraphicItem(id_=‘1’,left=“380PX”, top=“220PX”),
children=[
opts.GraphicText(
graphic_textstyle_opts=opts.GraphicTextStyleOpts(
text=‘New\nenterprise’,
font=“bolder 30px Microsoft YaHei”,
graphic_basicstyle_opts=opts.GraphicBasicStyleOpts(
fill=“rgb(220,220,220,1.8)”,
stroke=‘rgb(220,220,220)’,
shadow_blur=10,
shadow_offset_x=10,
shadow_offset_y=10,
shadow_color=‘rgba(0, 0, 0, 0.2)’
),
),
),])]
)
)
page = Page()
page.add(bar,pie)
page.render_notebook()
8 不同员工数量的企业数量分布详情
df2022[‘emp_cut’] = pd.cut(df2022[‘employees’],[0,1e+04,5e+04,1e+05,1.5e+05,2e+05,3e+05,1e+10],
labels=[‘<1w’,‘1w-5w’,‘5w-10w’,‘10w-15w’,‘15w-20w’,‘20w-30w’,‘30w<’])
tmp = pd.DataFrame(df2022[‘emp_cut’].value_counts()).sort_index().reset_index()
attrs = tmp[‘index’].tolist()[::-1]
value = tmp[‘emp_cut’].tolist()[::-1]
polar = (
Polar(init_opts=opts.InitOpts(width=‘980px’))
.add_schema(
radiusaxis_opts=opts.RadiusAxisOpts(
data=attrs,
type_=“category”,
axisline_opts=opts.AxisLineOpts(
is_show=False
),
axistick_opts=opts.AxisTickOpts(
is_show=False
),
axislabel_opts=opts.LabelOpts(
font_family=‘Adobe’,
font_size=12,
)
),
angleaxis_opts=opts.AngleAxisOpts(
is_clockwise=True,
is_scale=True,
max_=150,
axislabel_opts=opts.LabelOpts(
font_size=14,
font_family=‘Adobe’,
font_weight=‘lighter’
),
axisline_opts=opts.AxisLineOpts(
is_show=True,
linestyle_opts=opts.LineStyleOpts(
width=2,
type_=‘dashed’,)
),
splitline_opts=opts.SplitLineOpts(
is_show=True,
linestyle_opts=opts.LineStyleOpts(
width=1,
type_=‘dashed’,
color=‘#34C191’)
)
),
)
.add(“”, value, type_=‘bar’)
.set_global_opts(
title_opts=opts.TitleOpts(
title=‘Number of enterprises with different number of employees’,
subtitle=‘Data source: fortunechina’,
title_textstyle_opts=opts.TextStyleOpts(
font_family=‘Adobe’,
font_weight=‘bolder’,
font_size=22,
),
),
visualmap_opts=opts.VisualMapOpts(
is_show=False,
max_=150,
min_=0,
split_number=8,
dimension=1,
range_color=[‘#76FAC7’,‘#008A5E’]
)
)
)
polar.render_notebook()
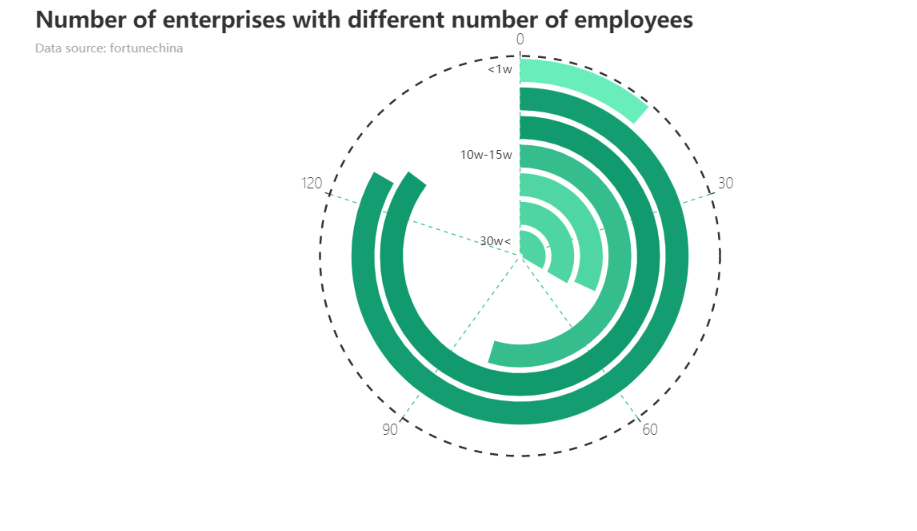
- 更多企业的拥有10w-15w的员工数量,位于此区间的企业共有128家
- 其次是拥有15w-20w的员工数量公司,仅比10w-15w的员工数量的企业少3家,达到了125家
- 而数量最少的是员工数量小于1w的企业,仅有17家
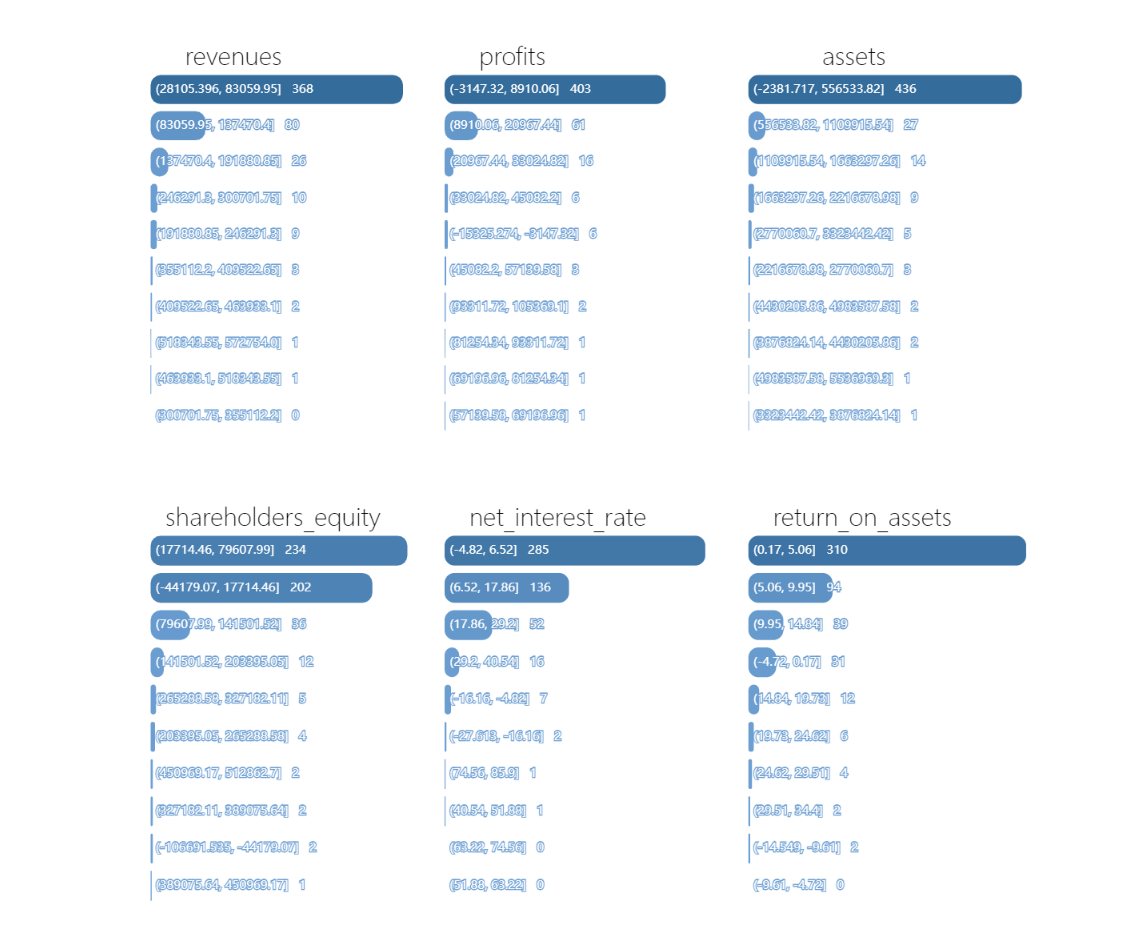
其他指标详情
def draw_bar(desc,title_pos,tag):
tmp = pd.DataFrame(pd.cut(df2022[tag],bins=10).value_counts()).reset_index().sort_values(tag,ascending=False)
tmp.columns = [‘label’,‘values’]
tmp[‘label’] = tmp[‘label’].astype(str)
datax = tmp[‘label’].tolist()
datay = tmp[‘values’].tolist()
bar = (Bar(init_opts=opts.InitOpts(width=‘420px’))
.add_xaxis(datax[::-1])
.add_yaxis(‘’,datay[::-1])
.set_series_opts(
label_opts=opts.LabelOpts(
position=‘insideLeft’,
formatter=‘{b} {c}’
),
itemstyle_opts={
‘barBorderRadius’: [10, 10, 10, 10]
}
)
.set_global_opts(
yaxis_opts=opts.AxisOpts(
is_show=False
),
xaxis_opts=opts.AxisOpts(
is_show=False
),
visualmap_opts=opts.VisualMapOpts(
is_show=False,
dimension=0,
max_ = max(datay),
min_ = min(datay),
range_color=[‘#6D9FD3’,‘#346C9C’]
),
title_opts=opts.TitleOpts(
title=desc,
pos_left=title_pos[0],
pos_top=title_pos[1],
title_textstyle_opts=opts.TextStyleOpts(
color=‘#000’,
font_size=24,
font_family=‘Adobe’,
font_weight=‘lighter’)
)
)
.reversal_axis()
)
return bar
grid = Grid(
init_opts=opts.InitOpts(
#theme=‘white’,
width=‘980px’,
height=‘980px’)
)
grid.add(
draw_bar(‘revenues’, [‘5%’, ‘5%’],‘revenues’),
is_control_axis_index=False,
grid_opts=opts.GridOpts(
pos_top=‘8%’,
pos_bottom=‘55%’,
pos_left=‘2%’,
pos_right=‘70%’
)
)
grid.add(
draw_bar(‘profits’, [‘35%’, ‘5%’],‘profits’),
is_control_axis_index=False,
grid_opts=opts.GridOpts(
pos_top=‘8%’,
pos_bottom=‘55%’,
pos_left=‘32%’,
pos_right=‘40%’
)
)
grid.add(
draw_bar(‘assets’, [‘70%’, ‘5%’],‘assets’),
is_control_axis_index=False,
grid_opts=opts.GridOpts(
pos_top=‘8%’,
pos_bottom=‘55%’,
pos_left=‘63%’,
pos_right=‘5%’
)
)
grid.add(
draw_bar(‘shareholders_equity’, [‘3%’, ‘52%’],‘shareholders_equity’),
is_control_axis_index=False,
grid_opts=opts.GridOpts(
pos_top=‘55%’,
pos_bottom=‘7%’,
pos_left=‘2%’,
pos_right=‘70%’
)
)
grid.add(
draw_bar(‘net_interest_rate’, [‘34%’, ‘52%’],‘net_interest_rate’),
is_control_axis_index=False,
grid_opts=opts.GridOpts(
pos_top=‘55%’,
pos_bottom=‘7%’,
pos_left=‘32%’,
pos_right=‘40%’
)
)
grid.add(
draw_bar(‘return_on_assets’, [‘65%’, ‘52%’],‘return_on_assets’),
is_control_axis_index=False,
grid_opts=opts.GridOpts(
pos_top=‘55%’,
pos_bottom=‘7%’,
pos_left=‘63%’,
pos_right=‘5%’
)
)
grid.render_notebook()
2022年上榜企业与上一年的企业的平均营业收入年增长详情
## 读取2021年的数据
df2021 = pd.read_csv(‘/home/mw/input/caifu5009179/2021年《财富》世界500强.csv’)
data2021 = round(df2021[‘revenue_percent_change’].mean(),2)
data2022 = round(df2022[‘revenue_percent_change’].mean(),2)
lq = (Liquid()
.add(“lq”,
[data2021/100],
center=[‘25%’,‘50%’],
shape=‘roundRect’,
label_opts=opts.LabelOpts(
font_size=50,
formatter=JsCode(
“”“function (param) {
return (Math.floor(param.value * 10000) / 100) + ‘%’;
}”“”
),
position=“inside”,
),
)
)
lq1 = (Liquid()
.add(“lq”,
[data2022/100],
center=[‘75%’,‘50%’],
shape=‘roundRect’,
label_opts=opts.LabelOpts(
font_size=50,
formatter=JsCode(
“”“function (param) {
return (Math.floor(param.value * 10000) / 100) + ‘%’;
}”“”
),
position=“inside”,
)
)
.set_global_opts(
title_opts=[
dict(
text=‘Details of annual growth of average operating income in 2021 and 2022’,left=‘center’,top=‘5%’,
textStyle=dict(
color=‘#000’,
fontSize=24)),
dict(
text=‘Average value in 2022’,right=‘13%’,top=‘16%’,
textStyle=dict(
color=‘#000’,
fontFamily=‘Adobe’,
fontWeight=‘lighter’,
fontSize=24)),
dict(
text=‘Average value in 2021’,left=‘13%’,top=‘16%’,
textStyle=dict(
color=‘#000’,
fontFamily=‘Adobe’,
fontWeight=‘lighter’,
fontSize=24)),
]
)
)
grid = Grid(init_opts=opts.InitOpts(width='1100px'))
grid.add(lq, grid_opts=opts.GridOpts()).add(lq1, grid_opts=opts.GridOpts())
grid.render_notebook()
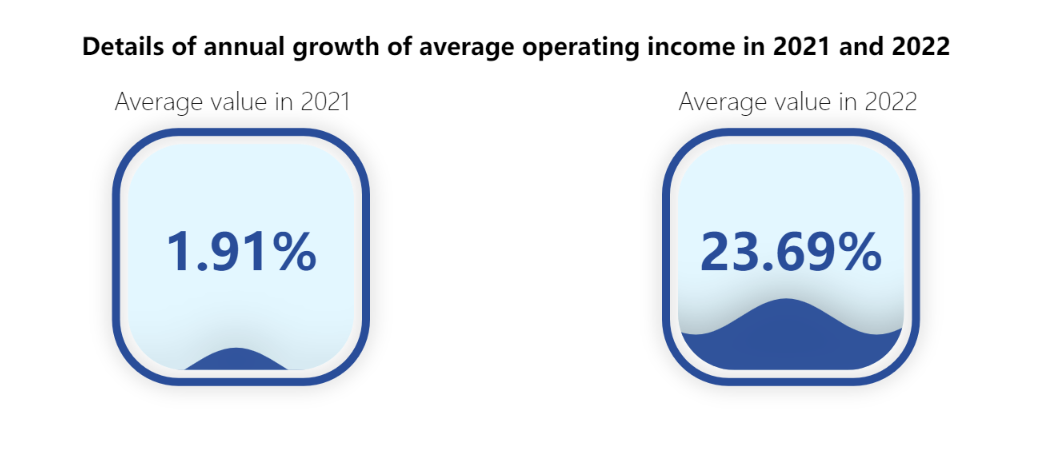
-
2021年的企业平均营业收入增长率仅有1.91%
-
而2022年的企业平均营业收入增长率达到23.69%
推测出现这种情况的原因可能与疫情有关 -
2021年受到新冠疫情的影响,全球的企业营业收入年增长率较低,而在之后,疫情得到了一定的控制,经济得到了刺激增长,企业的营业收入开始增加
**毕设帮助, 选题指导, 项目分享: ** https://gitee.com/yaa-dc/warehouse-1/blob/master/python/README.md


 1859
1859


 被折叠的 条评论
为什么被折叠?
被折叠的 条评论
为什么被折叠?
 到【灌水乐园】发言


