


介绍
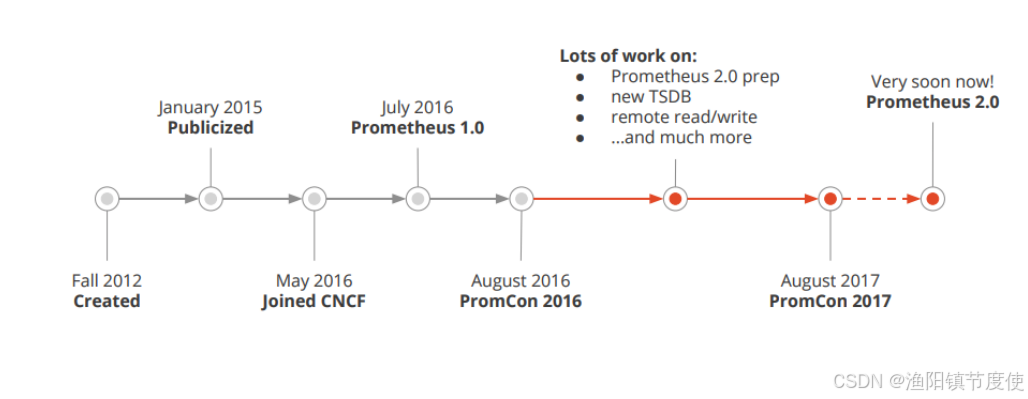
prometheus受启发于Google的Brogmon监控系统(相似kubernetes是从Brog系统演变而来)。 2016年5月继kubernetes之后成为第二个加入CNCF基金会的项目,同年6月正式发布1.0版本。2017年底发布基于全新存储层的2.0版本,能更好地与容器平台、云平台配合。官方网站:https://prometheus.io项目托管:https://github.com/prometheus
优势
prometheus是基于一个开源的完整监控方案,其对传统监控系统的测试和告警模型进行了彻底的颠覆,形成了基于中央化的规则计算、统一分析和告警的新模型。 相对传统的监控系统有如下几个优点。
- 易于管理: 部署使用的是go编译的二进制文件,不存在任何第三方依赖问题,可以使用服务发现动态管理监控目标。
- 监控服务内部运行状态: 我们可以使用prometheus提供的常用开发语言提供的client库完成应用层面暴露数据, 采集应用内部运行信息。
- 强大的查询语言promQL: prometheus内置一个强大的数据查询语言PromQL,通过PromQL可以实现对监控数据的查询、聚合。同时PromQL也被应用于数据可视化(如grafana)以及告警中的。
- 高效: 对于监控系统而言,大量的监控任务必然导致有大量的数据产生。 而Prometheus可以高效地处理这些数据。
- 可扩展: prometheus配置比较简单, 可以在每个数据中心运行独立的prometheus server, 也可以使用联邦集群,让多个prometheus实例产生一个逻辑集群,还可以在单个prometheus server处理的任务量过大的时候,通过使用功能分区和联邦集群对其扩展。
- 易于集成: 目前官方提供多种语言的客户端sdk,基于这些sdk可以快速让应用程序纳入到监控系统中,同时还可以支持与其他的监控系统集成。
- 可视化: prometheus server自带一个ui, 通过这个ui可以方便对数据进行查询和图形化展示,可以对接grafana可视化工具展示精美监控指标。
架构
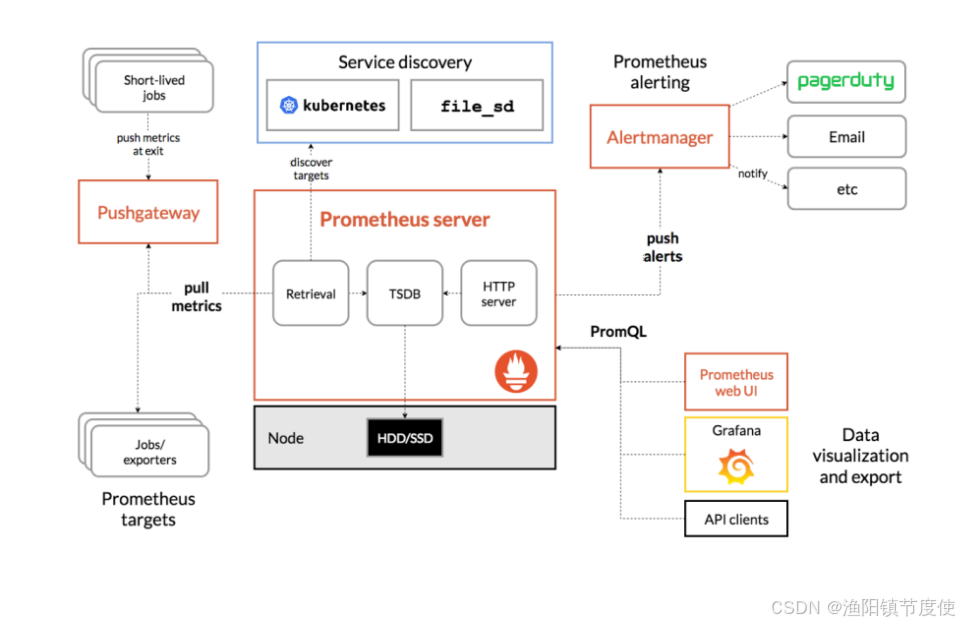
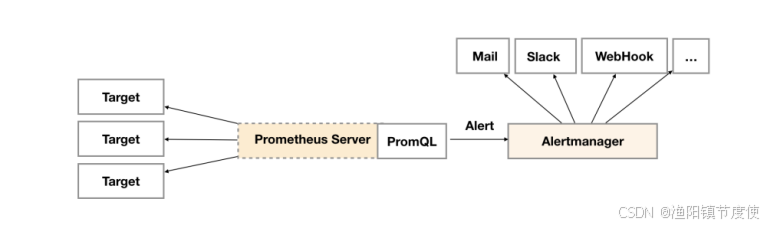
prometheus负责从pushgateway和Jobs中采集数据, 存储到后端Storatge中,可以通过PromQL进行查询, 推送alerts信息到AlertManager。 AlertManager根据不同的路由规则进行报警通知。
- prometheus server是Prometheus组件中的核心部分,负责实现对监控数据的获取,存储以及查询。
- exporter简单说是采集端,通过http服务的形式保留一个url地址,prometheus server 通过访问该exporter提供的endpoint端点,即可获取到需要采集的监控数据。exporter分为2大类。
- 直接采集:这一类exporter直接内置了对Prometheus监控的支持,比如cAdvisor,Kubernetes等。
- 间接采集: 原有监控目标不支持prometheus,需要通过prometheus提供的客户端库编写监控采集程序,例如Mysql Exporter, JMX Exporter等。
- AlertManager ,在prometheus中,支持基于PromQL创建告警规则,如果满足定义的规则,则会产生一条告警信息,进入AlertManager进行处理。可以集成邮件,Slack或者通过webhook自定义报警。
- PushGateway 由于Prometheus数据采集采用pull方式进行设置的, 内置必须保证prometheus server 和对应的exporter必须通信,当网络情况无法直接满足时,可以使用pushgateway来进行中转,可以通过pushgateway将内部网络数据主动push到gateway里面去,而prometheus采用pull方式拉取pushgateway中数据。
- web ui Prometheus内置一个简单的Web控制台,可以查询指标,查看配置信息或者Service Discovery等,实际工作中,查看指标或者创建仪表盘通常使用Grafana,Prometheus作为Grafana的数据源
数据模型
Prometheus将所有数据存储为时间序列,具有相同度量名称以及标签属于同一个指标。每个时间序列都由度量名称和一组键值对(也称为标签)组成。
格式:

度量指标名称是api_http_requests_total, 标签为method=“POST”, handler=“/messages” 的示例如下所示:

指标类型
prometheus的指标有四种类型,分别是Counter,Gauge,Histogram,Summary。
- Counter只增不减的计数器,用于描述某个指标的累计状态,比如请求量统计,http_requests_total
- Gauge可增可减的计量器,用于描述某个指标当前的状态,比如系统内存余量,node_memory_MemFree_bytes
- Histogram直方图指标用于描述指标的分布情况,比如对于请求响应时间,总共10w个请求,小于10ms的有5w个,小于50ms的有9w个,小于100ms的有9.9w个
- Summary和直方图类似,summary也是用于描述指标分布情况,不过表现形式不同,比如还是对于请求响应时间,summary描述则是,总共10w个请求,50%小于10ms,90%小于50ms,99%小于100ms
安装
linux安装
Prometheus也是go语言开发的,所以只需要下载其二进制包进行安装即可。
前往地址:https://prometheus.io/download 下载最新版本即可。
[root@localhost prometheus]# tar -zxvf prometheus-2.37.1.linux-amd64.tar.gz
prometheus-2.37.1.linux-amd64/
prometheus-2.37.1.linux-amd64/consoles/
prometheus-2.37.1.linux-amd64/consoles/index.html.example
prometheus-2.37.1.linux-amd64/consoles/node-cpu.html
prometheus-2.37.1.linux-amd64/consoles/node-disk.html
prometheus-2.37.1.linux-amd64/consoles/node-overview.html
prometheus-2.37.1.linux-amd64/consoles/node.html
prometheus-2.37.1.linux-amd64/consoles/prometheus-overview.html
prometheus-2.37.1.linux-amd64/consoles/prometheus.html
prometheus-2.37.1.linux-amd64/console_libraries/
prometheus-2.37.1.linux-amd64/console_libraries/menu.lib
prometheus-2.37.1.linux-amd64/console_libraries/prom.lib
prometheus-2.37.1.linux-amd64/prometheus.yml
prometheus-2.37.1.linux-amd64/LICENSE
prometheus-2.37.1.linux-amd64/NOTICE
prometheus-2.37.1.linux-amd64/prometheus
prometheus-2.37.1.linux-amd64/promtool
[root@localhost prometheus]# cd prometheus-2.37.1.linux-amd64
[root@localhost prometheus-2.37.1.linux-amd64]# ll
total 206252
drwxr-xr-x. 2 3434 3434        38 Sep 12 09:04 console_libraries
drwxr-xr-x. 2 3434 3434       173 Sep 12 09:04 consoles
-rw-r--r--. 1 3434 3434     11357 Sep 12 09:04 LICENSE
-rw-r--r--. 1 3434 3434      3773 Sep 12 09:04 NOTICE
-rwxr-xr-x. 1 3434 3434 109681846 Sep 12 08:46 prometheus
-rw-r--r--. 1 3434 3434       934 Sep 12 09:04 prometheus.yml
-rwxr-xr-x. 1 3434 3434 101497637 Sep 12 08:49 promtool
[root@localhost prometheus-2.37.1.linux-amd64]# ./prometheus --help
usage: prometheus [<flags>]

The Prometheus monitoring server

Flags:
  -h, --help                     Show context-sensitive help (also try --help-long and --help-man).
      --version                  Show application version.
Prometheus 是通过一个 YAML 配置文件来进行启动的,如果我们使用二进制的方式来启动的话,可以使用下面的命令:
./prometheus --config.file=prometheus.yml
其中 prometheus.yml 文件的基本配置如下:
global:
  scrape_interval:     15s
  evaluation_interval: 15s
rule_files:
  # - "first.rules"
  # - "second.rules"
scrape_configs:
  - job_name: prometheus
    static_configs:
      - targets: ['localhost:9090']
上面这个配置文件中包含了3个模块:global、rule_files 和 scrape_configs。
- global 模块控制 Prometheus Server 的全局配置:
- scrape_interval:表示 prometheus 抓取指标数据的频率,默认是15s,我们可以覆盖这个值
- evaluation_interval:用来控制评估规则的频率,prometheus 使用规则产生新的时间序列数据或者产生警报
- rule_files:指定了报警规则所在的位置,prometheus 可以根据这个配置加载规则,用于生成新的时间序列数据或者报警信息,当前我们没有配置任何报警规则。
- scrape_configs 用于控制 prometheus 监控哪些资源。
由于 prometheus 通过 HTTP 的方式来暴露的它本身的监控数据,prometheus 也能够监控本身的健康情况。在默认的配置里有一个单独的 job,叫做 prometheus,它采集 prometheus 服务本身的时间序列数据。这个 job 包含了一个单独的、静态配置的目标:监听 localhost 上的 9090 端口。prometheus 默认会通过目标的 /metrics 路径采集 metrics。所以,默认的 job 通过 URL:http://localhost:9090/metrics 采集 metrics。收集到的时间序列包含 prometheus 服务本身的状态和性能。如果我们还有其他的资源需要监控的话,直接配置在 scrape_configs 模块下面就可以了。
[root@localhost prometheus-2.37.1.linux-amd64]# ./prometheus --config.file=prometheus.yml
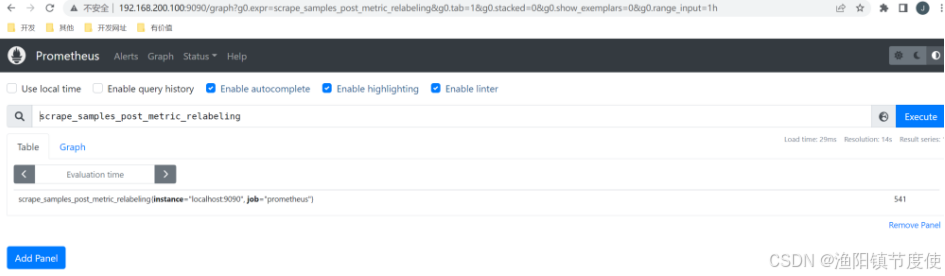
测试访问:
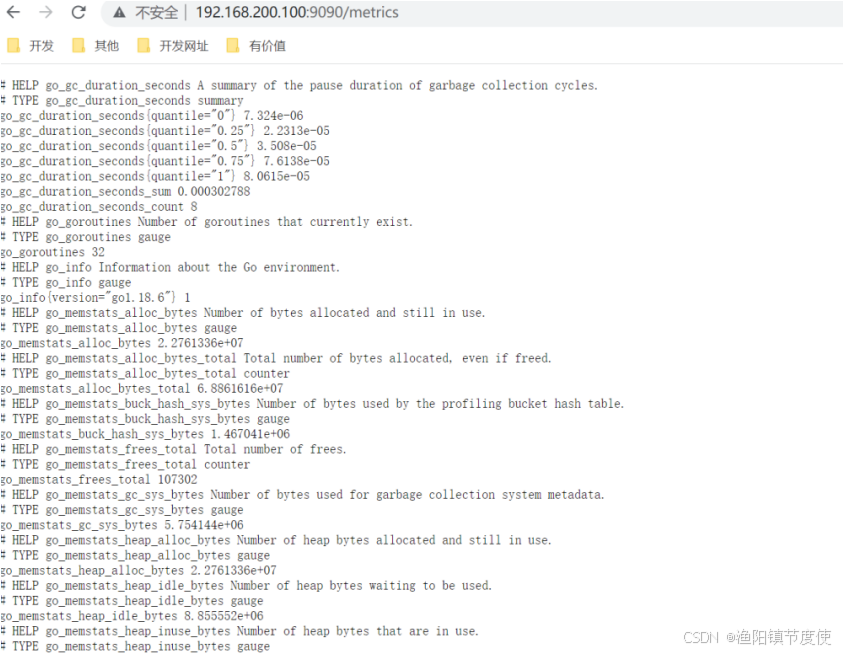
查看暴露的指标:
docker安装
对于Docker用户,直接使用Prometheus的镜像即可启动Prometheus Server:
docker run -d -p 9090:9090 -v /etc/prometheus:/etc/prometheus prom/prometheus
启动完成后,可以通过http://localhost:9090访问Prometheus的UI界面:
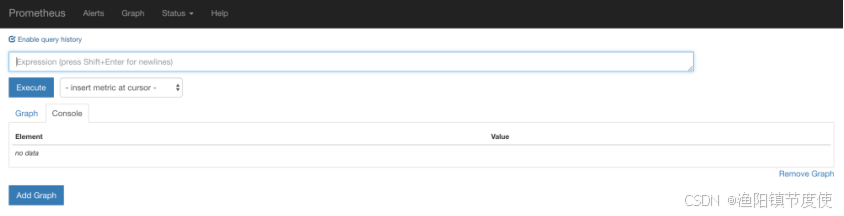
示例
Prometheus 提供了go的一个客户端示例。
D:\git\github\go> git clone https://github.com/prometheus/client_golang
D:\git\github\go\client_golang\examples\random>go env -w GOOS=linux
D:\git\github\go\client_golang\examples\random>go env -w GOARCH=amd64
D:\git\github\go\client_golang\examples\random>go build
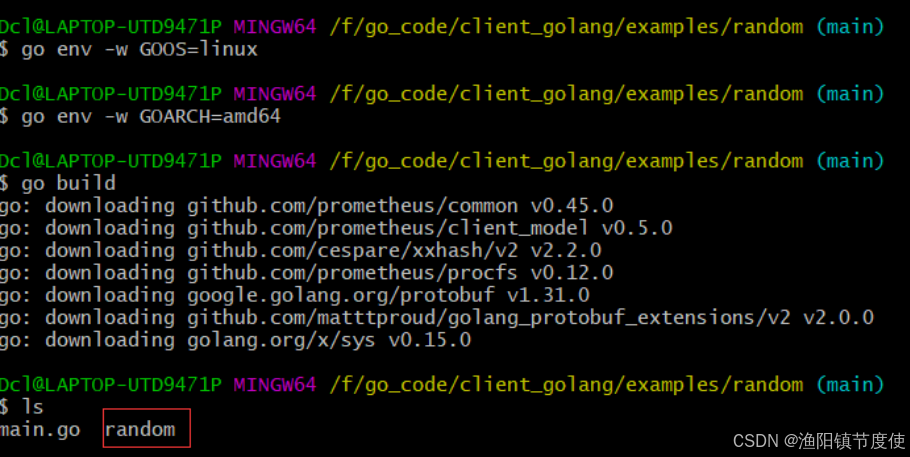
[root@localhost prometheus]# chmod +x random
[root@localhost prometheus]# ./random -listen-address=:8080
[root@localhost prometheus]# ./random -listen-address=:8081
[root@localhost prometheus]# ./random -listen-address=:8082
这个时候我们可以得到3个不同的监控接口:http://localhost:8080/metrics、http://localhost:8081/metrics 和 http://localhost:8082/metrics (这是示例代码中提供的)
// Expose the registered metrics via HTTP.
	http.Handle("/metrics", promhttp.HandlerFor(
		prometheus.DefaultGatherer,
		promhttp.HandlerOpts{
			// Opt into OpenMetrics to support exemplars.
			EnableOpenMetrics: true,
		},
	))
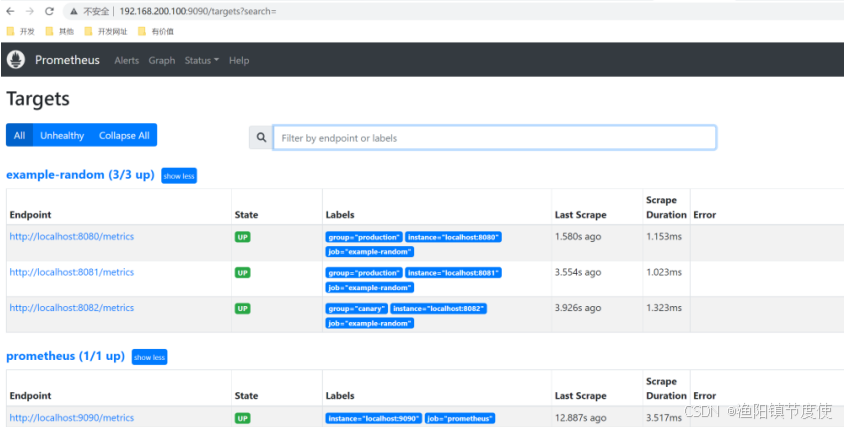
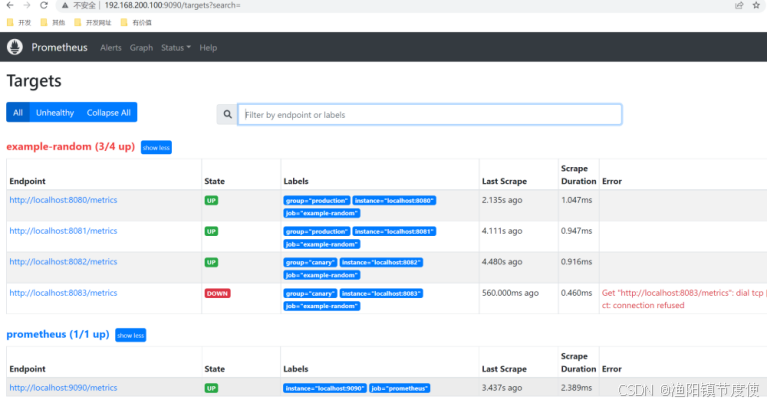
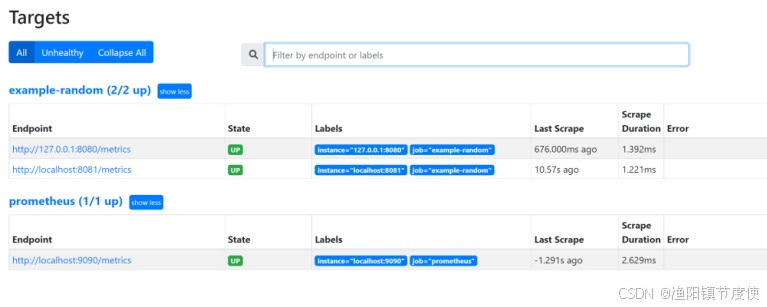
现在我们配置 Prometheus 来采集这些新的目标,让我们将这三个目标分组到一个名为 example-random 的任务。假设前两个端点(即:http://localhost:8080/metrics、http://localhost:8081/metrics )都是生产级目标应用,第三个端点(即:http://localhost:8082/metrics )为金丝雀实例。要在 Prometheus 中对此进行建模,我们可以将多组端点添加到单个任务中,为每组目标添加额外的标签。 在此示例中,我们将 group =“production” 标签添加到第一组目标,同时将 group=“canary”添加到第二组。将以下配置添加到 prometheus.yml 中的 scrape_configs 部分,然后重新启动 Prometheus 实例:
scrape_configs:
  - job_name: 'example-random'
    scrape_interval: 5s # Override the global default and scrape targets from this job every 5 seconds.
    static_configs:
      - targets: ['localhost:8080', 'localhost:8081']
        labels:
          group: 'production'
      - targets: ['localhost:8082']
        labels:
          group: 'canary'
添加配置后,重新启动
配置文件详解
# my global config
global:
  scrape_interval:     15s # Set the scrape interval to every 15 seconds. Default is every 1 minute.
  evaluation_interval: 15s # Evaluate rules every 15 seconds. The default is every 1 minute.
  # scrape_timeout is set to the global default (10s).

# Alertmanager configuration
alerting:
  alertmanagers:
  - static_configs:
    - targets:
      # - alertmanager:9093

# Load rules once and periodically evaluate them according to the global 'evaluation_interval'.
rule_files:
  # - "first_rules.yml"
  # - "second_rules.yml"

# A scrape configuration containing exactly one endpoint to scrape:
# Here it's Prometheus itself.
scrape_configs:
  # The job name is added as a label `job=<job_name>` to any timeseries scraped from this config.
  - job_name: 'prometheus'

    # metrics_path defaults to '/metrics'
    # scheme defaults to 'http'.

    static_configs:
    - targets: ['localhost:9090']
- global: 此片段指定的是prometheus的全局配置, 比如采集间隔,抓取超时时间等。
- rule_files: 此片段指定报警规则文件, prometheus根据这些规则信息,会推送报警信息到alertmanager中。
- scrape_configs: 此片段指定抓取配置,prometheus的数据采集通过此片段配置。
- alerting: 此片段指定报警配置, 这里主要是指定prometheus将报警规则推送到指定的alertmanager实例地址。
- remote_write: 指定后端的存储的写入api地址。
- remote_read: 指定后端的存储的读取api地址。
global
 # How frequently to scrape targets by default.
  [ scrape_interval: <duration> | default = 1m ]      # 抓取间隔

  # How long until a scrape request times out.
  [ scrape_timeout: <duration> | default = 10s ]     # 抓取超时时间

  # How frequently to evaluate rules.
  [ evaluation_interval: <duration> | default = 1m ]   # 评估规则间隔

  # The labels to add to any time series or alerts when communicating with
  # external systems (federation, remote storage, Alertmanager).
  external_labels:                                                  # 外部一些标签设置
    [ <labelname>: <labelvalue> ... ]
scrapy_config
一个scrape_config 片段指定一组目标和参数, 目标就是实例,指定采集的端点, 参数描述如何采集这些实例, 主要参数如下
- scrape_interval: 抓取间隔,默认继承global值。
- scrape_timeout: 抓取超时时间,默认继承global值。
- metric_path: 抓取路径, 默认是/metrics
- scheme: 指定采集使用的协议,http或者https。
- params: 指定url参数。
- basic_auth: 指定认证信息。
- *_sd_configs: 指定服务发现配置
- static_configs: 静态指定服务job。
- relabel_config: relabel设置。
普通
scrape_configs:
  # The job name is added as a label `job=<job_name>` to any timeseries scraped from this config.
  - job_name: 'prometheus'

    # metrics_path defaults to '/metrics'
    # scheme defaults to 'http'.

    static_configs:
    - targets: ['localhost:9090']
  - job_name: "node"
    static_configs:
    - targets:
      - "192.168.100.10:20001"
      - "192.168.100.11:20001
      - "192.168.100.12:20001"
file_sd_configs方式
文件形式的服务发现
scrape_configs:
  # The job name is added as a label `job=<job_name>` to any timeseries scraped from this config.
  - job_name: 'prometheus'

    # metrics_path defaults to '/metrics'
    # scheme defaults to 'http'.

    static_configs:
    - targets: ['localhost:9090']
  - job_name: "node"
    file_sd_configs:
    - refresh_interval: 10s
      files:
      - "/usr/local/prometheus/prometheus/conf/node*.yaml"

# 独立文件配置如下
cat node-dis.yaml
- targets:
  - "192.168.100.10:20001"
  labels:
    hostname: node00
- targets:
  - "192.168.100.11:20001"
  labels:
    hostname: node01
- targets:
  - "192.168.100.12:20001"
  labels:
    hostname: node02
通过file_fd_files 配置后我们可以在不重启prometheus的前提下, 修改对应的采集文件(node_dis.yml), 在特定的时间内(refresh_interval),prometheus会完成配置信息的载入工作。
修改前面的示例:
scrape_configs:
  - job_name: 'example-random'
    scrape_interval: 5s # Override the global default and scrape targets from this job every 5 seconds.
    file_sd_configs:
    - refresh_interval: 10s
      files:
      - "/mnt/prometheus/prometheus-2.37.1.linux-amd64/conf/node*.yaml"
node-random.yaml
- targets:
  - 'localhost:8080'
  - 'localhost:8081'
  labels:
    group: 'production'
- targets:
  - 'localhost:8082'
  labels:
    group: 'canary'
重新启动,正常显示
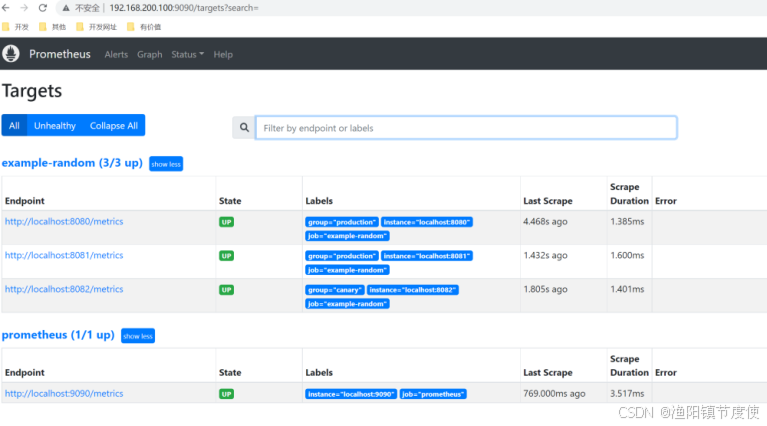
修改node-random.yaml
- targets:
  - 'localhost:8080'
  - 'localhost:8081'
  labels:
    group: 'production'
- targets:
  - 'localhost:8082'
  - 'localhost:8083'
  labels:
    group: 'canary'
不重启,等待10s
consul_sd_file
consul是一个服务发现工具。
先部署启动一个consul
[root@localhost consul]# wget https://releases.hashicorp.com/consul/1.6.1/consul_1.6.1_linux_amd64.zip
[root@localhost consul]# unzip consul_1.6.1_linux_amd64.zip
[root@localhost consul]# mv consul /usr/local/bin/
#运行测试
[root@localhost consul]# consul agent -dev
创建配置文件:
node1.json
{
  "addresses": {
                        "http": "0.0.0.0",
                        "https": "0.0.0.0"
           },
  "services": [{
                "name": "example-random",
                "tags": ["production"],
                "port": 8080
             }]

}

[root@localhost consul]# cd /etc/consul.d/
[root@localhost consul.d]# ll
total 0
[root@localhost consul.d]# vim node1.json
{
  "addresses": {
                        "http": "0.0.0.0",
                        "https": "0.0.0.0"
           },
  "services": [{
                "name": "example-random",
                "tags": ["production"],
                "port": 8080
             }]

}
运行
consul agent -dev -config-dir=/etc/consul.d
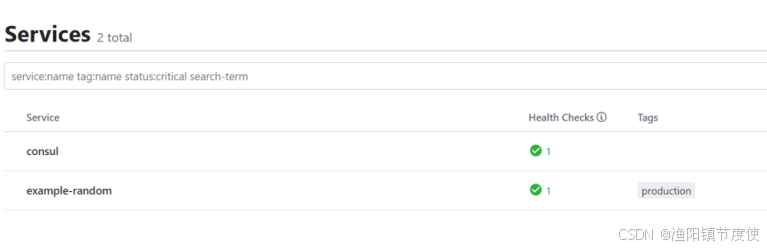
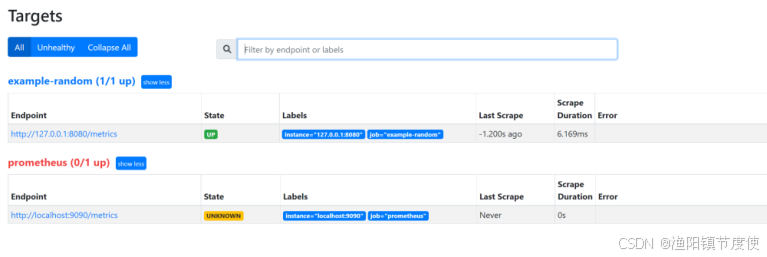
修改prometheus配置:
- job_name: "example-random"
    consul_sd_configs:
    - server: localhost:8500
      services:
      - example-random
添加一个新的节点:
node2.json
[root@localhost consul.d]# vim node2.json
{
        "Node": "node2",
        "Address": "localhost",
        "Service":
                {
                        "Port": 8081,
                        "ID": "example-random",
                        "Service": "example-random"
                }
}
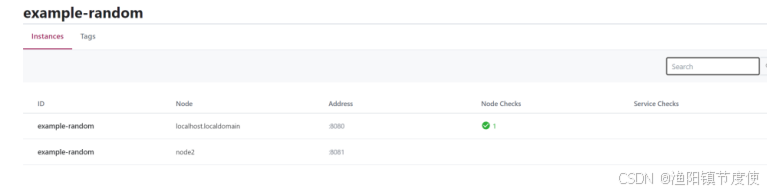
[root@localhost consul.d]# curl -XPUT -d@node2.json  127.0.0.1:8500/v1/catalog/register
true
安装Node Exporter
在Prometheus的架构设计中,Prometheus Server并不直接服务监控特定的目标,其主要任务负责数据的收集,存储并且对外提供数据查询支持。因此为了能够能够监控到某些东西,如主机的CPU使用率,我们需要使用到Exporter。Prometheus周期性的从Exporter暴露的HTTP服务地址(通常是/metrics)拉取监控样本数据。
这里为了能够采集到主机的运行指标如CPU, 内存,磁盘等信息。我们可以使用Node Exporter。
Node Exporter同样采用Golang编写,并且不存在任何的第三方依赖,只需要下载,解压即可运行。可以从https://prometheus.io/download/获取最新的node exporter版本的二进制包。
wget https://github.com/prometheus/node_exporter/releases/download/v1.7.0/node_exporter-1.7.0.linux-amd64.tar.gz
也可以使用docker安装
docker run -d -p 9100:9100 prom/node-exporter
访问http://localhost:9100/可以看到以下页面:
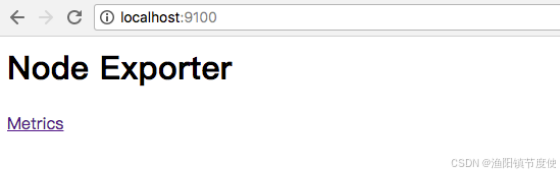
Node Exporter页面
初始Node Exporter监控指标
访问http://localhost:9100/metrics,可以看到当前node exporter获取到的当前主机的所有监控数据,如下所示
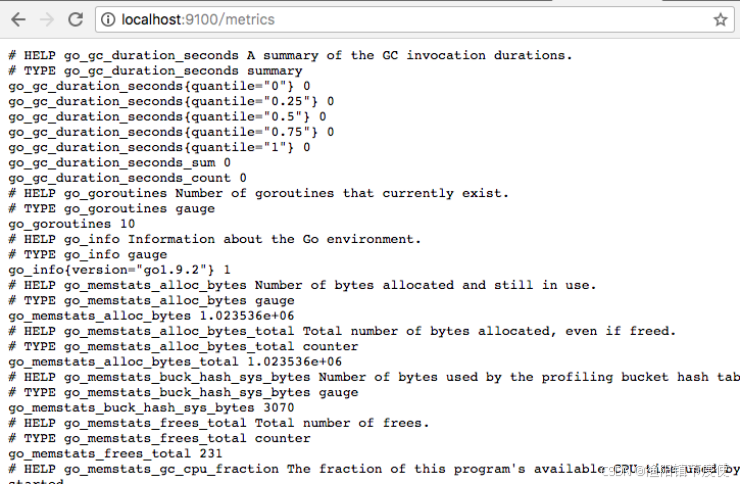
每一个监控指标之前都会有一段类似于如下形式的信息:
# HELP node_cpu Seconds the cpus spent in each mode.
# TYPE node_cpu counter
node_cpu{cpu="cpu0",mode="idle"} 362812.7890625
# HELP node_load1 1m load average.
# TYPE node_load1 gauge
node_load1 3.0703125
其中HELP用于解释当前指标的含义,TYPE则说明当前指标的数据类型。在上面的例子中node_cpu的注释表明当前指标是cpu0上idle进程占用CPU的总时间,CPU占用时间是一个只增不减的度量指标,从类型中也可以看出node_cpu的数据类型是计数器(counter),与该指标的实际含义一致。又例如node_load1该指标反映了当前主机在最近一分钟以内的负载情况,系统的负载情况会随系统资源的使用而变化,因此node_load1反映的是当前状态,数据可能增加也可能减少,从注释中可以看出当前指标类型为仪表盘(gauge),与指标反映的实际含义一致。
除了这些以外,在当前页面中根据物理主机系统的不同,你还可能看到如下监控指标:
- node_boot_time:系统启动时间
- node_cpu:系统CPU使用量
- nodedisk*:磁盘IO
- nodefilesystem*:文件系统用量
- node_load1:系统负载
- nodememeory*:内存使用量
- nodenetwork*:网络带宽
- node_time:当前系统时间
- go_*:node exporter中go相关指标
- process_*:node exporter自身进程相关运行指标
从Node Exporter收集监控数据
为了能够让Prometheus Server能够从当前node exporter获取到监控数据,这里需要修改Prometheus配置文件。编辑prometheus.yml并在scrape_configs节点下添加以下内容:
scrape_configs:
  - job_name: 'prometheus'
    static_configs:
      - targets: ['localhost:9090']
  # 采集node exporter监控数据
  - job_name: 'node'
    static_configs:
      - targets: ['localhost:9100']
重新启动Prometheus Server
访问http://localhost:9090,进入到Prometheus Server。如果输入“up”并且点击执行按钮以后,可以看到如下结果:
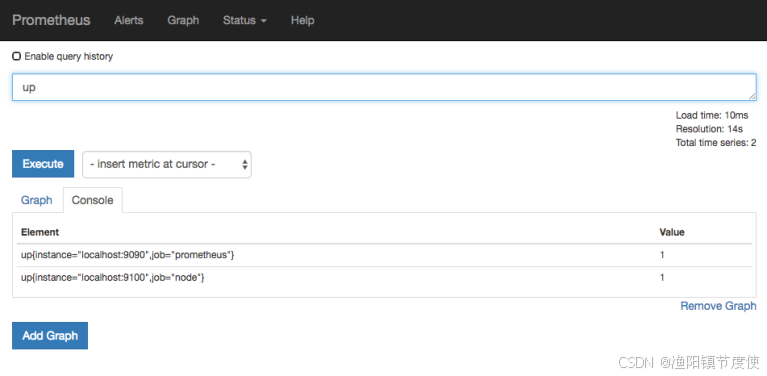
如果Prometheus能够正常从node exporter获取数据,则会看到以下结果:
up{instance="localhost:9090",job="prometheus"} 1
up{instance="localhost:9100",job="node"} 1
其中“1”表示正常,反之“0”则为异常
PromQL语法
PromQL(Prometheus Query Language)是 Prometheus 内置的数据查询语言,它能实现对事件序列数据的查询、聚合、逻辑运算等。它并且被广泛应用在 Prometheus 的日常应用当中,包括对数据查询、可视化、告警处理当中。
简单地说,PromQL 广泛存在于以 Prometheus 为核心的监控体系中。所有需要用到数据筛选的地方,就会用到 PromQL。例如:监控指标的设置、报警指标的设置等等。
基础用法
访问Prometheus ,选择Graph,在查询框中,我们输入:prometheus_http_requests_total 并点击执行。
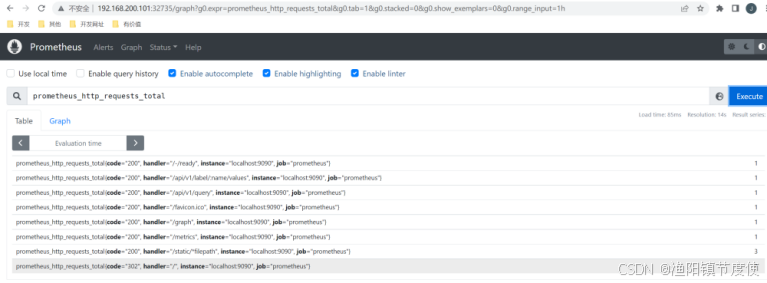
查询出了所有指标名称为 prometheus_http_requests_total 的数据。
PromQL 支持户根据时间序列的标签匹配模式来对时间序列进行过滤。
时间序列
# HELP node_cpu_seconds_total Seconds the cpus spent in each mode.
# TYPE node_cpu_seconds_total counter
node_cpu_seconds_total{cpu="0",mode="idle"} 6.62885731e+06
# HELP node_load1 1m load average.
# TYPE node_load1 gauge
node_load1 2.29
node_cpu_seconds_total 和 node_load1 表明了当前指标的名称、大括号中的标签则反映了当前样本的一些特征和维度、浮点数则是该监控样本的具体值。
Prometheus 会将所有采集到的样本数据以时间序列的方式保存在内存数据库中,并且定时保存到硬盘上。时间序列是按照时间戳和值的序列顺序存放的,我们称之为向量(vector),每条时间序列通过指标名称(metrics name)和一组标签集(labelset)命名。
在时间序列中的每一个点称为一个样本(sample),样本由以下三部分组成:
- 指标(metric):metric name 和描述当前样本特征的 labelsets
- 时间戳(timestamp):一个精确到毫秒的时间戳
- 样本值(value): 一个 float64 的浮点型数据表示当前样本的值
<--------------- metric ---------------------><-timestamp -><-value->
http_request_total{status="200", method="GET"}@1434417560938 => 94355
http_request_total{status="200", method="GET"}@1434417561287 => 94334

http_request_total{status="404", method="GET"}@1434417560938 => 38473
http_request_total{status="404", method="GET"}@1434417561287 => 38544

http_request_total{status="200", method="POST"}@1434417560938 => 4748
http_request_total{status="200", method="POST"}@1434417561287 => 4785
在形式上,所有的指标(Metric)都通过如下格式表示:
<metric name>{<label name> = <label value>, ...}
- 指标的名称(metric name)可以反映被监控样本的含义(比如,http_request_total - 表示当前系统接收到的 HTTP 请求总量)。指标名称只能由 ASCII 字符、数字、下划线以及冒号组成并必须符合正则表达式[a-zA-Z_:][a-zA-Z0-9_:]*。
- 标签(label)反映了当前样本的特征维度,通过这些维度 Prometheus 可以对样本数据进行过滤,聚合等。标签的名称只能由 ASCII 字符、数字以及下划线组成并满足正则表达式 [a-zA-Z_][a-zA-Z0-9_]*。
每个不同的 metric_name和 label 组合都称为时间序列,在 Prometheus 的表达式语言中,表达式或子表达式包括以下四种类型之一:
- 瞬时向量(Instant vector):一组时间序列,每个时间序列包含单个样本,它们共享相同的时间戳。也就是说,表达式的返回值中只会包含该时间序列中的最新的一个样本值。而相应的这样的表达式称之为瞬时向量表达式。
- 区间向量(Range vector):一组时间序列,每个时间序列包含一段时间范围内的样本数据,这些是通过将时间选择器附加到方括号中的瞬时向量(例如[5m]5分钟)而生成的。
- 标量(Scalar):一个简单的数字浮点值。
- 字符串(String):一个简单的字符串值。
所有这些指标都是 Prometheus 定期从 metrics 接口那里采集过来的。采集的间隔时间的设置由 prometheus.yaml 配置中的 scrape_interval 指定。最多抓取间隔为30秒,这意味着至少每30秒就会有一个带有新时间戳记录的新数据点,这个值可能会更改,也可能不会更改,但是每隔 scrape_interval 都会产生一个新的数据点。
指标类型
在 Node Exporter 返回的样本中指标 node_load1 反应的是当前系统的负载状态,随着时间的变化这个指标返回的样本数据是在不断变化的。而指标 node_cpu_seconds_total 所获取到的样本数据却不同,它是一个持续增大的值,因为其反应的是 CPU 的累计使用时间,从理论上讲只要系统不关机,这个值是会一直变大。
为了能够帮助用户理解和区分这些不同监控指标之间的差异,Prometheus 定义了4种不同的指标类型:Counter(计数器)、Gauge(仪表盘)、Histogram(直方图)、Summary(摘要)。
Counter
Counter 计数器,只增不减。
Counter 是一个简单但又强大的工具,例如我们可以在应用程序中记录某些事件发生的次数,通过以时间序列的形式存储这些数据,我们可以轻松的了解该事件产生的速率变化。PromQL 内置的聚合操作和函数可以让用户对这些数据进行进一步的分析,例如,通过 rate() 函数获取 HTTP 请求量的增长率:
rate(http_requests_total[5m])
查询当前系统中,访问量前 10 的 HTTP 请求:
topk(10, http_requests_total)
Gauge
Gauge(仪表盘)类型的指标侧重于反应系统的当前状态。因此这类指标的样本数据可增可减。
常见指标如:node_memory_MemFree_bytes(主机当前空闲的内存大小)、node_memory_MemAvailable_bytes(可用内存大小)都是 Gauge 类型的监控指标。
对于 Gauge 类型的监控指标,通过 PromQL 内置函数 delta() 可以获取样本在一段时间范围内的变化情况。例如,计算 CPU 温度在两个小时内的差异:
delta(cpu_temp_celsius{host="zeus"}[2h])
还可以直接使用 predict_linear() 对数据的变化趋势进行预测。例如,预测系统磁盘空间在4个小时之后的剩余情况:
predict_linear(node_filesystem_free_bytes[1h], 4 * 3600)
Histogram 和 Summary
Histogram 和 Summary 主用用于统计和分析样本的分布情况。
在大多数情况下人们都倾向于使用某些量化指标的平均值,例如 CPU 的平均使用率、页面的平均响应时间,这种方式也有很明显的问题,以系统 API 调用的平均响应时间为例:如果大多数 API 请求都维持在 100ms 的响应时间范围内,而个别请求的响应时间需要 5s,那么就会导致某些 WEB 页面的响应时间落到中位数上,而这种现象被称为长尾问题。
为了区分是平均的慢还是长尾的慢,最简单的方式就是按照请求延迟的范围进行分组。例如,统计延迟在 0~10ms 之间的请求数有多少而 10~20ms 之间的请求数又有多少。通过这种方式可以快速分析系统慢的原因。Histogram 和 Summary 都是为了能够解决这样的问题存在的,通过 Histogram 和Summary 类型的监控指标,我们可以快速了解监控样本的分布情况。
例如,指标 prometheus_tsdb_wal_fsync_duration_seconds 的指标类型为 Summary。它记录了 Prometheus Server 中 wal_fsync 的处理时间,通过访问 Prometheus Server 的 /metrics 地址,可以获取到以下监控样本数据:
# HELP prometheus_tsdb_wal_fsync_duration_seconds Duration of WAL fsync.
# TYPE prometheus_tsdb_wal_fsync_duration_seconds summary
prometheus_tsdb_wal_fsync_duration_seconds{quantile="0.5"} 0.012352463
prometheus_tsdb_wal_fsync_duration_seconds{quantile="0.9"} 0.014458005
prometheus_tsdb_wal_fsync_duration_seconds{quantile="0.99"} 0.017316173
prometheus_tsdb_wal_fsync_duration_seconds_sum 2.888716127000002
prometheus_tsdb_wal_fsync_duration_seconds_count 216
从上面的样本中可以得知当前 Prometheus Server 进行 wal_fsync 操作的总次数为216次,耗时2.888716127000002s。其中中位数(quantile=0.5)的耗时为0.012352463,9分位数(quantile=0.9)的耗时为0.014458005s。
在 Prometheus Server 自身返回的样本数据中,我们还能找到类型为 Histogram 的监控指标prometheus_tsdb_compaction_chunk_range_seconds_bucket:
# HELP prometheus_tsdb_compaction_chunk_range_seconds Final time range of chunks on their first compaction
# TYPE prometheus_tsdb_compaction_chunk_range_seconds histogram
prometheus_tsdb_compaction_chunk_range_seconds_bucket{le="100"} 71
prometheus_tsdb_compaction_chunk_range_seconds_bucket{le="400"} 71
prometheus_tsdb_compaction_chunk_range_seconds_bucket{le="1600"} 71
prometheus_tsdb_compaction_chunk_range_seconds_bucket{le="6400"} 71
prometheus_tsdb_compaction_chunk_range_seconds_bucket{le="25600"} 405
prometheus_tsdb_compaction_chunk_range_seconds_bucket{le="102400"} 25690
prometheus_tsdb_compaction_chunk_range_seconds_bucket{le="409600"} 71863
prometheus_tsdb_compaction_chunk_range_seconds_bucket{le="1.6384e+06"} 115928
prometheus_tsdb_compaction_chunk_range_seconds_bucket{le="6.5536e+06"} 2.5687892e+07
prometheus_tsdb_compaction_chunk_range_seconds_bucket{le="2.62144e+07"} 2.5687896e+07
prometheus_tsdb_compaction_chunk_range_seconds_bucket{le="+Inf"} 2.5687896e+07
prometheus_tsdb_compaction_chunk_range_seconds_sum 4.7728699529576e+13
prometheus_tsdb_compaction_chunk_range_seconds_count 2.5687896e+07
与 Summary 类型的指标相似之处在于 Histogram 类型的样本同样会反应当前指标的记录的总数(以 _count 作为后缀)以及其值的总量(以 _sum 作为后缀)。不同在于 Histogram 指标直接反应了在不同区间内样本的个数,区间通过标签 le 进行定义。
完全匹配
PromQL 支持户根据时间序列的标签匹配模式来对时间序列进行过滤,目前主要支持两种匹配模式:完全匹配和正则匹配。
PromQL 支持使用 = 和 != 两种完全匹配模式。
- 等于。通过使用 label=value 可以选择那些标签满足表达式定义的时间序列。
- 不等于。通过使用 label!=value 则可以根据标签匹配排除时间序列。
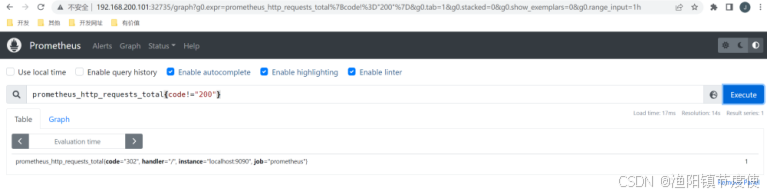
上面查询出了所有指标名称为 prometheus_http_requests_total 的数据。这时候我们希望只查看错误的请求,即过滤掉所有 code 标签不是 200 的数据。那么我们的 PromQL 表达式可以修改为:
prometheus_http_requests_total{code!="200"}
正则匹配
PromQL 还可以使用正则表达式作为匹配条件,并且可以使用多个匹配条件。
- 正向匹配。使用 label=~regx 表示选择那些标签符合正则表达式定义的时间序列。
- 反向匹配。使用 label!~regx 进行排除。
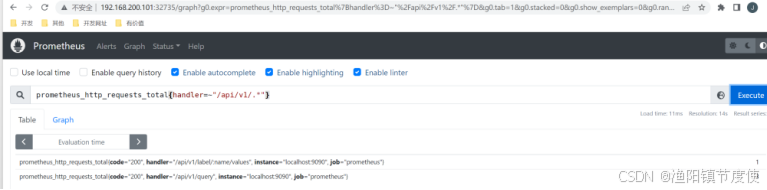
例如想查询指标 prometheus_http_requests_total 中,所有 handler 标签以 /api/v1 开头的记录,那么我的表达式为:
prometheus_http_requests_total{handler=~"/api/v1/.*"}
范围查询
上面直接通过类似 prometheus_http_requests_total 表达式查询时间序列时,同一个指标同一标签只会返回一条数据。这样的表达式我们称之为瞬间向量表达式,而返回的结果称之为瞬间向量。
如果我们想查询一段时间范围内的样本数据,那么我们就需要用到区间向量表达式,其查询出来的结果称之为区间向量。时间范围通过时间范围选择器 [] 进行定义。例如,通过以下表达式可以选择最近5分钟内的所有样本数据:
prometheus_http_requests_total{}[5m]
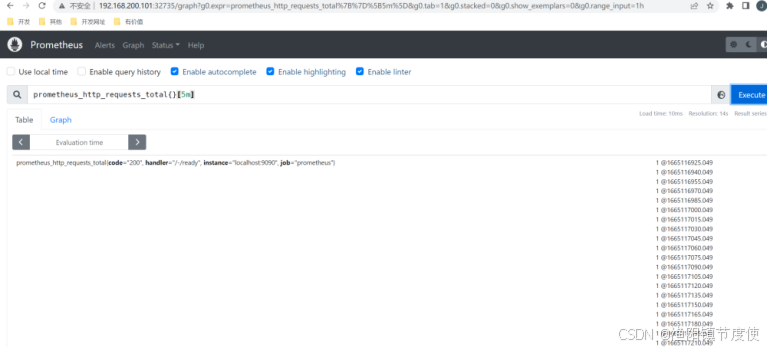
此时我们查询出了所有的样本数据,而不再是一个样本数据的统计值。
除了使用m表示分钟以外,PromQL的时间范围选择器支持其它时间单位:
- s - 秒
- m - 分钟
- h - 小时
- d - 天
- w - 周
- y - 年
时间位移操作
在瞬时向量表达式或者区间向量表达式中,都是以当前时间为基准:
# 瞬时向量表达式,选择当前最新的数据
prometheus_http_requests_total{}
# 区间向量表达式,选择以当前时间为基准,5分钟内的数据
prometheus_http_requests_total{}[5m]
如果想查询 5 分钟前的瞬时样本数据,或昨天一天的区间内的样本数据呢? 这个时候就可以使用位移操作,位移操作的关键字为 offset。
# 查询 5 分钟前的最新数据
prometheus_http_requests_total{} offset 5m
# 往前移动 1 天,查询 1 天前的数据
prometheus_http_requests_total{}[1d] offset 1d
聚合操作
一般情况下,我们通过 PromQL 查询到的数据都是很多的。PromQL 提供的聚合操作可以用来对这些时间序列进行处理,形成一条新的时间序列。
以 prometheus_http_requests_total 指标为例,不加任何条件我们查询到的数据为:
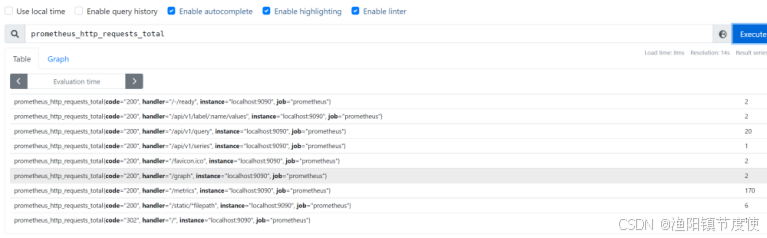
从上图查询结果可以知道,一共有 9 条数据,这 9 条数据的 value 总和为 206。那么我们使用下面两个聚合操作表达式来查询,看看结果对不对。
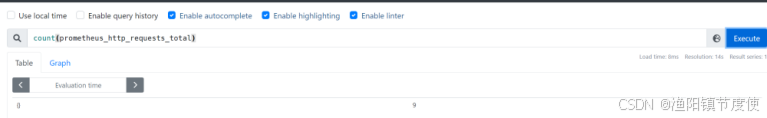
第一个表达式,计算一共有几条数据:
count(prometheus_http_requests_total)
第二个表达式,计算所有数据的 value 总和:
sum(prometheus_http_requests_total)
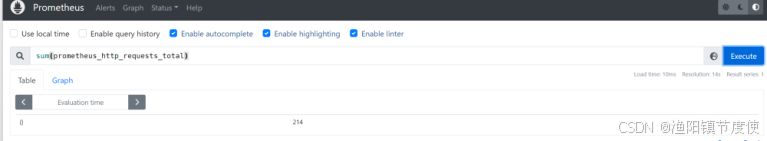
count 的数值是一致的,但是 sum 的数值有误差,这是因为我们两次查询的时间间隔内,某些记录的数值发生了变化。
标量
在 PromQL 中,标量是一个浮点型的数字值,没有时序。例如:10。
需要注意的是,当使用表达式count(http_requests_total),返回的数据类型,依然是瞬时向量。用户可以通过内置函数scalar()将单个瞬时向量转换为标量
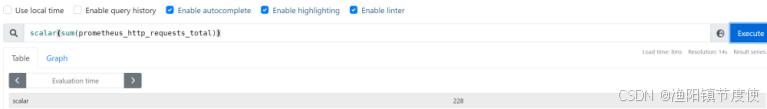
将 sum 操作的值用 scalar 转换了一下,最终的结果就是一个标量了
字符串
在 PromQL 中,字符串是一个简单的字符串值。直接使用字符串作为 PromQL 表达式,则会直接返回字符串。

PromQL 操作符
PromQL 还支持丰富的操作符,用户可以使用这些操作符对进一步的对事件序列进行二次加工。这些操作符包括:数学运算符,逻辑运算符,布尔运算符等等。
数学运算符
数学运算符比较简单,就是简单的加减乘除等。
例如通过 prometheus_http_response_size_bytes_sum 可以查询到 Prometheus 这个应用的 HTTP 响应字节总和。但是这个单位是字节,我们希望用 MB 显示。那么我们可以这么设置:
prometheus_http_response_size_bytes_sum/8/1024
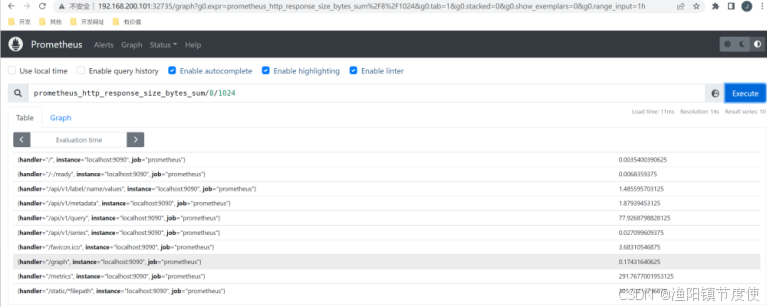
最终显示的数据就是以 MB 作为单位的数值。
PromQL支持的所有数学运算符如下所示:
-
+ (加法) -
-(减法) -
* (乘法) -
/ (除法) -
% (求余) -
^ (幂运算)
布尔运算符
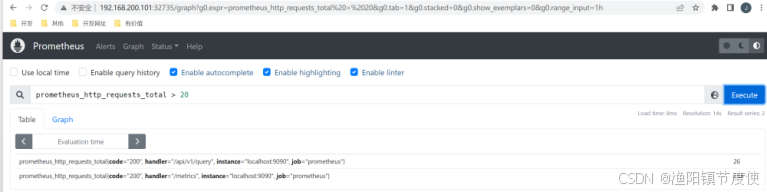
布尔运算符支持用户根据时间序列中样本的值,对时间序列进行过滤。例如我们可以通过 prometheus_http_requests_total 查询出每个接口的请求次数,但是如果我们想筛选出请求次数超过 20 次的接口呢?
此时可以用下面的 PromQL 表达式:
prometheus_http_requests_total > 20
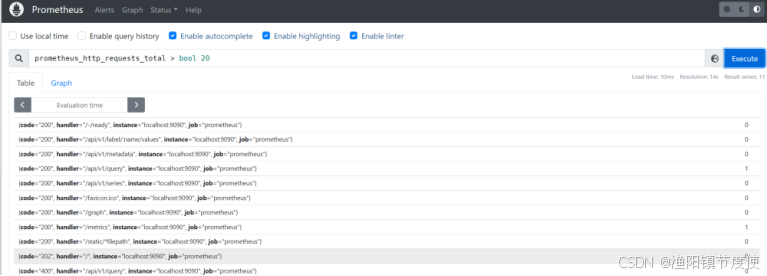
从上面的图中我们可以看到,value 的值还是具体的数值。但如果我们希望对符合条件的数据,value 变为 1。不符合条件的数据,value 变为 0。那么我们可以使用bool修饰符。
使用下面的 PromQL 表达式:
prometheus_http_requests_total > bool 20
从下面的执行结果可以看到,这时候并不过滤掉数据,而是将 value 的值变成了 1 或 0。
目前,Prometheus支持以下布尔运算符如下:
-
== (相等) -
!= (不相等) -
> (大于) -
< (小于) -
>= (大于等于) -
<= (小于等于)
集合运算符
通过集合运算,可以在两个瞬时向量与瞬时向量之间进行相应的集合操作。目前,Prometheus支持以下集合运算符:
- and 与操作
- or 或操作
- unless 排除操作
and 与操作
vector1 and vector2 进行一个与操作,会产生一个新的集合。该集合中的元素同时在 vector1 和 vector2 中都存在。
例如我们有 vector1 为 A B C,vector2 为 B C D,那么 vector1 and vector2 的结果为:B C。
or 或操作
vector1 and vector2 进行一个或操作,会产生一个新的集合。该集合中包含 vector1 和 vector2 中的所有元素。
例如我们有 vector1 为 A B C,vector2 为 B C D,那么 vector1 or vector2 的结果为:A B C D。
unless 排除操作
vector1 and vector2 进行一个或操作,会产生一个新的集合。该集合首先取 vector1 集合的所有元素,然后排除掉所有在 vector2 中存在的元素。
例如我们有 vector1 为 A B C,vector2 为 B C D,那么 vector1 unless vector2 的结果为:A。
操作符优先级
在PromQL操作符中优先级由高到低依次为:
- ^
- *, /, %
- +, -
- ==, !=, <=, <, >=, >
- and, unless
- or
聚合操作
Prometheus 还提供了聚合操作符,这些操作符作用于瞬时向量。可以将瞬时表达式返回的样本数据进行聚合,形成一个新的时间序列。目前支持的聚合函数有:
- sum (求和)
- min (最小值)
- max (最大值)
- avg (平均值)
- stddev (标准差)
- stdvar (标准方差)
- count (计数)
- count_values (对value进行计数)
- bottomk (后n条时序)
- topk (前n条时序)
- quantile (分位数)
sum 求和
用于对记录的 value 值进行求和。
例如:sum(prometheus_http_requests_total) 表示统计所有 HTTP 请求的次数。
min 最小值
返回所有记录的最小值。
当执行如下 PromQL 时,会筛选出最小的记录值。
min(prometheus_http_requests_total)
max 最大值
返回所有记录的最大值。
当执行如下 PromQL 时,会筛选出最大的记录值。
max(prometheus_http_requests_total)
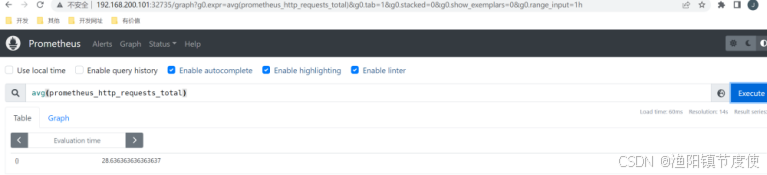
avg 平均值
avg 函数返回所有记录的平均值。
当执行如下 PromQL 时,会筛选出平均值。
avg(prometheus_http_requests_total)
stddev 标准差
标准差(Standard Deviation)常用来描述数据的波动大小。例如统计篮球队员身高:

两支队伍平均身高都是 180,看起来似乎差不多。但如果画图的话,得到结果如下:
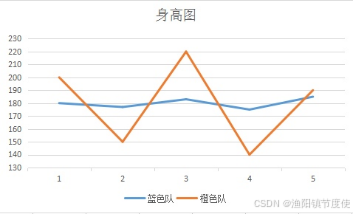
很显然,蓝色队队员身高更加整齐一些,橙色队身高显得参差不齐。为了反映一组数据,偏离平均值的程度,就有了「标准差 」这个概念。
如果数据量很大,比如几万人的身高,我们不容易从折线图看出来,可以直接用公式计算。上图的数据标准差计算结果为:

很明显,橙色队的标准差比蓝色队标准差大很多。这说明橙色队的身高波动更大。
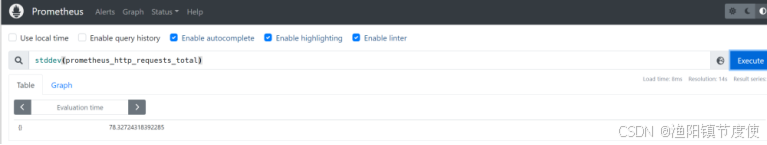
当执行如下 PromQL 时,会计算出不同 HTTP 请求的数量波动情况。
stddev(prometheus_http_requests_total)
count 计数
count 函数返回所有记录的计数。
例如:count(prometheus_http_requests_total) 表示统计所有 HTTP 请求的次数。
bottomk 后几条
bottomk 用于对样本值进行排序,返回当前样本值后 N 位的时间序列。
例如获取 HTTP 请求量后 5 位的请求,可以使用表达式:
bottomk(5, prometheus_http_requests_total)
topk 前几条
topk 用于对样本值进行排序,返回当前样本值前 N 位的时间序列。
例如获取 HTTP 请求量前 5 位的请求,可以使用表达式:
topk(5, prometheus_http_requests_total)
PromQL 内置函数
PromQL 提供了大量的内置函数,可以对时序数据进行丰富的处理。例如 irate() 函数可以帮助计算监控指标的增长率,不需要去手动计算。
rate 增长率
counter 类型指标的特点是只增不减,在没有发生重置的情况下,其样本值是不断增大的。为了能直观地观察期变化情况,需要计算样本的增长率。increase(v range-vector) 函数是 PromQL 中提供的众多内置函数之一。其中参数 v 是一个区间向量,increase 函数获取区间向量中的第一个和最后一个样本并返回其增长量。因此,可以通过以下表达式Counter类型指标的增长率:
increase(node_cpu[2m]) / 120
这里通过node_cpu[2m]获取时间序列最近两分钟的所有样本,increase计算出最近两分钟的增长量,最后除以时间120秒得到node_cpu样本在最近两分钟的平均增长率。并且这个值也近似于主机节点最近两分钟内的平均CPU使用率。
除了使用increase函数以外,PromQL中还直接内置了rate(v range-vector)函数,rate函数可以直接计算区间向量v在时间窗口内平均增长速率。因此,通过以下表达式可以得到与increase函数相同的结果:
rate(node_cpu[2m])
需要注意的是使用rate或者increase函数去计算样本的平均增长速率,容易陷入「长尾问题」当中,其无法反应在时间窗口内样本数据的突发变化。
例如,对于主机而言在 2 分钟的时间窗口内,可能在某一个由于访问量或者其它问题导致 CPU 占用 100% 的情况,但是通过计算在时间窗口内的平均增长率却无法反应出该问题。
为了解决该问题,PromQL提供了另外一个灵敏度更高的函数 irate(v range-vector)。irate 同样用于计算区间向量的增长速率,但是其反应出的是瞬时增长率。irate 函数是通过区间向量中最后两个样本数据来计算区间向量的增长速率。
这种方式可以避免在时间窗口范围内的「长尾问题」,并且体现出更好的灵敏度,通过 irate 函数绘制的图标能够更好的反应样本数据的瞬时变化状态。
irate(node_cpu[2m])
irate函数相比于rate函数提供了更高的灵敏度,不过当需要分析长期趋势或者在告警规则中,irate的这种灵敏度反而容易造成干扰。因此在长期趋势分析或者告警中更推荐使用rate函数。
predict_linear 增长预测
在一般情况下,系统管理员为了确保业务的持续可用运行,会针对服务器的资源设置相应的告警阈值。例如,当磁盘空间只剩512MB时向相关人员发送告警通知。 这种基于阈值的告警模式对于当资源用量是平滑增长的情况下是能够有效的工作的。
但是如果资源不是平滑变化的呢? 比如有些某些业务增长,存储空间的增长速率提升了高几倍。这时,如果基于原有阈值去触发告警,当系统管理员接收到告警以后可能还没来得及去处理问题,系统就已经不可用了。
因此阈值通常来说不是固定的,需要定期进行调整才能保证该告警阈值能够发挥去作用。 那么还有没有更好的方法吗?
PromQL 中内置的 predict_linear(v range-vector, t scalar) 函数可以帮助系统管理员更好的处理此类情况,predict_linear 函数可以预测时间序列v在t秒后的值。
它基于简单线性回归的方式,对时间窗口内的样本数据进行统计,从而可以对时间序列的变化趋势做出预测。例如,基于2小时的样本数据,来预测主机可用磁盘空间的是否在4个小时候被占满,可以使用如下表达式:
predict_linear(node_filesystem_free{job="node"}[2h], 4 * 3600) < 0
Grafana监控数据可视化
Grafana 是一个可视化面板,有着非常漂亮的图表和布局展示,功能齐全的度量仪表盘和图形编辑器,支持 Graphite、zabbix、InfluxDB、Prometheus、OpenTSDB、Elasticsearch 等作为数据源,比 Prometheus 自带的图表展示功能强大太多,更加灵活,有丰富的插件,功能更加强大。
docker安装Grafana
docker run -d -p 3000:3000 grafana/grafana

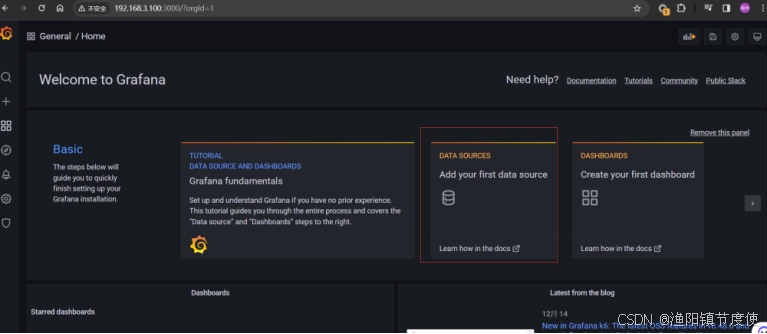
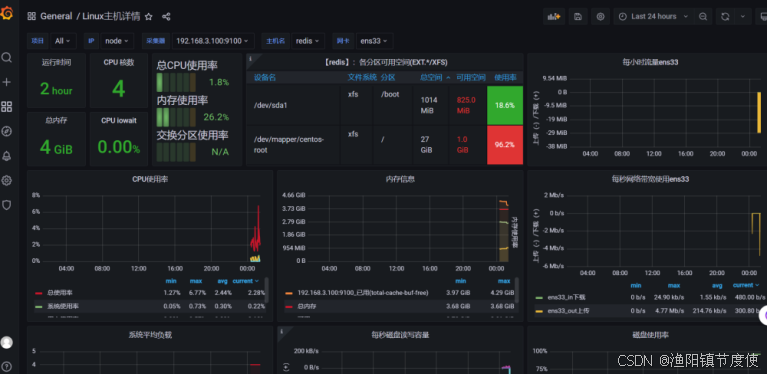
访问http://192.168.3.100:3000/就可以进入到Grafana的界面中,默认情况下使用账户admin/admin进行登录。在Grafana首页中显示默认的使用向导,包括:安装、添加数据源、创建Dashboard、邀请成员、以及安装应用和插件等主要流程:
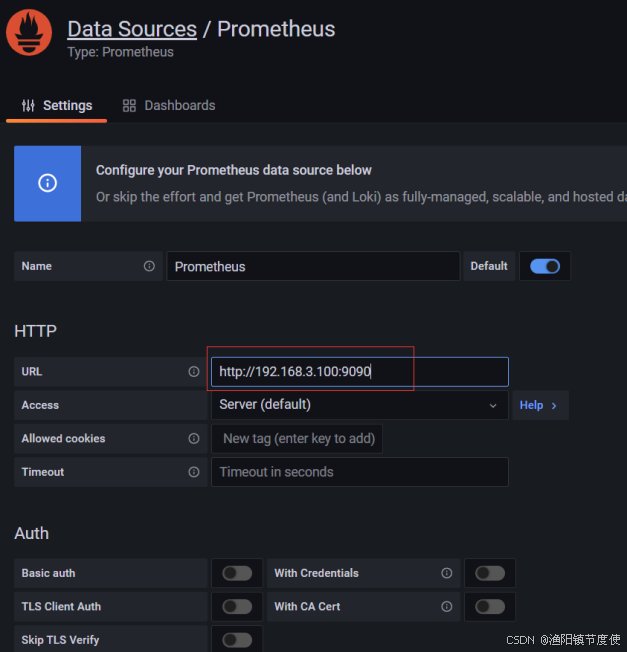
这里将添加Prometheus作为默认的数据源,如下图所示,指定数据源类型为Prometheus并且设置Prometheus的访问地址即可。
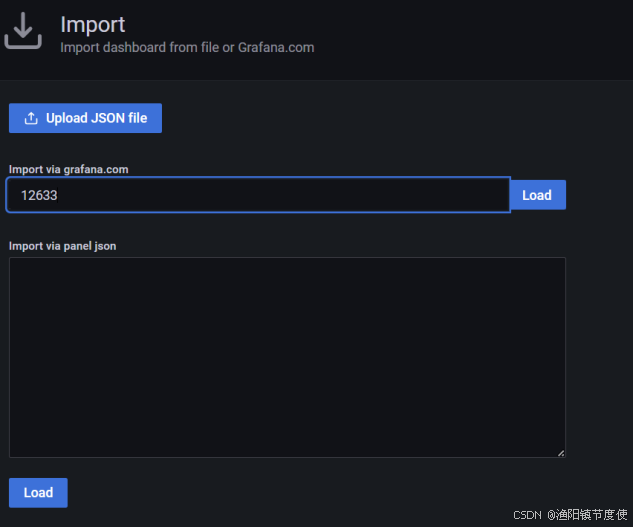
Dashboard 模板配置
Grafana官网 - Dashboards 模块 提供了下载 Dashboard 模板的功能。
Dashboards 里有许多各种类型的 Dashboard 面板,例如 JVM 监控、MySQL 数据库监控等。

只需找到合适自己的监控面板,之后根据 ID 添加或者下载JSON导入即可。
Spring Boot应用整合Prometheus
Spring Boot Actuator提供了一组用于监控和管理Spring Boot应用程序的端点,而Prometheus是一个开源的监控和告警工具。通过将这两者结合起来,您可以实时监控您的应用程序的性能指标,并通过Prometheus提供的丰富的查询语言来分析和可视化这些指标。
Spring Boot应用整合Prometheus
步骤1:添加依赖
首先,您需要在您的Spring Boot项目中添加以下依赖:
<dependency>
    <groupId>org.springframework.boot</groupId>
    <artifactId>spring-boot-starter-actuator</artifactId>
</dependency>
<dependency>
    <groupId>io.micrometer</groupId>
    <artifactId>micrometer-registry-prometheus</artifactId>
</dependency>
这将添加Actuator和Prometheus的依赖项到您的项目中。
步骤2:配置Actuator,启用Prometheus端点
application.yml文件中添加以下配置:
spring:
  application:
    name: PrometheusApp

#Prometheus springboot监控配置
management:
  endpoints:
    web:
      exposure:
        include: '*'
    tags:
      application: ${spring.application.name} # 暴露的数据中添加application label
include=* 配置为开启 Actuator 服务,Spring Boot Actuator 自带了一个/actuator/Prometheus 的监控端点供给Prometheus 抓取数据。不过默认该服务是关闭的,所以,使用该配置将打开所有的 Actuator 服务。
Actuator 默认的端点很多,详见:
https://docs.spring.io/spring-boot/docs/2.4.3/reference/html/production-ready-features.html#production-ready-endpoints
步骤3:启动应用程序
现在,您可以启动您的Spring Boot应用程序了。
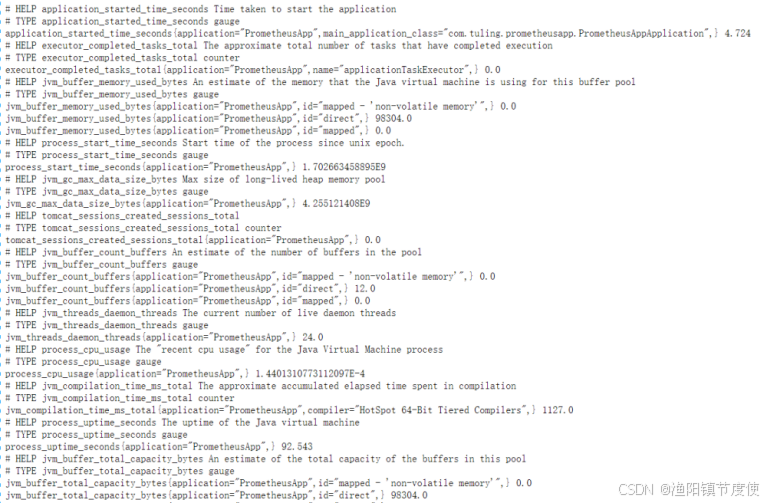
可以通过访问http://localhost:8080/actuator/prometheus来查看Prometheu实时监控的指标数据。
以上就是使用Spring Boot Actuator和Prometheus监控应用程序的整个过程。
将应用添加到Prometheus
首先,修改 Prometheus 的配置文件 prometheus.yml ,添加上边启动的服务地址来执行监控
scrape_configs:
  - job_name: 'prometheusapp'
    metrics_path: '/actuator/prometheus'
    static_configs:
      - targets: ['192.168.2.234:8080']
上面的prometheusapp 就是前面创建的Spring Boot 应用程序,也就是 Prometheus 需要监控的服务地址。
然后,重启 Prometheus 服务,查看 Prometheus UI界面确认 Target 是否添加成功。
使用 Grafana Dashboard 展示应用数据
在https://grafana.com/grafana/dashboards下载Spring Boot的模板(这里使用的是编号4701)
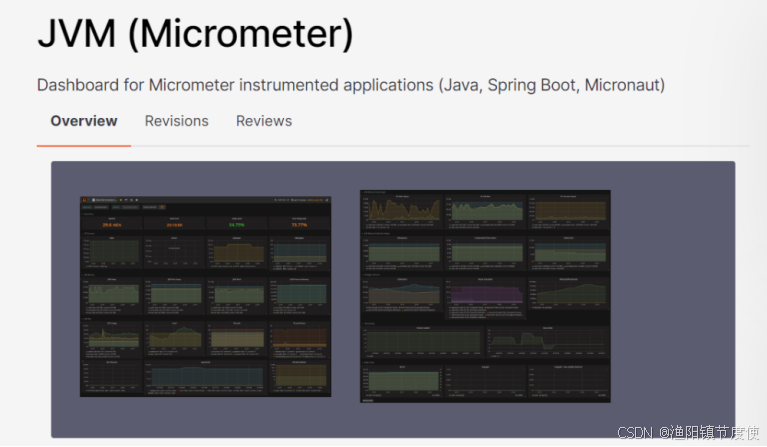
根据ID导入模板,导入完毕后,就可以看到 JVM的各项监控指标,如果有多个应用,可以通过Application选择
Prometheus告警处理
Alertmanager介绍
Prometheus 包含一个报警模块,就是 AlertManager,Alertmanager 主要用于接收 Prometheus 发送的告警信息,它支持丰富的告警通知渠道,而且很容易做到告警信息进行去重,降噪,分组等,是一款前卫的告警通知系统。
通过在 Prometheus 中定义告警规则,Prometheus会周期性的对告警规则进行计算,如果满足告警触发条件就会向Alertmanager 发送告警信息。
告警能力在Prometheus的架构中被划分成两个独立的部分。如下所示,通过在Prometheus中定义AlertRule(告警规则),Prometheus会周期性的对告警规则进行计算,如果满足告警触发条件就会向Alertmanager发送告警信息。
在Prometheus中一条告警规则主要由以下几部分组成:
- 告警名称:用户需要为告警规则命名,当然对于命名而言,需要能够直接表达出该告警的主要内容
- 告警规则:告警规则实际上主要由PromQL进行定义,其实际意义是当表达式(PromQL)查询结果持续多长时间(During)后出发告警
部署AlertManager
Alertmanager和Prometheus Server一样均采用Golang实现,并且没有第三方依赖。
Linux安装AlertManager
1)下载安装包
Alertmanager最新版本的下载地址可以从Prometheus官方网站https://prometheus.io/download/获取。
wget https://github.com/prometheus/alertmanager/releases/download/v0.26.0/alertmanager-0.26.0.linux-amd64.tar.gz
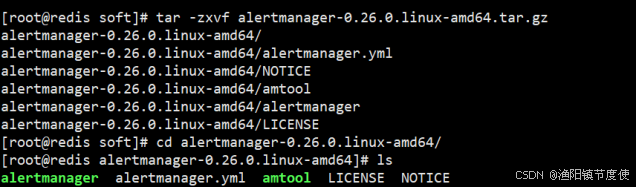
2)创建alertmanager配置文件
Alertmanager解压后会包含一个默认的alertmanager.yml配置文件,内容如下所示:
route:
  group_by: ['alertname']
  group_wait: 30s
  group_interval: 5m
  repeat_interval: 1h
  receiver: 'web.hook'
receivers:
  - name: 'web.hook'
    webhook_configs:
      - url: 'http://127.0.0.1:5001/'
inhibit_rules:
  - source_match:
      severity: 'critical'
    target_match:
      severity: 'warning'
    equal: ['alertname', 'dev', 'instance']
Alertmanager主要负责对Prometheus产生的告警进行统一处理,因此在Alertmanager配置中一般会包含以下几个主要部分:
- 全局配置(global):用于定义一些全局的公共参数,如全局的SMTP配置,Slack配置等内容;
- 模板(templates):用于定义告警通知时的模板,如HTML模板,邮件模板等;
- 告警路由(route):根据标签匹配,确定当前告警应该如何处理;
- 接收人(receivers):接收人是一个抽象的概念,它可以是一个邮箱也可以是微信,Slack或者Webhook等,接收人一般配合告警路由使用;
- 抑制规则(inhibit_rules):合理设置抑制规则可以减少垃圾告警的产生
3) 启动Alertmanager
Alermanager会将数据保存到本地中,默认的存储路径为data/。因此,在启动Alertmanager之前需要创建相应的目录:
./alertmanager
用户也在启动Alertmanager时使用参数修改相关配置。–config.file用于指定alertmanager配置文件路径,–storage.path用于指定数据存储路径
查看运行状态
Alertmanager启动后可以通过9093端口访问,http://192.168.3.100:9093
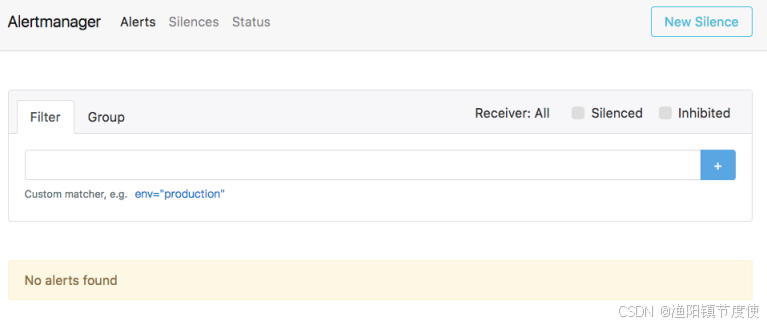
Alert菜单下可以查看Alertmanager接收到的告警内容。Silences菜单下则可以通过UI创建静默规则。进入Status菜单,可以看到当前系统的运行状态以及配置信息。
docker 安装AlertManager
mkdir -p /etc/alertmanager/
mkdir -p /etc/alertmanager/template

vim /etc/alertmanager/alertmanager.yml
route:
  group_by: ['alertname']
  group_wait: 30s
  group_interval: 5m
  repeat_interval: 1h
  receiver: 'web.hook'
receivers:
  - name: 'web.hook'
    webhook_configs:
      - url: 'http://127.0.0.1:5001/'
inhibit_rules:
  - source_match:
      severity: 'critical'
    target_match:
      severity: 'warning'
    equal: ['alertname', 'dev', 'instance']

docker run -d -p 9093:9093 \
-v /etc/alertmanager:/etc/alertmanager \
-v /etc/localtime:/etc/localtime \
prom/alertmanager
使用Receiver接收告警信息
告警接收器可以通过以下形式进行配置:
receivers:
 - <receiver> ...
每一个receiver具有一个全局唯一的名称,并且对应一个或者多个通知方式。
目前官方内置的第三方通知集成包括:邮件、 即时通讯软件(如Slack、Hipchat)、移动应用消息推送(如Pushover)和自动化运维工具(例如:Pagerduty、Opsgenie、Victorops)。Alertmanager的通知方式中还可以支持Webhook,通过这种方式开发者可以实现更多个性化的扩展支持。
集成qq邮箱
qq邮箱申请授权码
参考:https://service.mail.qq.com/detail/0/75

配置qq邮箱alert
global:   ##全局配置
  resolve_timeout: 5m  ##当告警的状态由firing变为resolve时,需等待5min,如果报警未更新,则声明该告警已解决。可略微调高阈值避免
  smtp_smarthost: 'smtp.qq.com:465'
  smtp_from: '276****211@qq.com'
  smtp_auth_username: '276****211@qq.com'
  smtp_auth_password: 'xxxxxxxxx' # 这个授权码需要生成,非QQ密码
  smtp_require_tls: false
templates:
  - '/etc/alertmanager/template/*.tmpl'
route:
  group_by: ['service','alertname','cluster']   ##根据label进行分组。--cluster可创建集群
  group_wait: 30s   ##触发告警后,等待30s发送
  group_interval: 10s  ##两组告警发送的时间间隔
  repeat_interval: 5m  ##重复告警发送的时间间隔
  receiver: 'email'     #默认接收者
receivers:    ###告警的处理方式email
  - name: 'email'
    email_configs:   ##告警转发到对应邮箱地址
      - to: '276****211@qq.com'
        send_resolved: true
        html: '{{ template "email.html" . }}'   #使用自定义的模板发送

inhibit_rules:    ###添加抑制规则
  - source_match:    ####根据label匹配源告警
      severity: 'critical'
    target_match:    ####根据label匹配目的告警
      severity: 'warning'
    equal: ['alertname', 'dev', 'instance']
创建自定义模版
vim /etc/alertmanager/template/email.tmpl

{{ define "email.html" }}
{{ range $i, $alert :=.Alerts }}
========监控报警==========<br>
告警状态:{{   .Status }}<br>
告警级别:{{ $alert.Labels.severity }}<br>
告警类型:{{ $alert.Labels.alertname }}<br>
告警应用:{{ $alert.Annotations.summary }}<br>
告警主机:{{ $alert.Labels.instance }}<br>
告警详情:{{ $alert.Annotations.description }}<br>
触发阀值:{{ $alert.Annotations.value }}<br>
告警时间:{{ ($alert.StartsAt.Add 28800e9).Format "2006-01-02 15:04:05"}}<br>
========end=============<br>
{{ end }}
{{ end }}
注意:
StartsAt.Fromat为UTC时间,比北京时间晚了8个小时 需要加 28800e9
2006-01-02 15:04:05 不能改变 ,此处为go语言出版时间
启用alertmanager模块和rules告警规则
在Prometheus的架构中被划分成两个独立的部分。Prometheus负责产生告警,而Alertmanager负责告警产生后的后续处理。因此Alertmanager部署完成后,需要在Prometheus中设置Alertmanager相关的信息。
- 编辑Prometheus配置文件prometheus.yml,并添加以下内容
global:
  scrape_interval:     5s # Set the scrape interval to every 15 seconds. Default is every 1 minute.
  evaluation_interval: 5s # Evaluate rules every 15 seconds. The default is every 1 minute.
  # scrape_timeout is set to the global default (10s).

# Alertmanager configuration
alerting:
  alertmanagers:
  - static_configs:
    - targets:
      - 192.168.3.100:9093

# Load rules once and periodically evaluate them according to the global 'evaluation_interval'.
rule_files:
  - "/etc/prometheus/rules/*.rules"
  # - "second_rules.yml"
# A scrape configuration containing exactly one endpoint to scrape:
# Here it's Prometheus itself.
重启Prometheus服务,成功后,可以从http://192.168.3.100:9090/config查看alerting配置是否生效。
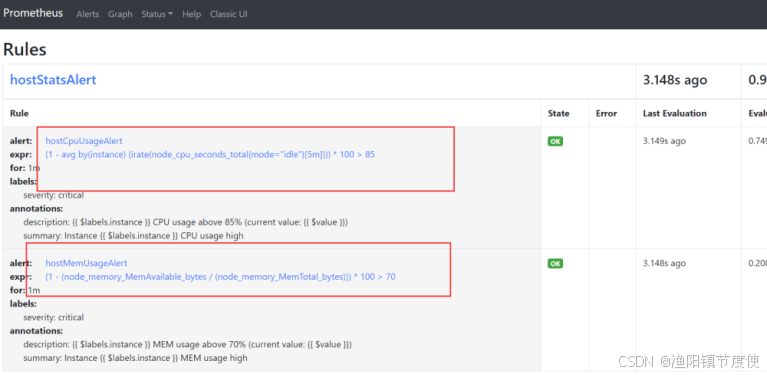
创建rules告警规则
主机CPU利用率>85%
主机MEM利用率>70%
mkdir -p /etc/prometheus/rules
vim /etc/prometheus/rules/alerts.rules

groups:
- name: hostStatsAlert
  rules:
  - alert: hostCpuUsageAlert
    expr: (1 - avg(irate(node_cpu_seconds_total{mode="idle"}[5m])) by (instance))*100 > 85
    for: 1m
    labels:
      severity: critical
    annotations:
      summary: "Instance {{ $labels.instance }} CPU usage high"
      description: "{{ $labels.instance }} CPU usage above 85% (current value: {{ $value }})"
  - alert: hostMemUsageAlert
    expr: (1 - (node_memory_MemAvailable_bytes{} / (node_memory_MemTotal_bytes{})))* 100 > 70
    for: 1m
    labels:
      severity: critical
    annotations:
      summary: "Instance {{ $labels.instance }} MEM usage high"
      description: "{{ $labels.instance }} MEM usage above 70% (current value: {{ $value }})"
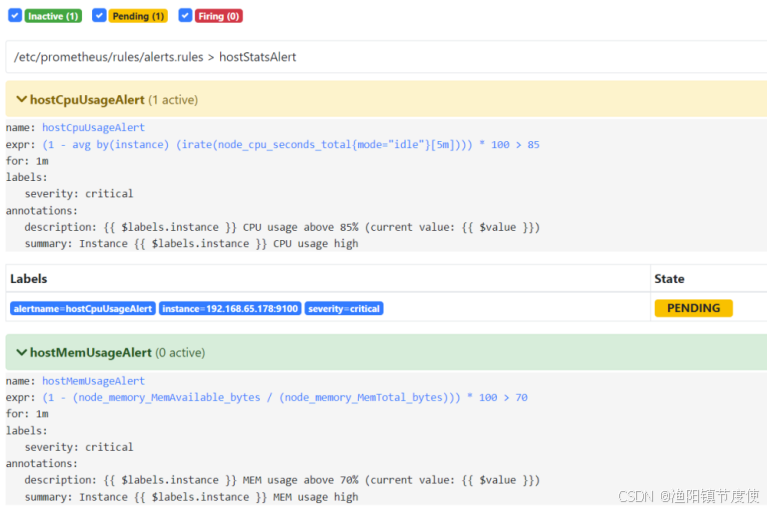
重启Prometheus后访问Prometheus UI http://127.0.0.1:9090/rules可以查看当前以加载的规则文件。
切换到Alerts标签http://127.0.0.1:9090/alerts可以查看当前告警的活动状态。
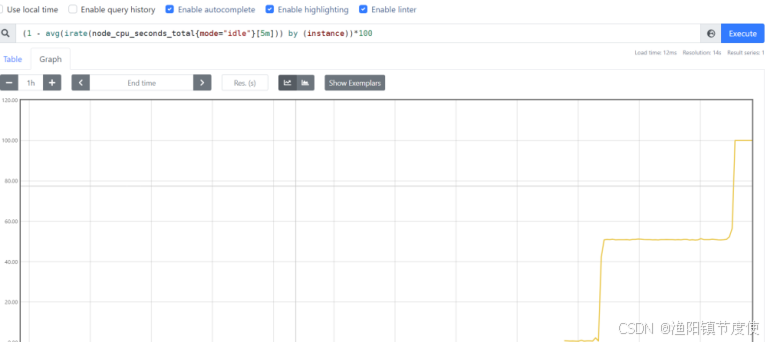
此时,可以手动拉高系统的CPU使用率,验证Prometheus的告警流程,在主机上运行以下命令:
vim load_cpu.sh

#!/bin/bash
while true; do
  :
done

chmod +x load_cpu.sh
./load_cpu.sh
运行命令后查看CPU使用率情况,如下图所示:
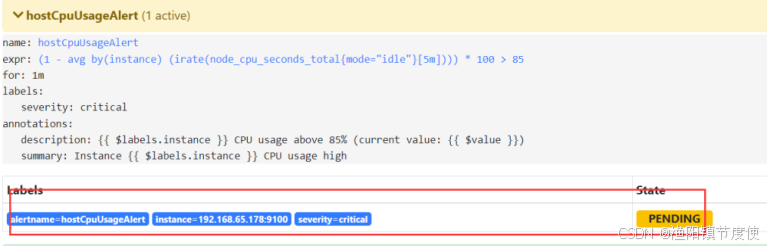
Prometheus首次检测到满足触发条件后,hostCpuUsageAlert显示由一条告警处于活动状态。由于告警规则中设置了1m的等待时间,当前告警状态为PENDING,如下图所示:


 1606
1606

 被折叠的 条评论
为什么被折叠?
被折叠的 条评论
为什么被折叠?
 到【灌水乐园】发言


