


1 示例代码
代码:
import numpy as np
import matplotlib.pyplot as plt
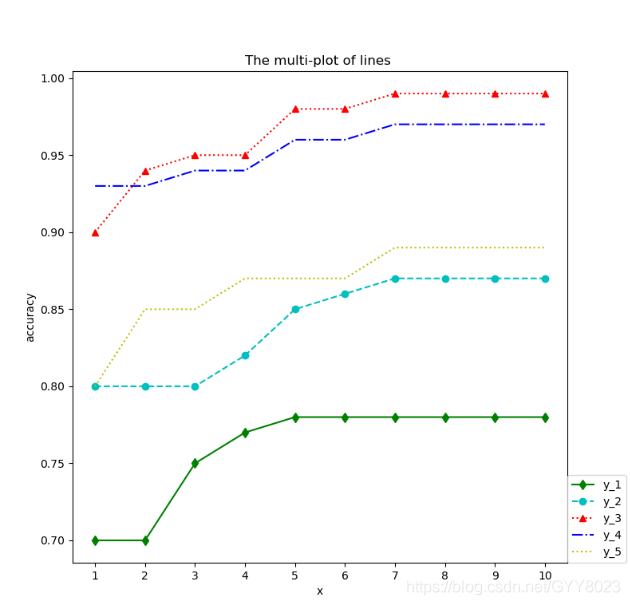
x = np.arange(1,11,1)
y_1 = np.array([0.7,0.7,0.75,0.77,0.78,0.78,0.78,0.78,0.78,0.78])
y_2 = np.array([0.8,0.8 ,0.8, 0.82, 0.85, 0.86, 0.87, 0.87, 0.87, 0.87])
y_3 = np.array([0.9, 0.94, 0.95, 0.95, 0.98, 0.98, 0.99, 0.99, 0.99, 0.99])
y_4 = np.array([0.93, 0.93, 0.94, 0.94, 0.96, 0.96, 0.97, 0.97, 0.97, 0.97])
y_5 = np.array([0.8, 0.85, 0.85, 0.87, 0.87, 0.87, 0.89, 0.89, 0.89, 0.89])
plt.plot(x,y_1,'-dg',label='-dg')
plt.plot(x,y_2,'--oc',label='--oc')
plt.plot(x,y_3,':^r',label=':^r')
plt.plot(x,y_4,'-.b',label=':b')
plt.plot(x,y_5,':y',label=':y')
# 将图例放在外面
plt.legend(bbox_to_anchor=(1, 0), loc=3, borderaxespad=0)
plt.xlabel('x')
plt.xticks(x)
plt.ylabel('accuracy')
plt.title("The multi-plot of lines ")
plt.show()
2 示例结果
结果:


 6337
6337


 被折叠的 条评论
为什么被折叠?
被折叠的 条评论
为什么被折叠?
 到【灌水乐园】发言


