激活函数的主要作用:加入非线性
#_*_ coding:UTF-8 _*_
import numpy as np
import matplotlib.pyplot as plt
import tensorflow as tf
#创建输入数据
x=np.linspace(-7,7,180) #(-7,7)之间的等间隔的180个点
#1.激活函数的原始实现
def sigmoid(inputs):
y=[1/float(1+np.exp(-x)) for x in inputs]
return y
def relu(inputs):
y=[x*(x>0) for x in inputs]
return y
def tanh(inputs):
y=[(np.exp(x) - np.exp(-x))/float(np.exp(x) + np.exp(-x)) for x in inputs]
return y
def softplus(inputs):
y=[np.log(1+np.exp(x)) for x in inputs]
return y
#2.实际计算经过Tensorflow的激活函数处理的各个Y值
y_sigmoid=tf.nn.sigmoid(x)
y_relu = tf.nn.relu(x)
y_tanh = tf.nn.tanh(x)
y_softplus=tf.nn.softplus(x)
#创建会话
sess = tf.Session()
#运行
y_sigmoid,y_relu, y_tanh, y_softplus = sess.run([y_sigmoid, y_relu,y_tanh,y_softplus])
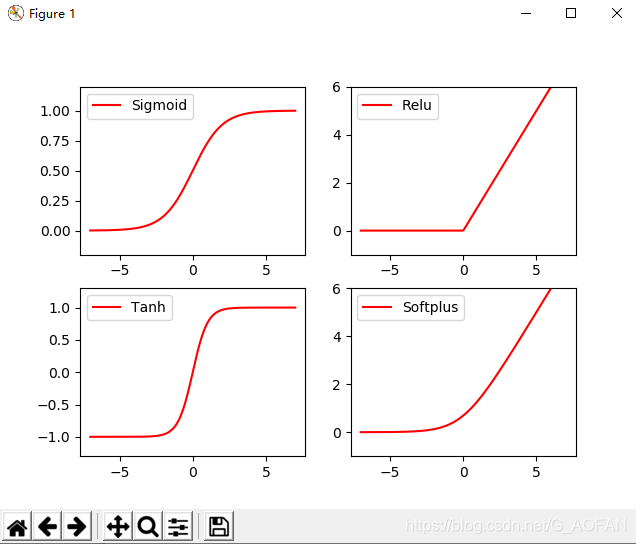
#创建各个激活函数的图像
plt.subplot(221)#2行2列第1个
plt.plot(x,y_sigmoid,c="red",label="Sigmoid")
plt.ylim(-0.2, 1.2)
plt.legend(loc="best")
plt.subplot(222)#2行2列第2个
plt.plot(x,y_relu,c="red",label="Relu")
plt.ylim(-1, 6)
plt.legend(loc="best")
plt.subplot(223)#2行2列第3个
plt.plot(x,y_tanh,c="red",label="Tanh")
plt.ylim(-1.3, 1.3)
plt.legend(loc="best")
plt.subplot(224)#2行2列第4个
plt.plot(x,y_softplus,c="red",label="Softplus")
plt.ylim(-1, 6)
plt.legend(loc="best")
#显示图像
plt.show()
#关闭会话
sess.close()


 1500
1500

 被折叠的 条评论
为什么被折叠?
被折叠的 条评论
为什么被折叠?
 到【灌水乐园】发言


