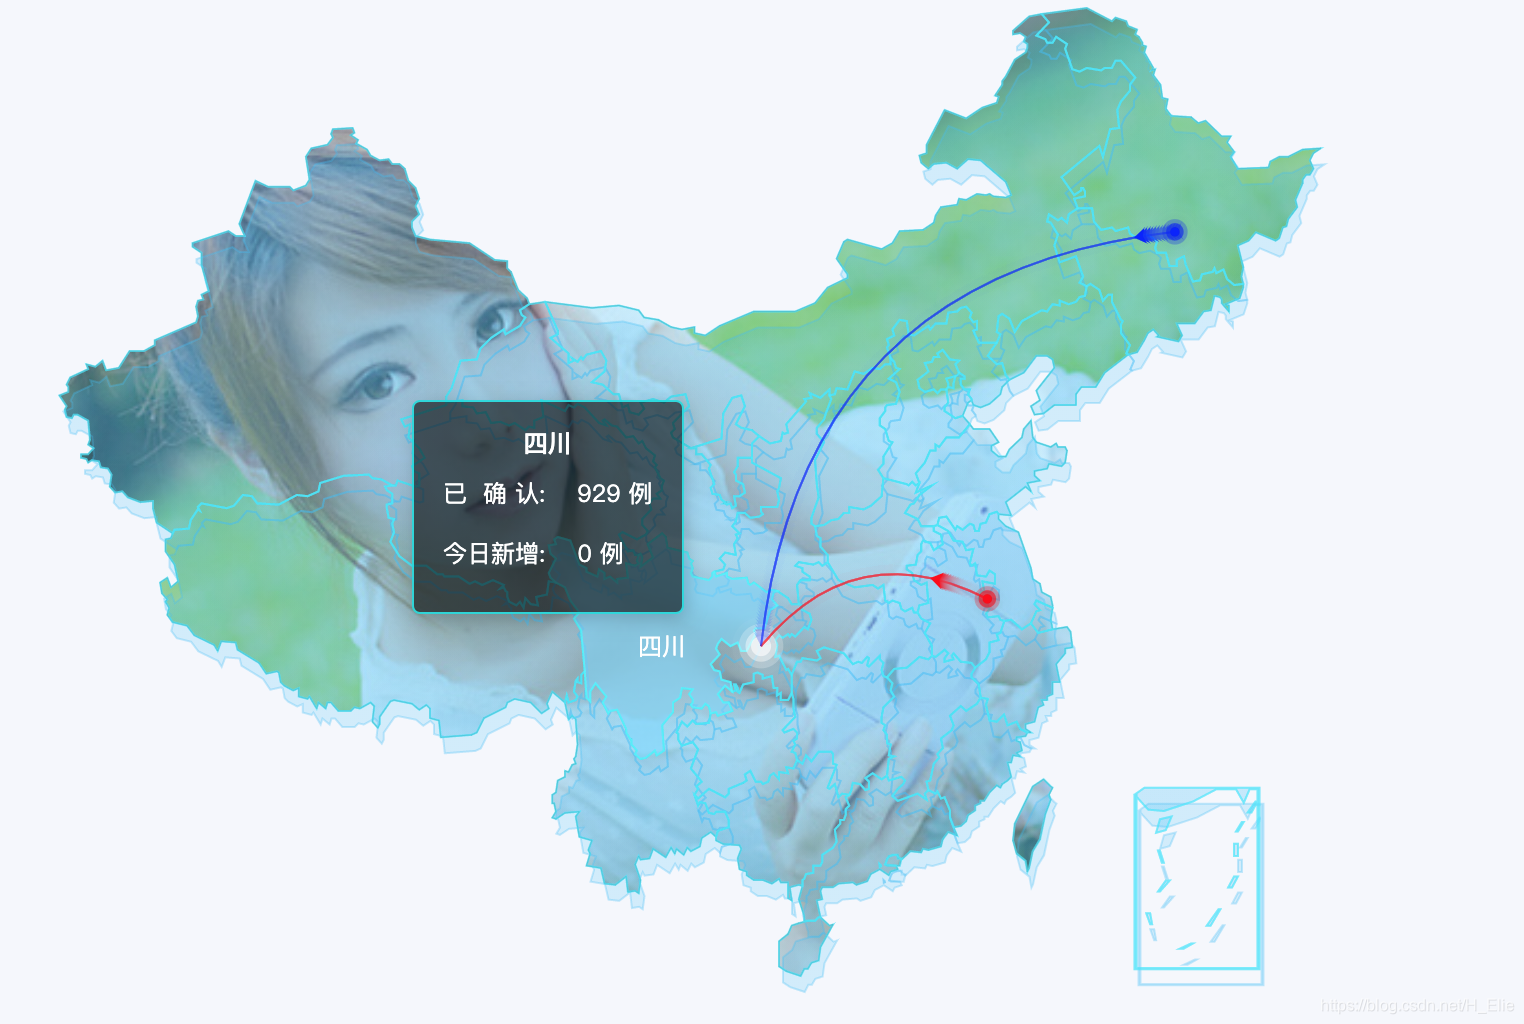
目前需求是在地图上展示全国各省的地图并展示实时疫情数据,以重庆为例展示各地前往重庆的数据迁移图
效果如下

1、引入echart与china.json数据
//最新版echart必须要以此种方式引入
import * as echarts from 'echarts'
let uploadedData = require('./china.json')
echarts.registerMap('china', uploadedData)
2、tooltip配置:由于地图较大,有些情况下弹窗位置有问题,因此除了默认的position还可可以自定义配置,代码如下:
let toolTip = {
trigger: 'item',
backgroundColor: 'rgba(0,0,0,.6)',
borderColor: 'rgba(0, 249, 252, .8)',
position: function(point, params, dom, rect, size) {
var x = 0 // x坐标位置
var y = 0 // y坐标位置
// 当前鼠标位置
var pointX = point[0]
var pointY = point[1]
// 提示框大小
var boxWidth = size.contentSize[0]
var boxHeight = size.contentSize[1]
// boxWidth > pointX 说明鼠标左边放不下提示框
if (boxWidth > pointX) {
x = 5
} else {
// 左边放的下
x = pointX - boxWidth
}
if (boxHeight > pointY) {
y = 5
} else {
// 上边放得下
y = pointY - boxHeight
}
return [x, y]
},
// triggerOn: 'click', //触发方式
enterable: false, // 鼠标可移入tooltip中
// formatter自定义提示窗内容 params指的是当前块内数据
formatter: function(params) {
let data = params.data
let res =
'<div><h2 style="color:#fff;font-size: .26rem;padding:0 0.1rem;text-align:center;">' +
data.name +
'</h2><p style="color:#fff;padding:0.1rem 0.1rem;font-size: .22rem;">' +
'已 确 认' +
': ' +
data.value +
' 例</p >' +
'</h2><p style="color:#fff;padding:0.1rem 0.1rem 0.2rem;font-size: .22rem;">' +
'今日新增' +
': ' +
data.today +
' 例</p ><div>'
return res
}
}
3、较为关键geo部分,分为上下两层,下层为自定义图片的背景底图,上层为操作与展示主要位置
 let geo = [
	    {
      map: 'china',
      aspectScale: 0.75, //长宽比
      zoom: 1.1,
      // 选中模式,表示是否支持多个选中,默认关闭,支持布尔值和字符串,字符串取值可选'single'表示单选,或者'multiple'表示多选。
      selectedMode: 'single',
      roam: false,
      itemStyle: {
        opacity: 0.8,
        color: {
          image: '', // 支持为 HTMLImageElement, HTMLCanvasElement,不支持路径字符串
          repeat: `repeat`, // 是否平铺,可以是 'repeat-x', 'repeat-y', 'no-repeat'
          opacity: '0.3'
        },
        // borderColor: 'rgba(58, 189, 248, 0.3)',
        // borderWidth: 1, //添加此处border还有一种边界墙效果
        shadowColor: 'rgba(58, 189, 248, 0.8)'
      },
      regions: [
        {
          name: '南海诸岛',
          silent: true, // 不能进行点击等操作
          itemStyle: {
            normal: {
              opacity: 0 // 为 0 时不绘制该图形
            }
          },
          emphasis: {
            areaColor: '#fff',
            borderWidth: 0,
            color: 'transparent',
            label: {
              show: false
            }
          },
          label: {
            show: false // 隐藏文字
          }
        }
      ]
    },
    {
      map: 'china',
      aspectScale: 0.75, //长宽比
      zoom: 1.1,
      selectedMode: 'single',
      roam: false,
      itemStyle: {
        normal: {
          areaColor: {
            type: 'radial',
            x: 0.5,
            y: 0.5,
            r: 0.8,
            colorStops: [
              {
                offset: 0,
                color: 'rgba(58, 189, 248, 0.2)' // 0% 处的颜色
              },
              {
                offset: 1,
                color: 'rgba(58, 189, 248, 0.6)' // 100% 处的颜色
              }
            ],
            globalCoord: true // 缺省为 false
          },
          borderColor: 'rgba(58, 189, 248, 0.3)',
          borderWidth: 1,
          shadowColor: 'rgba(58, 189, 248, 1)',
          shadowOffsetX: 2,
          shadowOffsetY: 8
        },
        // 鼠标悬浮或者点击时候状态样式
        emphasis: {
          areaColor: '#fff',
          borderWidth: 0,
          color: 'transparent',
          label: {
            show: false
          }
        }
      }
    }
 ]
4、有的需求展示南海诸岛,若展示即可将series[0].data数组对象中添加下面数据即可
{
  name: '南海诸岛',
  value: 0,
  today: 0, // 为了展示疫情数据自行添加的内容
  itemStyle: {
  // opacity 为0即不展示
    normal: { opacity: 1, show: true, label: { show: true } }
  }
}
5、series部分,效果展示均在此处,series[0] 为数据主要展示内容,series[1]为迁移图的点位,series为迁移图样式
 let points = [
   {
    value: [118.8062, 31.9208],
    itemStyle: {
      color: 'red'
    }
  },
  {
    value: [127.9688, 45.368],
    itemStyle: {
      color: 'blue'
    }
  },
  // 下面为定义的重庆中心点位置与样式
  {
    value: [107.7539, 30.1904],
    symbolSize: 10,
    // 效果
    rippleEffect: {
      period: 8,
      scale: 3,
      brushType: 'fill'
    },
    itemStyle: {
      color: 'rgba(255,255,255,.6)',
      shadowBlur: 20,
      shadowOffsetX: 0,
      shadowOffsetY: 0,
      shadowColor: 'rgba(255,255,255,.6)'
    }
  }
 ]
let seeries = [
	  {
      type: 'map',
      roam: false,
      selectedMode: 'single',
      // geoIndex: 3,
      label: {
        normal: {
          show: false,
          textStyle: {
            color: 'transparent'
          }
        },
        emphasis: {
          textStyle: {
            // 地图模块选中文字样式
            size: '16px',
            color: '#fff'
          }
        }
      },
      itemStyle: {
        normal: {
          borderColor: 'RGBA(70, 239, 253, .6)',
          borderWidth: 1,
          areaColor: {
            type: 'radial',
            x: 0.5,
            y: 0.5,
            r: 0.8,
            colorStops: [
              {
                offset: 0,
                color: 'rgba(58, 189, 248, 0.08)' // 0% 处的颜色
              },
              {
                offset: 1,
                color: 'rgba(58, 189, 248, 0.08)' // 100% 处的颜色
              }
            ],
            globalCoord: false // 缺省为 false
          }
        },
        emphasis: {
          areaColor: 'rgba(119, 213, 255, .6)',
          shadowColor: 'rgba(0, 249, 252, 1)',
          borderWidth: 1
        }
      },
      zoom: 1.1,
      //     roam: false,
      map: 'china', //使用
      // 疫情数据
      data: [
        {
          name: '北京',
          value: 100
        }
      ]
    },
    // 点位效果
    {
      type: 'effectScatter',
      coordinateSystem: 'geo',
      selectedMode: 'single',
      showEffectOn: 'render',
      silent: true,
      zlevel: 1,
      rippleEffect: {
        period: 15,
        scale: 4,
        brushType: 'fill'
      },
      hoverAnimation: true,
      label: {
        normal: {
          formatter: '{b}',
          position: 'right',
          offset: [15, 0],
          color: '#1DE9B6',
          show: true
        }
      },
      itemStyle: {
        normal: {
          color: '#1DE9B6',
          shadowBlur: 10,
          shadowColor: '#333'
        }
      },
      symbolSize: 4,
      data: points
    },
    //地图线的动画效果
    {
      type: 'lines',
      zlevel: 2,
      silent: true,
      selectedMode: 'single',
      effect: {
        show: true,
        period: 4, //箭头指向速度,值越小速度越快
        trailLength: 0.02, //特效尾迹长度[0,1]值越大,尾迹越长重
        symbol: 'arrow', //箭头图标
        symbolSize: 6 //图标大小
      },
      lineStyle: {
        normal: {
          // color: colors[n],
          width: 1, //尾迹线条宽度
          opacity: 0.2, //尾迹线条透明度
          curveness: -0.4 //尾迹线条曲直度
        }
      },
      data: [
        {
        // coords 第二个即为目标点位:重庆
          coords: [
            [118.8062, 31.9208],
            [107.7539, 30.1904]
          ],
          lineStyle: { color: 'red' }
        },
        {
          coords: [
            [127.9688, 45.368],
            [107.7539, 30.1904]
          ],
          lineStyle: { color: 'blue' }
        }
      ]
    }
]
5、以上为地图主要内容除了疫情 其他内容也可正常展示,渲染
let option = {
	backgroundColor: 'transparent',
	tooltip:tooltip,
	geo:geo,
	series:series
}
 echarts.init(document.getElementById('#echarts')).setOption(option)
6、以上已经正常展示地图,现在可以添加自定义背景图片,在第三步的 geo[0]可见有image为空,此处就是操作位置,由于是在vue中所以对echart进行了封装并且文件和echart的js配置分开,写的时候注意点就行
// 需要在template中引入图片
<img src="~@img/wenli.png" alt="" hidden ref="imgs" />
// 将this.$refs.imgs赋予geo  然后seetOption即可
option.geo[0].itemStyle.color.image = this.$refs.imgs
//that.$refs.echart.setOption调用echart组件重新刷新配置
7、最后看下疫情数据的引入,
// 由于初始开发阶段疫情数据数据后端接口并未在服务端请求转发,前端直接调用会出现跨域问题,vue可自行在vue.config.js的配置文件中添加proxy代理
proxy:{
  '^/disease': {
     target: 'https://view.inews.qq.com/',
     changeOrigin: true,
     ws: true,
     pathRewrite: {
       '^/disease': '', //路径重写
     },
   }
}
// 重新 run serve之后即刻生效
// 填充统计图
    echartOption(num) {
      let that = this
      // 调用疫情数据接口
      this.getDisease(e => {
        let shengji = JSON.parse(e).areaTree[0].children
        let arr1 = shengji.map(item => {
          return {
            name: item.name,
            // 根据num 判断重新加载的是今日还是所有的数据
            value: num === 0 ? item.total.nowConfirm : item.total.confirm,
            today: item.today.confirm
          }
        })
        arr1.push({
          name: '南海诸岛',
          value: 0,
          today: 0,
          show: true,
          itemStyle: {
            normal: { opacity: 1, show: true, label: { show: true } }
          }
        })
        this.$nextTick(() => {
          let echartDisease = that.$refs.diseaseMap
          echartDisease.option.geo[0].itemStyle.color.image = this.$refs.imgs
          echartDisease.option.series[0].data = arr1
          // refresh
          echartDisease.setOption()
        })
      })
    }
// 请求疫情数据
getDisease(callback) {
   $.ajax({
     type: 'get',
     // 数据来源 腾讯
     url: '/disease/g2/getOnsInfo?name=disease_h5',
     success: res => {
       if (res.data) {
         callback(res.data)
       }
     },
     error: e => {
       this.$message.error('获取疫情数据失败' + e)
       callback(() => {
         return []
       })
     }
   })
}


 1054
1054


 被折叠的 条评论
为什么被折叠?


