


New Vocabularies:
algorithm: 算法
regression:回归
cluster: 聚类, clustering algorithm:聚类算法
contour plots/figure:轮廓图
assignment:赋值
Definition:
“A computer program is said to learn from experience E with respect to some task T and some performance measure P, if its performance on T, as measured by P, improves with experience E.”
随着学习进程E的进行,由评测标准P打分所完成任务T的得分有着显著的提高。
In general, any machine learning problem can be assigned to one of two broad classifications:
Supervised learning and Unsupervised learning.
Content:
Supervised Learning:
- Regression: For continuous valued output
- Classification: For discrete valued output (usually to show different types like 0 for benign and 1 for harmful.
Unsupervised Learning:
- Unsupervised learning allows us to approach problems with little or no idea what our results should look like.
- Can derive this structure by clustering the data based on relationships among the variables in the data.
- no feedback based on the prediction results.
- Example:
Clustering: Take a collection of 1,000,000 different genes, and find a way to automatically group these genes into groups that are somehow similar or related by different variables, such as lifespan, location, roles, and so on.
Non-clustering: The “Cocktail Party Algorithm”, allows you to find structure in a chaotic environment. (i.e. identifying individual voices and music from a mesh of sounds at a cocktail party).
1.Model Representation:
Presentation: 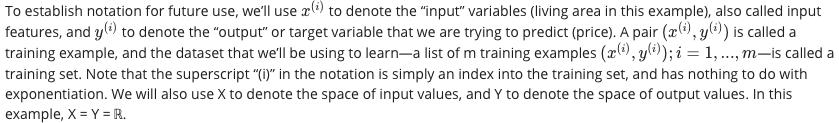
i means the sequences of x or y in training set.
m is called training set presenting the number of samples.

2. Cost Function

-
Definition:
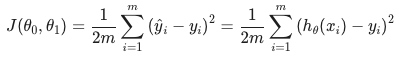 Applying cost function to measure the accuracy of hypothesis.表示拟合的贴近程度。
Why 2m not m?
Because the result of optimisation of cost function is the same, that means we can get same optimisation parameter regard less 2m or m.
Applying gradient descent method to differentiate it we get:
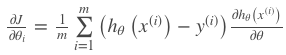
1/m is better for calculation. -
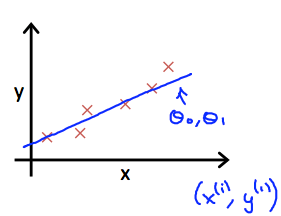
Graphic Presentation
-
Details
one parameter:

two parameters:

inner part of contour plots means the effect is better with small number J.
3. Gradient Descent

DETAILS:
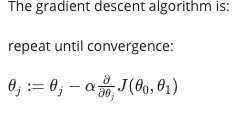
a: learning rate(length of steps)

When specifically applied to the case of linear regression, a new form of the gradient descent equation can be derived. We can substitute our actual cost function and our actual hypothesis function and modify the equation to:
Batch Gradient Descent:
Using all data in the set.


 579
579


 被折叠的 条评论
为什么被折叠?
被折叠的 条评论
为什么被折叠?
 到【灌水乐园】发言


