


文章目录
1.安装 Influxdb
1.1 下载并安装
下载:https://dl.influxdata.com/influxdb/releases/influxdb-1.5.2.x86_64.rpm
安装:yum install -y influxdb-1.8.1.x86_64.rpm
1.2 启动
systemctl start influxdb 启动
systemctl status influxdb 查看状态
systemctl enable influxdb 开机启动
1.3 配置文件
查看 /usr/bin 目录
| 命令 | 描述 |
|---|---|
| influx | influxdb命令行客户端 |
| influxd | influxdb服务器 |
| influx_inspect | 查看工具 |
| influx_stress | 压力测试工具 |
| influx_tsm | 数据库转换工具(将数据库从b1或bz1格式转换为tsm1格式) |
查看 /var/lib/influxdb 目录
| 目录 | 描述 |
|---|---|
| data | 存放最终存储的数据,文件以.tsm结尾 |
| meta | 存放数据库元数据 |
| wal | 存放预写日志文件 |
配置文件路径 :/etc/influxdb/influxdb.conf
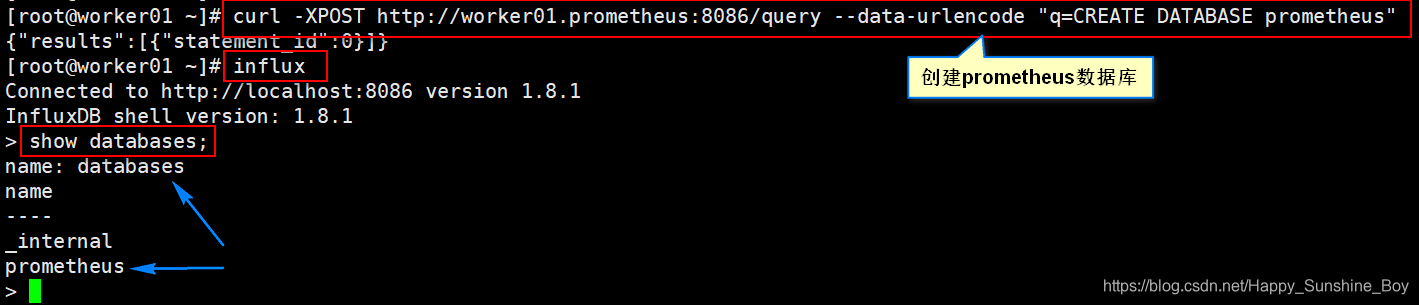
1.4 创建http接口用于prometheus
2.修改prometheus配置
vim /opt/prometheus/cfg/prometheus.yml
#Remote write configuration (for Graphite, OpenTSDB, or InfluxDB).
remote_write:
   - url: "http://worker01.prometheus:8086/api/v1/prom/write?db=prometheus"

# Remote read configuration (for InfluxDB only at the moment).
remote_read:
   - url: "http://worker01.prometheus:8086/api/v1/prom/read?db=prometheus"
重启Prometheus:systemctl restart prometheus.service
3.查看Influxdb数据库
[root@worker01 ~]# influx
Connected to http://localhost:8086 version 1.8.1
InfluxDB shell version: 1.8.1
> show databases;
name: databases
name
----
_internal
prometheus
> use prometheus;
Using database prometheus
> show measurements;
......
count_netstat_wait_connections
cup_use_percent_test_metric
go_gc_duration_seconds
go_gc_duration_seconds_count
go_gc_duration_seconds_sum
go_goroutines
go_info
go_memstats_alloc_bytes
go_memstats_alloc_bytes_total
go_memstats_buck_hash_sys_bytes
go_memstats_frees_total
go_memstats_gc_cpu_fraction
go_memstats_gc_sys_bytes
go_memstats_heap_alloc_bytes
go_memstats_heap_idle_bytes
go_memstats_heap_inuse_bytes
go_memstats_heap_objects
go_memstats_heap_released_bytes
go_memstats_heap_sys_bytes
go_memstats_last_gc_time_seconds
go_memstats_lookups_total
go_memstats_mallocs_total
go_memstats_mcache_inuse_bytes
......
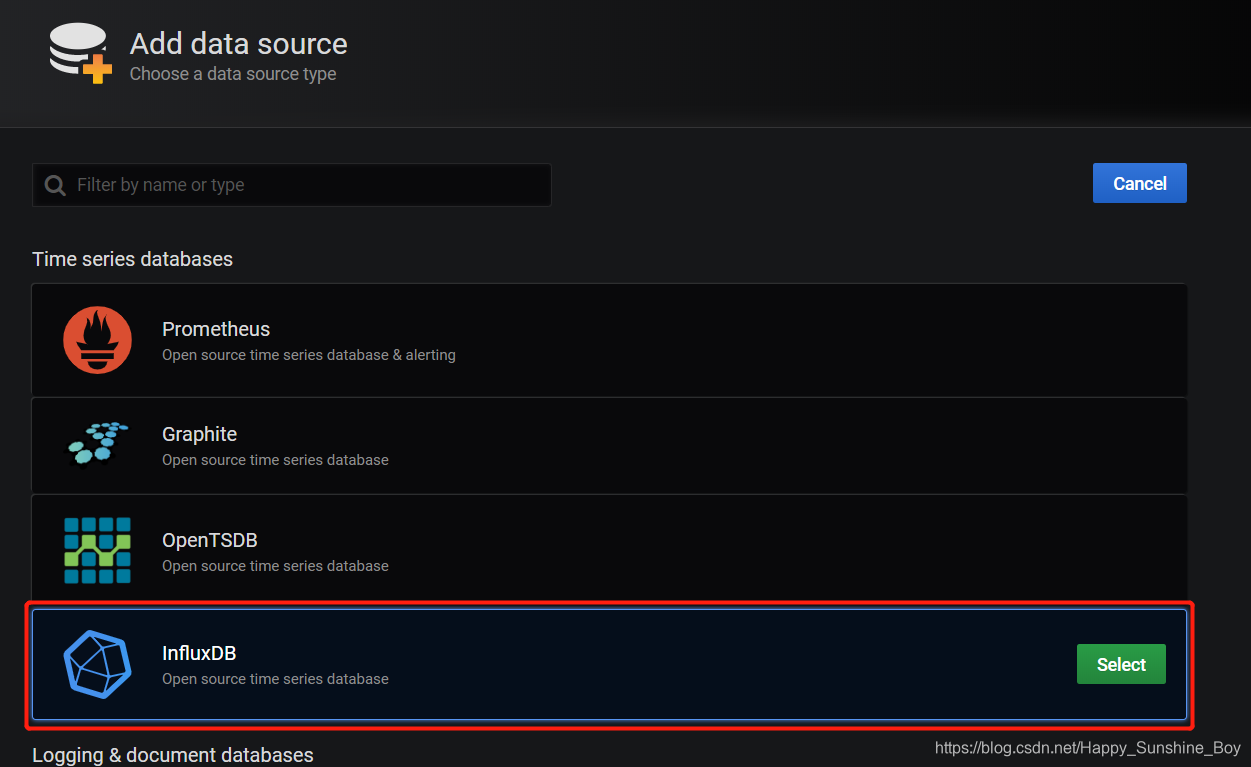
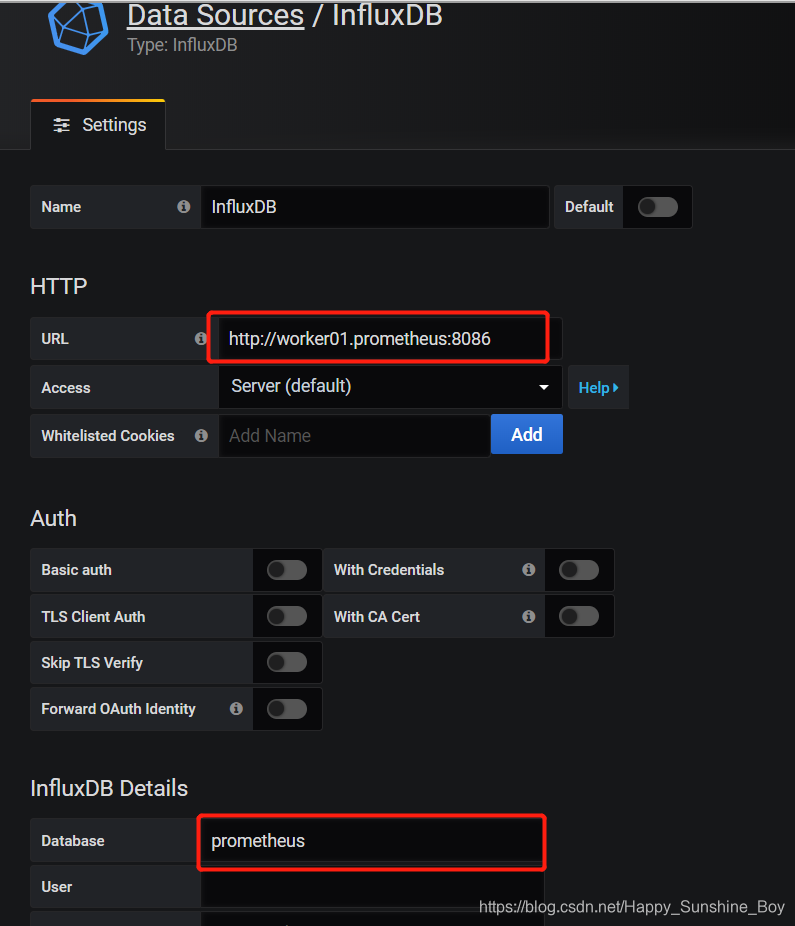
4.Grafana配置Influxdb
- 选择Influxdb
- 配置连接信息,数据库
显示模板没有找到,只能自定义模板了。。。


 1682
1682

 被折叠的 条评论
为什么被折叠?
被折叠的 条评论
为什么被折叠?
 到【灌水乐园】发言


