


Android framework consists of multiple Java based services, native applications and native shared libraries. This article describes a way of debugging native applications using Eclipse CDT. Applications that are implemented mainly in C/C++ are referred as native applications in this article. Examples of native applications are Surfaceflinger, Sensor service, tools like screenshot, bootanimation, dumpsys etc.
NDK applications should be debugged using NDK tools. This article is not meant for NDK debugging. The audience of this article are developers who like to debug or understand native applications that come with Android platform (i.e. AOSP).
Prerequisites
The tools described below are needed before you continue.
-
Eclipse CDT
Eclipse Kepler version on UBuntu is used to verify the steps described here. -
gdbserver for target device
The android platform of target device should have gdbserver agent for remote debugging. You should see /system/bin/gdbserver on target device. If you don't find it, please use one from prebuilt directory. If the device cpu is ARM based, you can use prebuilt/android-arm/gdbserver binary. If the device cpu is x86 based, prebuilt/android-x86/gdbserver should be used. The binary needs to be copied to the device under /system/bin directory. -
gdb host binary
gdb for host machine that understands the target device instruction set is needed. If you are planning to run Eclipse on x86 Linux box to debug target device that uses ARM cpu, you need gdb compiled for x86 linux that understands ARM instruction set.
Android platform comes with prebuilt binaries for various host os, host cpu and target cpu combinations. For the above example, on AOSP 4.0.3 you will use arm-linux-androideabi-gdb located under prebuilt/linux-x86/toolchain/arm-linux-androideabi-4.4.x/bin folder. If your AOSP build is using custom toolchain, gdb from that toolchain should be used.
You can download the following binaries if your device is ARM based and host is x86 based Linux box. These are built with 7.3 version of gdb sources with multithreading patches. My debugging sessions are more predictable with them compared to the prebuilt binaries that came with AOSP 4.0.3.
ARM gdbserver
Linux x86 gdb -
Android SDK tools
Please install Android SDK. Eclipse ADT is not needed. You can skip ADT installation. adb from SDK tools is needed to setup port forwarding, shell access to device.
Shadow AOSP directory
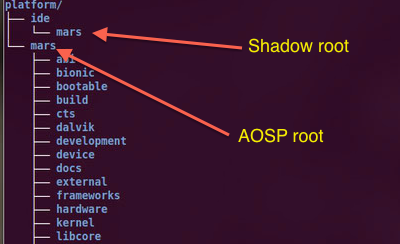
IDEs including eclipse tend to leave artifacts as you use them. Sometimes these artifacts under AOSP tree break AOSP builds. We need to create a shadow directory of symlinks to sources under AOSP root mimicking its directory structure. The shadow directory will be used for eclipse projects.
Lets assume the AOSP sources are located at /home/videoguy/platform/mars folder. This is the top level folder under which you should see frameworks, build, kernel etc sub directories. This folder is referred as <aosproot> in the sections below. Lets assume the shadow folder is located at /home/videoguy/platform/ide/mars . This folder is referred as <shadowroot> below.
- Open a terminal window and change directory to <aosproot> .
- Build the AOSP platform the way you normally do. You should see <aosproot>/out with build artifacts after this. If you haven't created <shadowroot> yet, please create it before continuing. The directory structure should look like below.
-
Change directory to <shadowroot>.
Invoke lndir command like below at command prompt.
$lndir ../../mars
This will make the shadow directory mimic the structure of <aosproot> with symlinks pointing to files under <aosproot> . If you make changes to the files from Eclipse, the files under <aosproot> get changed and vice versa.
Eclipse project
The main goal of having eclipse project is to help with browsing, editing and debugging native code. It is not meant for building code from the IDE. Please use terminal window for building code you are planning to debug.
For this article, Surfaceflinger application is used as debuggee process. This process is responsible for compositing surfaces from foreground applications. Its sources are located under <aosproot>/frameworks/base/services/surfaceflinger folder. Usually one would typically create project that includes the sources of specific module being debugged. Instead I suggest creating eclipse project that includes all the native code under frameworks/base. This makes it easy navigating code using eclipse symbol help shortcuts.
Please follow the instructions below to create the project.
To build surfaceflinger library with debug symbols, please follow the steps below. You can use the same process for other libraries or applications.
Create a file gdb4android.cmds with contents below under <aosproot> directory. You need to substitute <aosproot> below with absolute path of your AOSP directory.
For the setup of this article, the file should look like below.
The mars in out/target/product/mars/symbols/system/bin above is the Android device you are building. You need to substitute mars with the device name of your AOSP configuration.
Now you should create debug configuration.
Having right gdb and gdb4android.cmds is crucial for debugging to work reliably. If debugger doesn't stop at the breakpoints you configured, first thing you should check is debugger configuration in step 3 above.
There are couple of wrinkles to iron out to have productive debugging sessions when debugging a native Android framework application (like Surfaceflinger). The application or library that you are planning to debug needs to be copied to /system partition which is read-only. Flashing your device with new system image is not an option as it is time consuming process. The other option is to remount root partition as read-writeable and push new binaries to target device. You might have to reboot your device if the changed binary affects core services like Surfaceflinger or system_server processes. That is still better than flashing your device. Given below are helper commands to do these tasks.
Assuming you have already connected to the device through ADB, Issue the following command to remount system partition as read-writable.
$adb shell mount -o rw,remount /system
If this doesn't work, try this one.
$adb shell mount -o rw,remount /
The way to verify if it worked is to look for root partition attributes in mount output. You should see rw (instead of ro) like red text below.
/dev/mmcblk0p5 / ext3 rw,relatime,errors=continue,barrier=0,data=ordered 0 0
tmpfs /dev tmpfs rw,nosuid,relatime,mode=755 0 0
devpts /dev/pts devpts rw,relatime,mode=600 0 0
proc /proc proc rw,relatime 0 0
sysfs /sys sysfs rw,relatime 0 0
tmpfs /mnt/asec tmpfs rw,relatime,mode=755,gid=1000 0 0
tmpfs /tmp tmpfs rw,relatime,mode=777,gid=1000 0 0
Then push new binary.
To reboot
$adb shell reboot
What we have done so far are one time configuration steps needed for debugging sessions. We have a project that has most of native sources we are planning to debug and a debug configuration to debug a specific native application (i.e. Surfaceflinger). We have gone over adb helper commands to push new binaries to target device.
For this article, Surfaceflinger application is used as debuggee process. This process is responsible for compositing surfaces from foreground applications. Its sources are located under <aosproot>/frameworks/base/services/surfaceflinger folder. Usually one would typically create project that includes the sources of specific module being debugged. Instead I suggest creating eclipse project that includes all the native code under frameworks/base. This makes it easy navigating code using eclipse symbol help shortcuts.
Please follow the instructions below to create the project.
- Launch Eclipse CDT.
- Choose File->New->Project... menu option.
In the new project dialog, expand C/C++ category.
Select Makefile project with Existing Code. It looks like below.
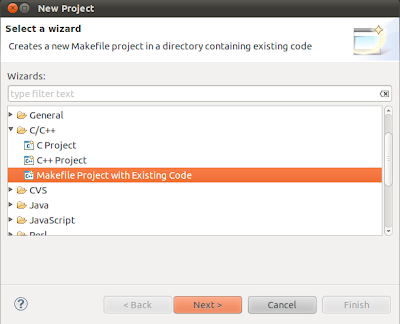
Click Next. - Please configure new project.
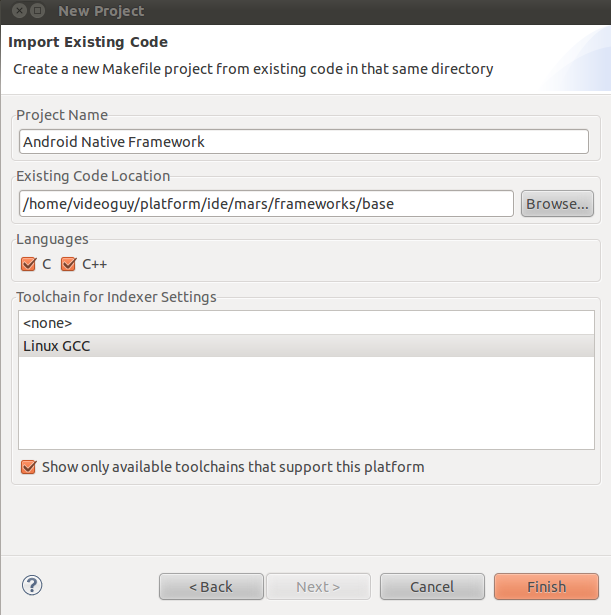
Change Project Name to Android Native Framework.
Change Existing Code Location to <shadowroot>/frameworks/base. Make sure you are using <shadowroot> tree for this.
Change Toolchain for Indexer settings to Linux GCC.

Click Finish. Please wait 30-40 secs for project parsing to complete. - Disable builds. As mentioned above, we do not want to use Eclipse for building native code.
Right click on Android Native Framework project and select Properties.
Select C/C++ Build.
Uncheck Use default build command.
Change Build command to dummymake. It should look like below.

Press OK to close the dialog.


Native binaries with debug symbols
Native applications or libraries need to be built with debug symbols for source level debugging to work reliably. You can use lunch command to make a debug build as described at AOSP Building and Running. You can make a debug or release build and flash your device with it. In either case, you can build specific components with debug symbols and debug that code. Remaining steps assume you already flashed the Android device with latest and greatest AOSP platform build of your Android fork.To build surfaceflinger library with debug symbols, please follow the steps below. You can use the same process for other libraries or applications.
- Launch a terminal window and change directory to <aosproot>. Invoke envsetup.sh as below.
$source build/envsetup.sh - Change directory to <aosproot>/frameworks/base/services/surfaceflinger.
$cd frameworks/base/services/surfaceflinger/ - Invoke mm command as below.
$mm -B LOCAL_STRIP_MODULE=false LOCAL_CFLAGS=" -O0 -g "
The -B option will cause a clean build of current folder.
Passing LOCAL_CFLAGS like above would generate binary with debug symbols most of the times. If the Android.mk file in current directory (i.e. where mm is invoked) redefines it, your build would fail. It is better to check Android.mk file for this scenario and edit the .mk file to include " -O0 -g " where LOCAL_CFLAGS is assigned. If you edited Android.mk file, don't pass LOCAL_CFLAGS to mm. Please note surfaceflinger .mk redefines LOCAL_CFLAGS. Please plan to edit the file.
The generated unstripped binary (i.e. libsurfaceflinger.so) would be available at <aosproot>/out/target/product/mars/symbols/system/lib/libsurfaceflinger.so.
The binary has to be pushed to target device before debugging it.
Remote Debug Configuration
An eclipse debug configuration should be created to debug remote C/C++ applications. Before you do this using eclipse GUI, you need to create gdb script file that tells gdb where to find symbols for standard libraries like C/C++ run time, openssl, OpenGL etc.Create a file gdb4android.cmds with contents below under <aosproot> directory. You need to substitute <aosproot> below with absolute path of your AOSP directory.
set solib-absolute-prefix <aosproot>/out/target/product/mars/symbols
set solib-search-path <aosproot>/out/target/product/mars/symbols/system/lib:<aosproot>/out/target/product/mars/symbols/system/bin
set solib-search-path <aosproot>/out/target/product/mars/symbols/system/lib:<aosproot>/out/target/product/mars/symbols/system/bin
For the setup of this article, the file should look like below.
set solib-absolute-prefix /home/videoguy/platform/mars/out/target/product/mars/symbols
set solib-search-path /home/videoguy/platform/mars/out/target/product/mars/symbols/system/lib:/home/videoguy/platform/mars/out/target/product/mars/symbols/system/bin
set solib-search-path /home/videoguy/platform/mars/out/target/product/mars/symbols/system/lib:/home/videoguy/platform/mars/out/target/product/mars/symbols/system/bin
The mars in out/target/product/mars/symbols/system/bin above is the Android device you are building. You need to substitute mars with the device name of your AOSP configuration.
Now you should create debug configuration.
- Launch eclipse and right click on Android Native Framework project. Choose Debug As->Debug Configurations... menu item.
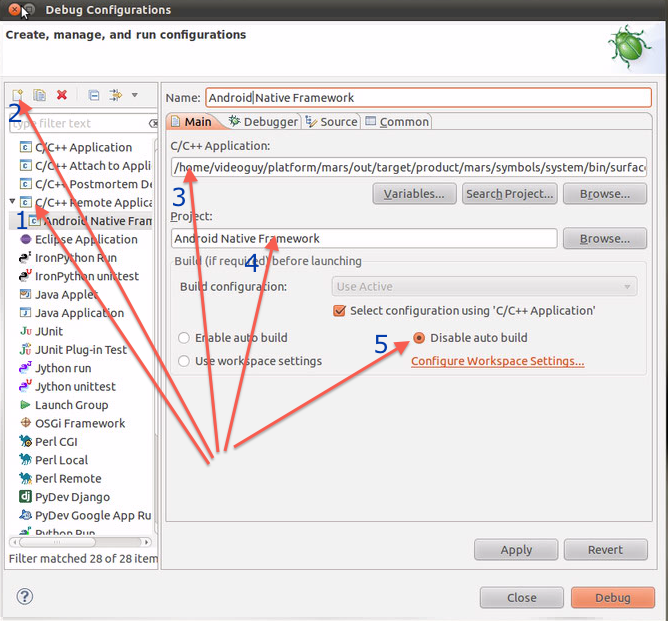
- Select C/C++ Remote Application.
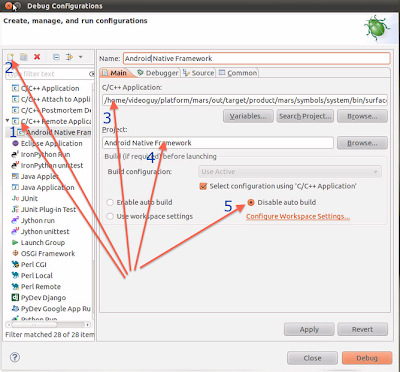
Click on icon with + sign to add new debug configuration.
For C/C++ Application, browse to <aosproot>/out/target/product/mars/symbols/system/bin/surfaceflinger and select it.
For Project, select Android Native Framework.
Enable the radio box Disable auto build. The dialog should look like below.
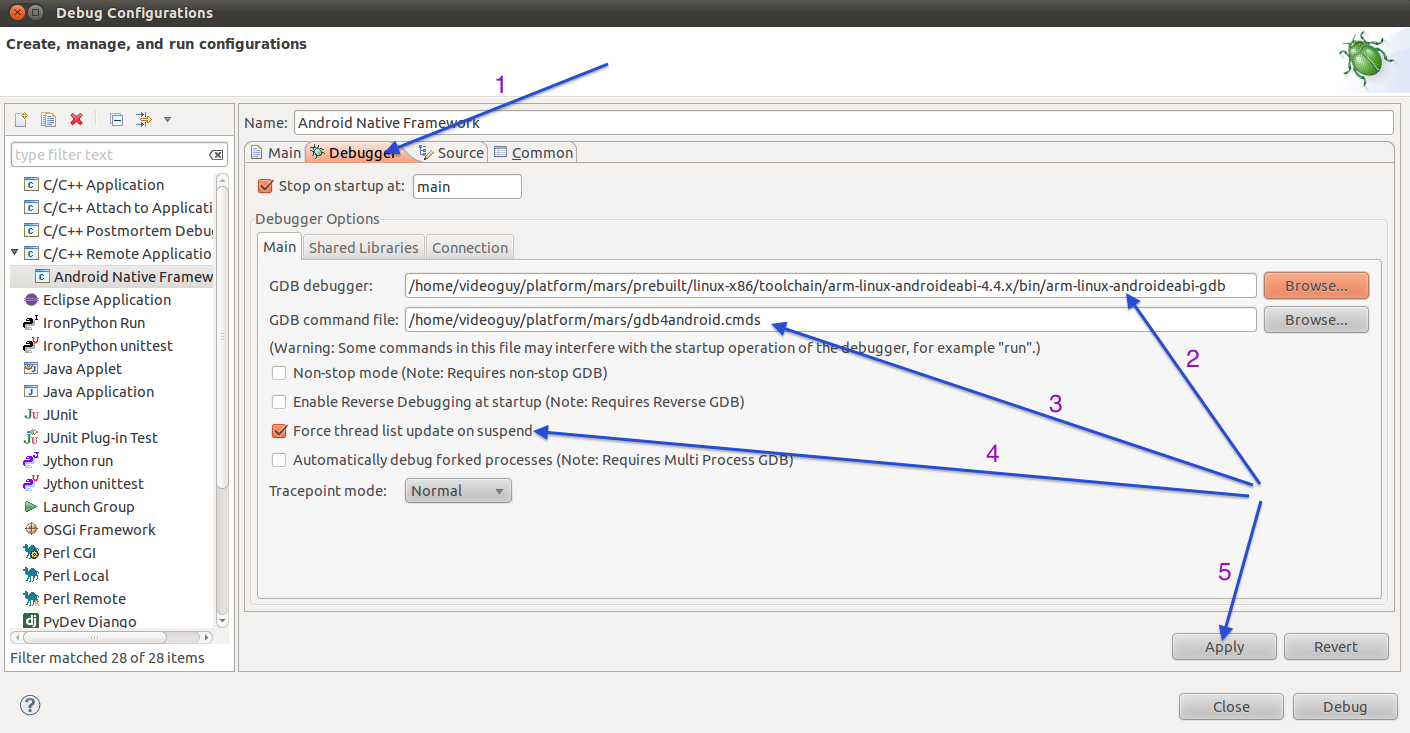
- Select Debugger tab.
For GDB debugger, browse to gdb binary that matches your configuration as described in Prerequisites section.
For GDB command line, Browse and select <aosproot>/gdb4android.cmds file that was created above.
Check Force thread list update on suspend checkmark.
Press Apply to save the configuration. The debugger tab should look like below.
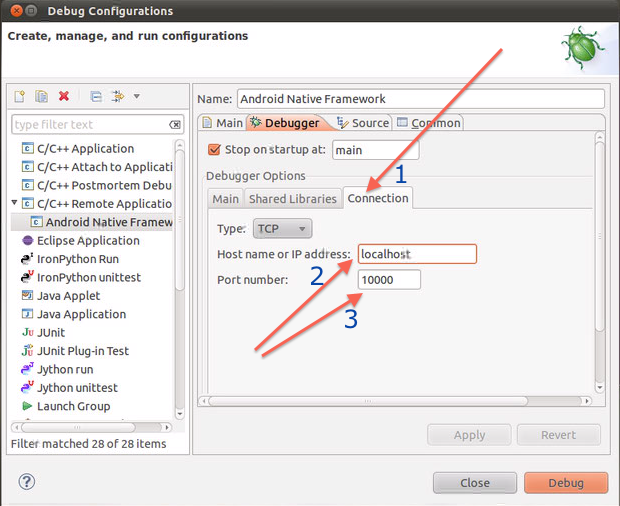
- Press Connection sub tab of Debugger tab.
Change Hostname or IPaddress to localhost.
Change port number to 10000.
Instead of localhost, you can use IP address of the device if device allows tcp connections from external clients. If you are connecting to the device over adb usb bridge, localhost is the only option available.
Press Apply to save changes.
The Connection tab should look like below.
- Press Close to close the dialog.
Having right gdb and gdb4android.cmds is crucial for debugging to work reliably. If debugger doesn't stop at the breakpoints you configured, first thing you should check is debugger configuration in step 3 above.
Remounting root partition
In a typical debugging session, you make changes to sources; build; start a debugging session and stop it after tracing code of interest. You repeat this process until you are satisfied with the results of your changes. This is the usual workflow when debugging desktop applications.There are couple of wrinkles to iron out to have productive debugging sessions when debugging a native Android framework application (like Surfaceflinger). The application or library that you are planning to debug needs to be copied to /system partition which is read-only. Flashing your device with new system image is not an option as it is time consuming process. The other option is to remount root partition as read-writeable and push new binaries to target device. You might have to reboot your device if the changed binary affects core services like Surfaceflinger or system_server processes. That is still better than flashing your device. Given below are helper commands to do these tasks.
Assuming you have already connected to the device through ADB, Issue the following command to remount system partition as read-writable.
$adb shell mount -o rw,remount /system
If this doesn't work, try this one.
$adb shell mount -o rw,remount /
The way to verify if it worked is to look for root partition attributes in mount output. You should see rw (instead of ro) like red text below.
$adb shell mount
rootfs / rootfs rw 0 0
/dev/mmcblk0p5 / ext3 rw,relatime,errors=continue,barrier=0,data=ordered 0 0
tmpfs /dev tmpfs rw,nosuid,relatime,mode=755 0 0
devpts /dev/pts devpts rw,relatime,mode=600 0 0
proc /proc proc rw,relatime 0 0
sysfs /sys sysfs rw,relatime 0 0
tmpfs /mnt/asec tmpfs rw,relatime,mode=755,gid=1000 0 0
tmpfs /tmp tmpfs rw,relatime,mode=777,gid=1000 0 0
Then push new binary.
$adb push <aosproot>/out/target/product/mars/symbols/system/lib/libsurfaceflinger.so /system/lib
To reboot
$adb shell reboot
What we have done so far are one time configuration steps needed for debugging sessions. We have a project that has most of native sources we are planning to debug and a debug configuration to debug a specific native application (i.e. Surfaceflinger). We have gone over adb helper commands to push new binaries to target device.
Debugging session
SurfaceFlinger::threadLoop() is a service method that gets invoked whenever there is a surface (aka layer) ready to be displayed. Lets setup a breakpoint in this function and step through it.- Open frameworks/base/services/surfaceflinger.cpp from eclipse project and set a breakpoint.
If you find breakpoint menu option is disabled, make sure you select Eclipse C/C++ perspective. Another possible reason for this is that the project is configured to use default build command (i.e. make instead of dummymake). Once eclipse parses the whole project, you should be able to setup breakpoints. - Launch a separate terminal window and build surfaceflinger library with debug symbols as described above.
- Connect to target device using adb. Push libsurfaceflinger.so to /system/lib directory as described in previous section.
- Reboot the device (i.e. adb shell reboot)
- Connect again using adb. Setup adb port forwarding.
$adb forward tcp:10000 tcp:10000 - Launch gdbserver and attach to surfaceflinger process.
$adb shell ps | grep surfaceflinger
system 811 1 65484 30004 ffffffff 2aaf7850 S /system/bin/surfaceflinger
$adb shell gdbserver :10000 --attach 811
Attached; pid = 811
Listening on port 10000
The above command should be changed like below if you want gdbserver start an application on connection from client.
$adb shell gdbserver :10000 <path to application> - From Eclipse, Choose Run->Debug Configurations... and select Android Native Framework remote debug configuration. Click Debug.
Eclipse should connect to gdbserver and change to Debug perspective.
You should see something like below from gdbserver session.
Remote debugging from host 127.0.0.1
libthread_db:td_ta_new: Probing system for platform bug.
libthread_db:td_ta_new: Running as root, nothing to do.
You can ignore errors/warnings in gdb console about missing shared lib symbols.
You should see something like below in eclipse.
- Interact with the device that results in UI update. It could be launching a different application or changing focus from one field to other. You should see eclipse hit the breakpoint set above. It should look like below.
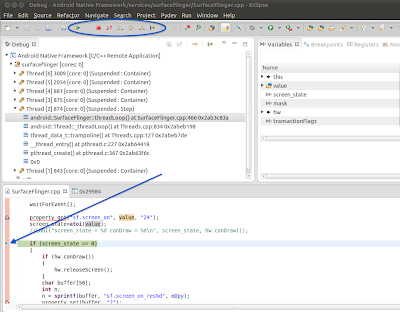
- You can use the debug buttons from the toolbar with blue oval annotation to step through code. When done you can detach from gdbserver.

Troubleshooting
-
Eclipse debugger is failing during launch saying connection timeout
Make sure gdbserver is running waiting for connection. Or
Make sure adb forwarding was setup correctly to do port forwarding -
Debuggee process is crashing with SIGINT
It is usually a symptom of using wrong gdb and gdbserver combination. Invoke "gdbserver --version" on device and "gdb --version" on host. Make sure the versions match. If you are building AOSP with custom toolchain that has its own gdbserver and gdb, please use those versions. -
Eclipse doesn't stop at breakpoints
Look for symptoms described in (2). -
Breakpoints work in the beginning and stop working
Look for symptoms described in (2). -
Debugger suspended the process, but step in/step over etc toolbar buttons are disabled
Make sure you selected one of the threads from thread list.


 1445
1445

 被折叠的 条评论
为什么被折叠?
被折叠的 条评论
为什么被折叠?
 到【灌水乐园】发言


