


 https://illusionna.readthedocs.io/zh/latest/projects/Mathematics/Numerical%20Analysis/%E6%8B%89%E6%A0%BC%E6%9C%97%E6%97%A5%E6%8F%92%E5%80%BC/Lagrange.html
代码依赖第三方库:
1. numpy
2. sympy
3. (matplotlib)
'''
# System --> Windows & Python3.8.0
# File ----> Lagrange.py
# Author --> Illusionna
# Create --> 2023/11/02 15:53:15
'''
# -*- Encoding: UTF-8 -*-


import copy
import numpy as np
from typing import Literal
from sympy import (symbols, expand)


class LAGRANGE:
    """
    --------------------------------------------------
    类: 拉格朗日插值多项式.
        obj = LAGRANGE(X:list, Y:list)
    --------------------------------------------------
    函数:
    1. obj.Interpolate(x:float) -> float
        x 为插值节点.
    2. obj.Show(precision:int=12, mode='definition') -> None
        precision 为显示定义式的多项式系数的精度;
        mode 为多项式显示的模式 --> 'simplify' & 'definition'
    --------------------------------------------------
    """
    def __init__(
        self,
        *args,
        X:list,
        Y:list,
        **kwargs
    ) -> None:
        self.X = X
        self.Y = Y
        self.__base = LAGRANGE.__BaseCoefficients(self)

    def Interpolate(self, x:float) -> float:
        """
        拉格朗日插值.
        """
        result = 0
        val = x
        for i in range(0, len(self.X), 1):
            temp = list(
                map(lambda x: val - x, self.X)
            )
            temp.pop(i)
            numerator = np.array(temp).prod()
            del temp
            # --------------------------------------
            """
            如果想获取更精确的插值,解锁如下注释...
            """
            # temp = list(
            #     map(lambda x: self.X[i] - x, self.X)
            # )
            # temp.remove(0)
            # denominator = np.array(temp).prod()
            # del temp
            """
            用如下注释顶替 result 输出结果...
            """
            # result = result + (self.Y[i] * numerator / denominator)
            # --------------------------------------
            result = result + self.__base[i]*numerator
        return result

    def Show(
        self,
        precision:int=12,
        mode:Literal['definition', 'simplify']='definition'
    ) -> None:
        """
        控制台显示拉格朗日多项式.
        """
        if mode == 'definition':
            showString = '\033[036mL(x)\033[0m = '
            for i in range(0, len(self.__base), 1):
                coef = self.__base[i]
                string = LAGRANGE.__PolynomialString(self.X, i, 'definition')
                temp = f'\033[033m%.{precision}f\033[0m{string} \033[031m+\033[0m ' % coef
                showString = showString + temp
            showString = showString[:-13]
            del temp
            print(showString)
        elif mode == 'simplify':
            showString = ''
            for i in range(0, len(self.__base), 1):
                coef = self.__base[i]
                string = LAGRANGE.__PolynomialString(self.X, i, 'simplify')
                string = string[:-1]
                temp = f'%.{precision}f*{string}+' % coef
                showString = showString + temp
            showString = showString[:-1]
            temp = str(expand(showString))
            expression= 'L(x) = '
            expression = expression + temp
            del temp
            print(expression)
        else:
            print('Error...')
            exit(0)

    def __BaseCoefficients(self) -> list:
        coefficientsVector = []
        for i in range(0, len(self.Y), 1):
            y = self.Y[i]
            temp = list(
                map(lambda x: self.X[i] - x, self.X)
            )
            temp.remove(0)
            denominator = np.array(temp).prod()
            coefficientsVector.append(y / denominator)
        del temp
        return coefficientsVector

    def __PolynomialString(vector:list, i:int, mode:str) -> str:
        temp = copy.deepcopy(vector)
        temp.pop(i)
        string = ''
        if mode == 'definition':
            for j in range(0, len(temp), 1):
                value = temp[j]
                if value > 0:
                    string = string + f'(x-{value})'
                elif value < 0:
                    string = string + f'(x+{abs(value)})'
                elif value == 0:
                    string = string + '(x)'
            del temp
            return string
        else:
            for j in range(0, len(temp), 1):
                value = temp[j]
                if value > 0:
                    string = string + f'(x-{value})*'
                elif value < 0:
                    string = string + f'(x+{abs(value)})*'
                elif value == 0:
                    string = string + '(x-0)*'
            del temp
            return string


if __name__ == '__main__':
    """
    以 y = (x^4)*(e^x) 为例.
    查看 LAGRANGE 类文档
    >>> print(LAGRANGE.__doc__)
    """
    # 测试拉格朗日插值类效果.
    print('\033[H\033[J', end='')
    print(LAGRANGE.__doc__)

    # ----------------------------------------
    # 插值核心代码.
    X = [-7, -6.2, -5.4, -4.6, -3.8, -3]
    Y = [2.18, 2.99, 3.84, 4.50, 4.66, 4.03]
    obj = LAGRANGE(X=X, Y=Y)
    value = obj.Interpolate(-5)
    # ----------------------------------------

    print(f'当 x = -5, 插值 L(x) = {value}')
    print('\n插值结果定义式:')
    obj.Show(precision=7, mode='definition')
    print('\n插值结果化简式')
    obj.Show(mode='simplify')
    print('')

    # ----------------------------------------

    import matplotlib.pyplot as plt

    x = np.linspace(-7, -1, 20)
    y1 = x**4 * np.exp(x)
    y2 = []
    for i in range(0, len(x), 1):
        y2.append(obj.Interpolate(x[i]))

    observation = plt.plot(X, Y, 'bo')
    interpolation = plt.plot(x, y2, 'r*')
    function = plt.plot(x, y1, 'g-')

    plt.title('Lagrange Interpolation')
    plt.legend(['observation', 'interpolation', 'function: $y=x^4e^x$'])
    plt.show()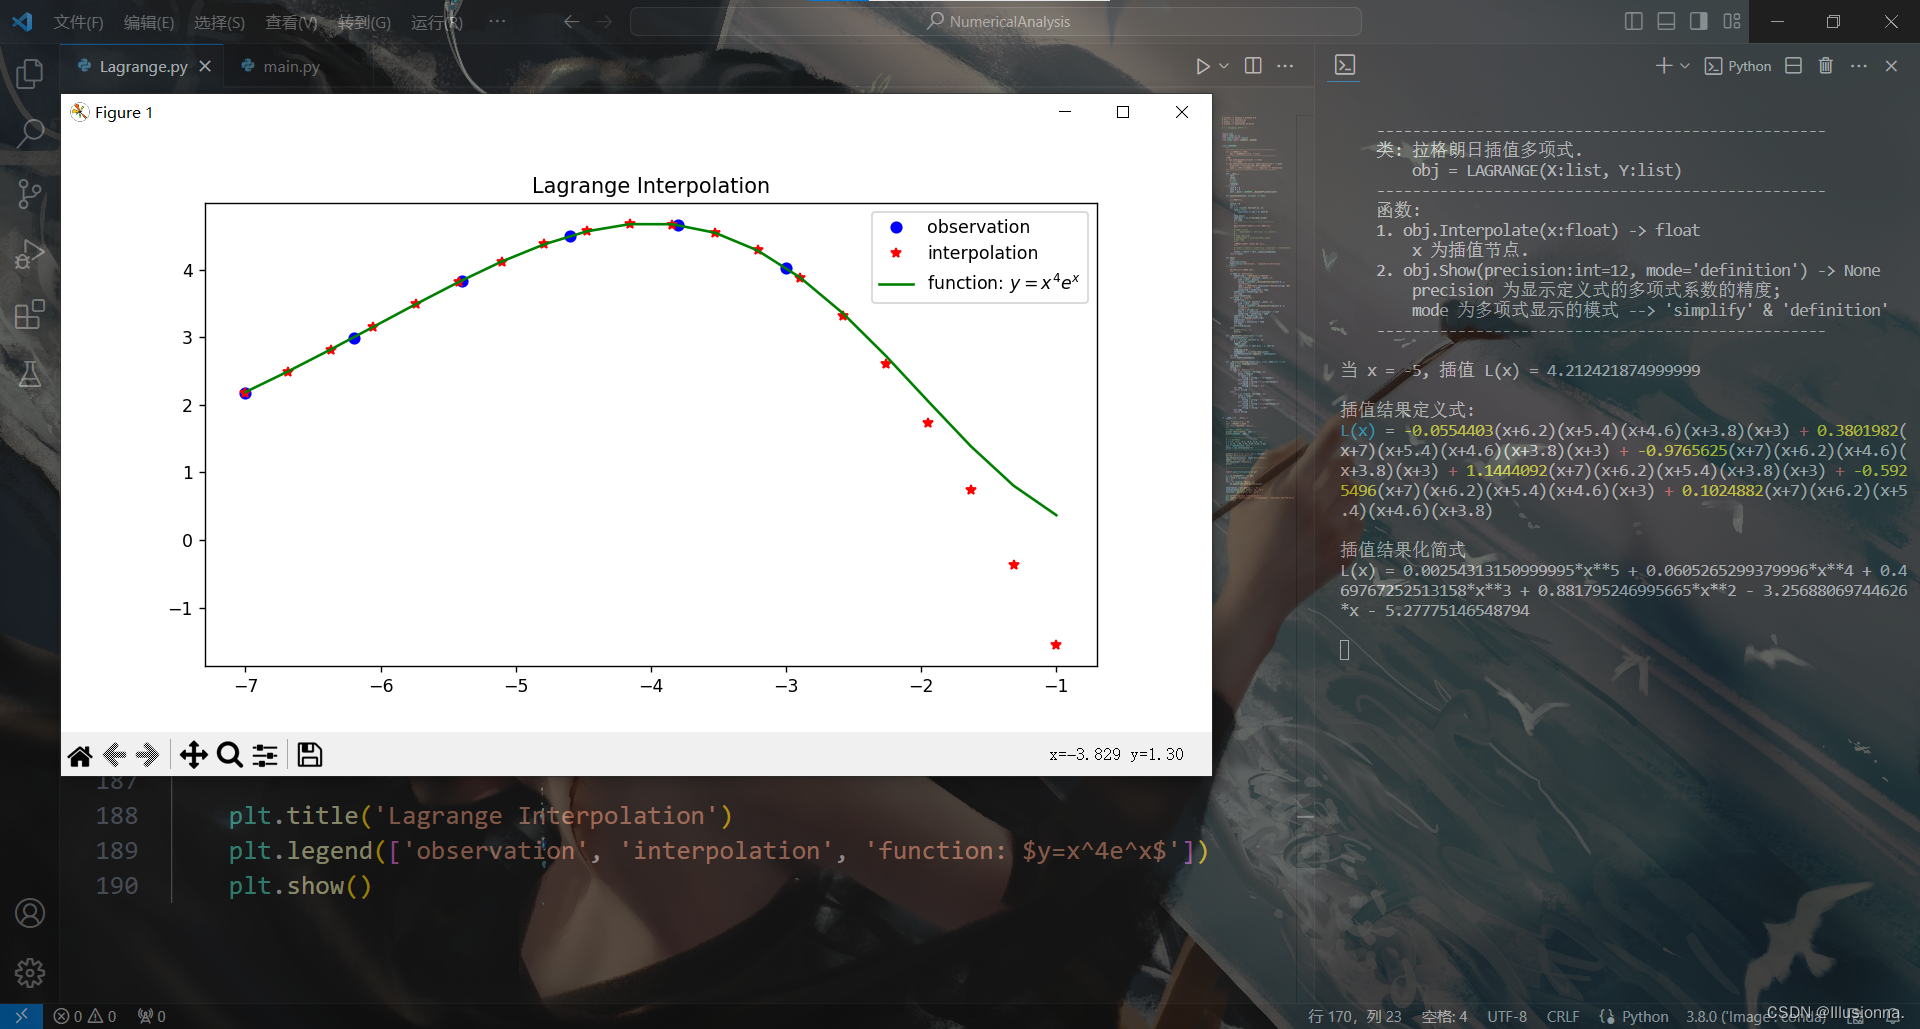


 被折叠的 条评论
为什么被折叠?
被折叠的 条评论
为什么被折叠?
 到【灌水乐园】发言


