


本文章是因为项目中之前遇到一个问题,需要在堆叠柱状图加上一个月份的flag,但是flag不能覆盖到柱状图。所以当时自己写了demo去查看相关的内容。
初始想法是参照官方文档扩展chart
<!DOCTYPE html>
<html lang="en-US">
    <head>
        <meta charset="UTF-8">
        <title>Document</title>
        <script type="text/javascript" src="Chart.js" ></script>
    </head>
    <body>
        <canvas id="myChart" width="400px" height="400px"></canvas>
        <script>
        var ctx = document.getElementById("myChart").getContext('2d');
        Chart.defaults.derivedBubble = Chart.defaults.bar;
        // I think the recommend using Chart.controllers.bubble.extend({ extensions here });
        var custom = Chart.controllers.bar.extend({
            draw: function(ease) {
                // Call super method first
                Chart.controllers.bar.prototype.draw.call(this, ease);

                // Now we can do some custom drawing for this dataset. Here we'll draw a red box around the first point in each dataset
                var meta = this.getMeta();
                var pt0 = meta.data[0];
                var radius = pt0._view.radius || 15;

                var ctx = this.chart.chart.ctx;
                ctx.save();
                ctx.strokeStyle = 'red';
                ctx.lineWidth = 1;
                ctx.fillRect(pt0._view.x - radius, pt0._view.y - radius, 2 * radius, 2 * radius);
                ctx.restore();
            }
        });
        // Stores the controller so that the chart initialization routine can look it up with
        // Chart.controllers[type]
        Chart.controllers.derivedBubble = custom;
        var myChart = new Chart(ctx, {
            type: 'derivedBubble',
            data: {
                labels: ["Red", "Blue", "Yellow", "Green", "Purple", "Orange"],
                datasets: [{
                    label: '1# of Votes',
                    data: [12, 19, 3, 5, 2, 3],
                     stack: 'Stack 0',
                    backgroundColor: [
                        'rgba(255, 99, 132, 0.2)',
                        'rgba(255, 99, 132, 0.2)',
                        'rgba(255, 99, 132, 0.2)',
                        'rgba(255, 99, 132, 0.2)',
                        'rgba(255, 99, 132, 0.2)',
                        'rgba(255, 99, 132, 0.2)'
                    ],
                    borderColor: [
                        'rgba(255,99,132,1)',
                        'rgba(255,99,132,1)',
                        'rgba(255,99,132,1)',
                        'rgba(255,99,132,1)',
                        'rgba(255,99,132,1)',
                        'rgba(255,99,132,1)'
                    ],
                    borderWidth: 1
                },
                {
                    label: '2# of Votes',
                    data: [1, 2, 3, 4, 5, 6],
                     stack: 'Stack 0',
                    backgroundColor: [
                        'rgba(54, 162, 235, 0.2)',
                        'rgba(54, 162, 235, 0.2)',
                        'rgba(54, 162, 235, 0.2)',
                        'rgba(54, 162, 235, 0.2)',
                         'rgba(54, 162, 235, 0.2)',
                          'rgba(54, 162, 235, 0.2)'
                    ],
                    borderColor: [
                        'rgba(54, 162, 235, 1)',
                        'rgba(54, 162, 235, 1)',
                        'rgba(54, 162, 235, 1)',
                        'rgba(54, 162, 235, 1)',
                        'rgba(54, 162, 235, 1)',
                        'rgba(54, 162, 235, 1)'
                    ],
                    borderWidth: 1
                },
                {
                    label: '3# of Votes',
                    data: [10, 9, 8, 7, 6, 5],
                     stack: 'Stack 0',
                    backgroundColor: [
                        'rgba(200, 162, 235, 1)',
                        'rgba(200, 162, 235, 1)',
                        'rgba(200, 162, 235, 1)',
                        'rgba(200, 162, 235, 1)',
                         'rgba(200, 162, 235, 1)',
                          'rgba(200, 162, 235, 1)'
                    ],
                    borderColor: [
                        'rgba(200, 162, 235, 1)',
                        'rgba(200, 162, 235, 1)',
                        'rgba(200, 162, 235, 1)',
                        'rgba(200, 162, 235, 1)',
                        'rgba(200, 162, 235, 1)',
                        'rgba(200, 162, 235, 1)'
                    ],
                    borderWidth: 1
                }]
            },
            options: {
                scales: {
                    yAxes: [{
                        ticks: {
                            beginAtZero:true
                        },
                        stacked: true
                    }],
                    yAxes: [{
                            stacked: true
                    }]
                }
            }
        });
        </script>
    </body>
</html>
但是效果不理想,如下:
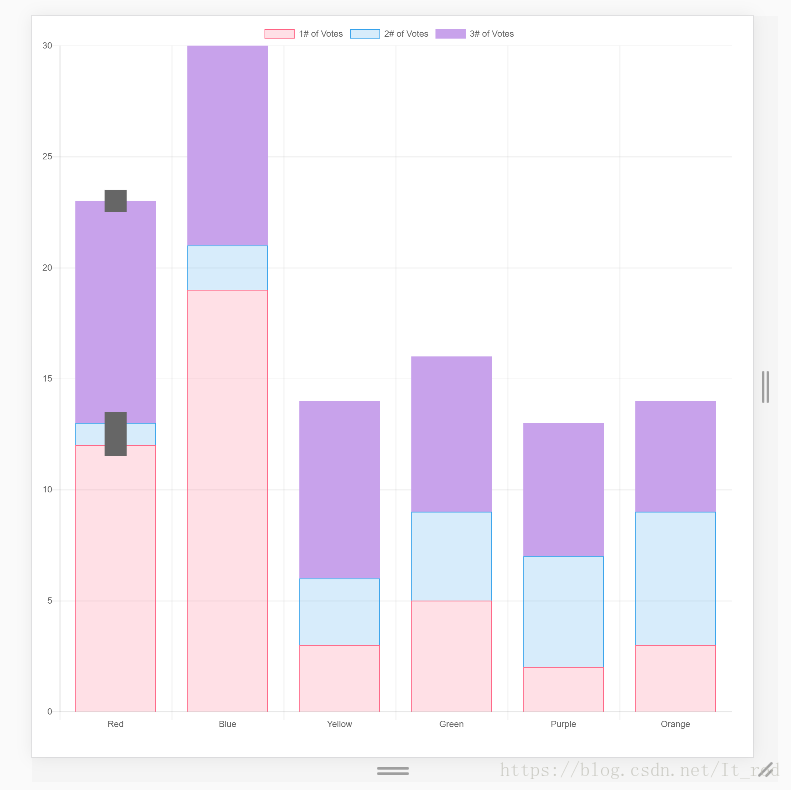
当前花了三个flag,这不是我想要的。第二是当前的flag覆盖在柱状图的上面。原因是因为:对于堆叠柱状图的绘制是从最后一个dataset开始画的,也就是从紫色的柱状图开始绘画。
绘画的顺序是先画紫色柱状图,然后绘画紫色柱状图上方的flag,然后再继续画浅蓝色的柱状图,浅蓝色柱状图上方的flag,浅红色柱状图,浅红色柱状图上方的flag。这也是为什么三个flag都在柱状图上方的原因。
解决flag在柱状图上面绘制
var custom = Chart.controllers.bar.extend({
    draw: function(ease) {
        // Now we can do some custom drawing for this dataset. Here we'll draw a red box around the first point in each dataset
        var meta = this.getMeta();
        var pt0 = meta.data[0];
        var radius = pt0._view.radius || 15;

        var ctx = this.chart.chart.ctx;
        ctx.save();
        ctx.strokeStyle = 'red';
        ctx.lineWidth = 1;
        ctx.fillRect(pt0._view.x - radius, pt0._view.y - radius, 2 * radius, 2 * radius);
        ctx.restore();


        // Call super method first
        Chart.controllers.bar.prototype.draw.call(this, ease);
    }
});

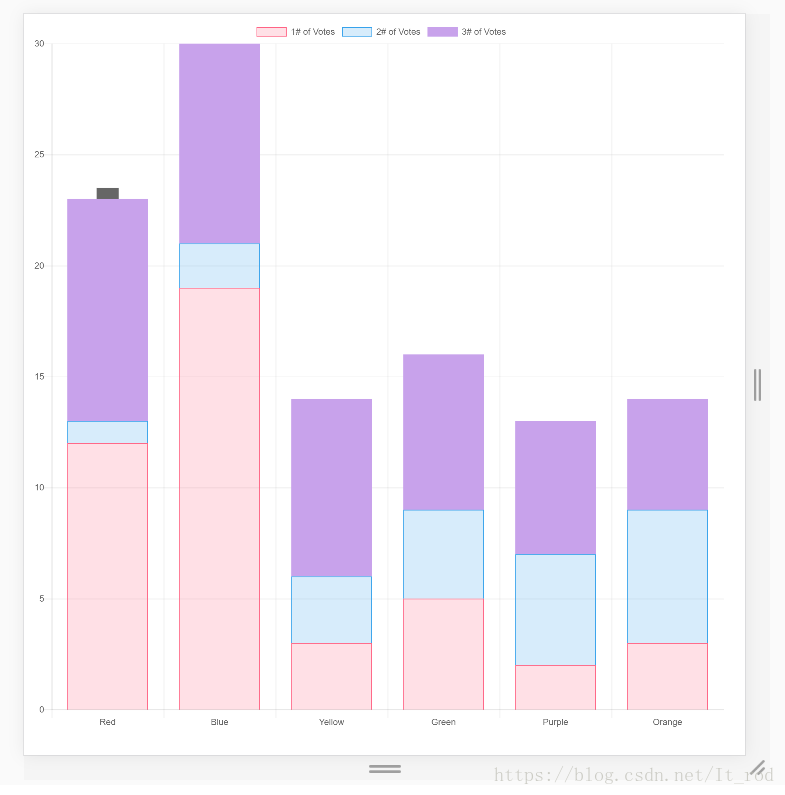
解决flag绘画三次
既然知道flag绘画三次的原因,那么我们只需要将flag只在最后一个dataset绘画就可以了。
var custom = Chart.controllers.bar.extend({
    draw: function(ease) {
        // Now we can do some custom drawing for this dataset. Here we'll draw a red box around the first point in each dataset
        var meta = this.getMeta();
        var pt0 = meta.data[0];
        var radius = pt0._view.radius || 15;

        //Draw the flag in the top of bar.
        if (pt0._model.datasetLabel == this.chart.data.datasets[this.chart.data.datasets.length - 1].label) {
            var ctx = this.chart.chart.ctx;
            ctx.save();
            ctx.strokeStyle = 'red';
            ctx.lineWidth = 1;
            ctx.fillRect(pt0._view.x - radius, pt0._view.y - radius, 2 * radius, 2 * radius);
            ctx.restore();
        }

        // Call super method first
        Chart.controllers.bar.prototype.draw.call(this, ease);
    }
});


 被折叠的 条评论
为什么被折叠?
被折叠的 条评论
为什么被折叠?
 到【灌水乐园】发言


