


需要使用到第三方库,Qcustomplot,可以去官网下载源码.h和.cpp文件,然后当成普通文件导入自己的项目即可。
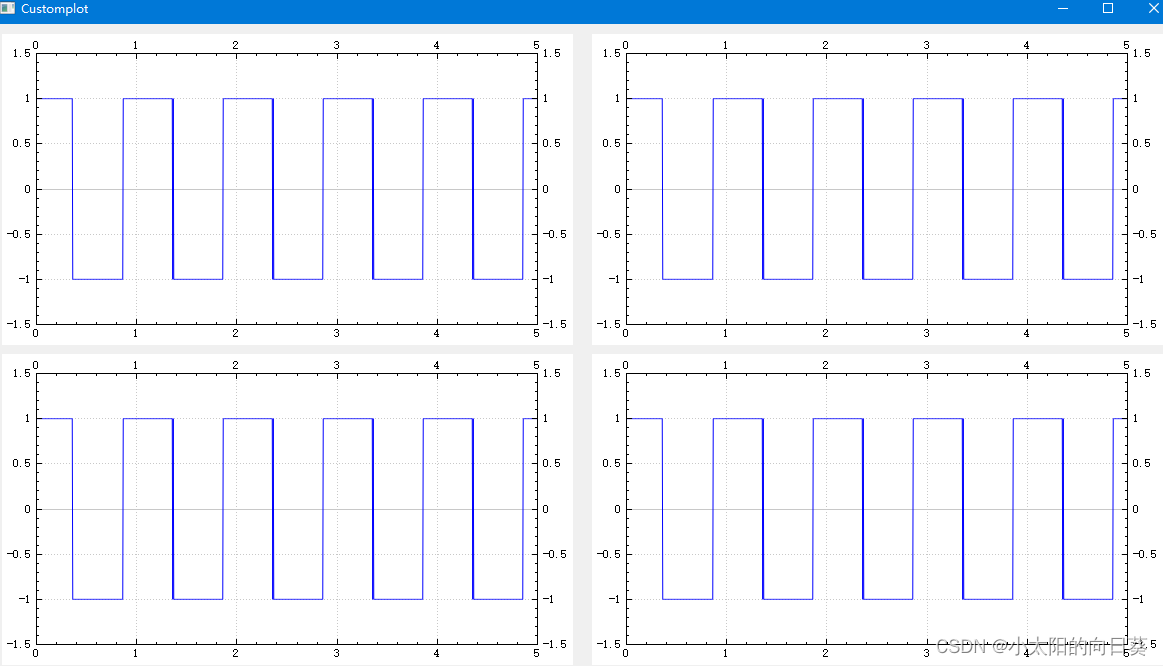
直接上代码。绘制了4个图,用定时器器不断更新图形,其实就是刷新坐标数据。
.h文件代码
#ifndef CUSTOMPLOT_H
#define CUSTOMPLOT_H

#include <QWidget>
#include "qcustomplot.h"
#include <QTimer>
#include <iostream>

QT_BEGIN_NAMESPACE
namespace Ui { class Customplot; }
QT_END_NAMESPACE

class Customplot : public QWidget
{
    Q_OBJECT

public:
    Customplot(QWidget *parent = nullptr);
    ~Customplot();

private:
    void initData();
    void initUi();
    void initSlots();

private slots:
    void changWave();

private:
    Ui::Customplot *ui;
    QVector<QCustomPlot *>cpt;
    QVector<double> x;  ///< x坐标数据
    QVector<double> y;  ///< y坐标数据
    int num;            ///< 一共多少对坐标点
    QTimer *m_time;
};
#endif // CUSTOMPLOT_H
.cpp文件代码
#include "customplot.h"
#include "ui_customplot.h"

Customplot::Customplot(QWidget *parent)
    : QWidget(parent)
    , ui(new Ui::Customplot)
{
    ui->setupUi(this);
    initData();
    initUi();
    initSlots();
}

Customplot::~Customplot()
{
    delete ui;
}

void Customplot::initData()
{
    cpt.push_back(ui->cpt1);
    cpt.push_back(ui->cpt2);
    cpt.push_back(ui->cpt3);
    cpt.push_back(ui->cpt4);

    /// 生成方波数据,先生成一个周期的数据
    num = 1000 * 5;
    x.reserve(num), y.reserve(num);
    x.resize(num), y.resize(num);
    double T = 1.;  ///< 周期
    for (int i = 0; i < 1000; i ++) ///< 先生成一个周期的数据,共计1000个坐标点
    {
        x[i] = i * T / 1000;
        if (x[i] < T / 2)
        {
            y[i] = 1;
        }
        else
        {
            y[i] = -1;
        }
    }

    /// 继续生成后面[1000, 5000)的数据点
    int i = 0, j;
    for (j = 1000; j < num; j ++)
    {
        x[j] = (j / 1000) + x[i];
        y[j] = y[i ++];
        if (i == 1000)
        {
            i = 0;
        }
    }

    m_time = new QTimer();
}

void Customplot::initUi()
{
    for (int i = 0; i < 4; i ++)
    {
        /// 设置副轴可见且设置其范围
        cpt[i]->xAxis2->setVisible(true);
        cpt[i]->yAxis2->setVisible(true);
        cpt[i]->xAxis2->setRange(0, 5);
        cpt[i]->yAxis2->setRange(-1.5, 1.5);

        cpt[i]->addGraph();    ///< 增加一幅图到坐标中
        cpt[i]->graph(0)->setLineStyle(QCPGraph::LineStyle::lsLine);   ///< 设置线条
        cpt[i]->setInteractions(QCP::iRangeDrag | QCP::iRangeZoom);    ///< 设置图可以被缩放和拖动
        cpt[i]->yAxis->setRange(-1.5, 1.5);
        cpt[i]->graph(0)->setData(x, y);   ///< 设置其数据
        cpt[i]->replot();
    }
}

void Customplot::initSlots()
{
    QObject::connect(m_time, &QTimer::timeout, this, &Customplot::changWave);
    m_time->start(10);
}

void Customplot::changWave()
{
    ///< 此处模拟方波更新数据,其实就是不断将原数据左侧部分截取到原数据末尾
    ///< 这样显示出来就像是不断更新的新数据
    std::rotate(y.begin(), y.begin() + 20, y.end());
    for (int i = 0; i < 4; i ++)
    {
        cpt[i]->graph(0)->setData(x, y);   ///< 设置其数据
        cpt[i]->replot();
    }
}
效果如下:


 8708
8708

 被折叠的 条评论
为什么被折叠?
被折叠的 条评论
为什么被折叠?
 到【灌水乐园】发言


